Abstract
Studies of differentiation abilities of stem cells have been attracting a lot of attention over the last years. Microscopy can be used to record details of the differentiation process of stem cells under different perturbations and is an important tool for studying stem cell differentiation. Since it is infeasible to quantitatively analyze a huge amount of image data manually, automated image analysis systems are urgently needed. However, the complicated morphological appearances of stem cells are challenging to the existing segmentation methods. Herein, we propose a new, automated scheme for stem cell segmentation. This scheme first uses the multi-scale blob and curvilinear structure detectors to delineate the skeletons of stem cells quickly and then segment out stem cells by refining the skeletons to the cell boundaries using multi-level sets. The initial experimental results indicate the effectiveness of the proposed scheme.
Index Terms: stem cell differentiation, blob detection, curvilinear structure detection, cell segmentation, level set
1. INTRODUCTION
In recent years, the field of stem cell biology and regenerative medicine is rapidly moving toward clinical practice. This is propelled by the advancement in directed stem cell differentiation into specific lineages. In neuroscience research, it is already well known that both embryonic and neural stem/progenitor cells can give rise to neurons, astrocytes, and oligodendrocytes [1–2]. However, currently the differentiated cells are still less than satisfactory for clinical usage. Effective differentiation techniques are needed to obtain highly faithful transplantable tissues.
Most current differentiation studies use candidate gene approach in which the scope is limited. The situation can be improved by the introduction of high-throughput techniques in which thousands of conditions can be tested simultaneously. However, such an attempt is hampered by the lack of appropriate informatics tools that can automatically process the biological images to assess the differentiation results. Traditionally, the result is evaluated manually by the expression of characteristic biomarker molecules. With the development of the advanced bioimage processing technique, major technical obstacles have been removed. We therefore initiated our effort to analyze the stem cell differentiation automatically.
Figure 1 shows two stem cell images. Several notable characteristics that are common in the analysis of differentiation of embryonic and neural stem cells are listed as follows. 1) Cell consists of two structural components, a blob, i.e., cellular body, which locates in the center of cell and several processes, i.e., curvilinear structures, which link with the blob. 2) The intensity contrast between parts of the processes and the background is low. 3) Local intensity variations appear inside the cells. 4) Cells are sometimes clustered and particularly the processes are highly overlapped.
Fig.1.
Typical phase contrast images of differentiating stem cells. (A) Image of differentiating embryonic stem cells [1]. (B) Image of differentiating neural stem cells [2].
Considering the aforementioned characteristics of stem cells, it is non-trivial to segment stem cells accurately. Although a large number of cell segmentation methods have been proposed, such as simple thresholding [3], voronoi [4], seeded watershed [5], graph cut [6], and active contour [7], none of these methods can generate accurate cell segmentation results without any adjustments for specific images. Simple thresholding method cannot separate cell pixels with low intensity contrast from the background, and cannot separate touching cells. Voronoi method only can generate the rough regions of cells. Seeded watershed builds the cell boundaries on the pixels with the maximum intensity (or maximum gradient) between two cells. Therefore it is prone to errors when the intensity variation appeared inside cells and the boundary pixels do not have the maximum intensities (or maximum gradient). Graph cut method tries to cut the images through the pixels that have different properties, e.g. intensity change, within their neighbors. However, intensity variations will cause the inaccurate graph cuts. Active contour has two implementations, parametric and non-parametric active contour (level set). They both require good initial contours that are close to the real boundaries, otherwise the intensity variation will result in edge leaking and early edge stop.
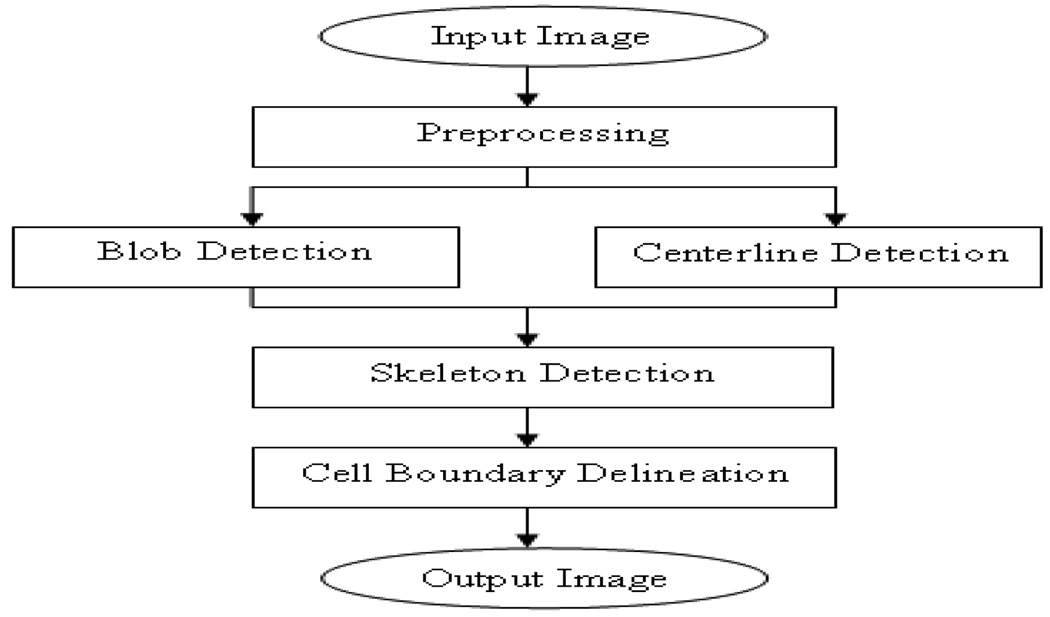
In this paper, we propose a novel stem cell segmentation scheme using multi-scale space techniques. The flowchart of the proposed scheme is shown in Figure 2. The essential idea of our approach is to separately detect the two structural components of stem cells, i.e. the blob and the centerlines of the processes, using multi-scale space blob and curvilinear detectors, and then integrate the detected results together to provide good initial cell contours for multi-level sets. The rest of the paper is organized as follows. The details of the proposed scheme are presented in Section 2. Section 3 provides the experimental validation while Section 4 concludes this study.
Fig.2.
Flowchart of the proposed stem cell segmentation scheme.
2. SEGMENTAION SCHEME
2.1. Image pre-processing
Uneven illumination is corrected by a data-driven method proposed in [8]. It works by iteratively making better cubic B-spline estimates of the image background. The corrected image is obtained by subtracting the estimated image from the original image. In practice, we find that the convergence is fast and robust, and the result is satisfying. Furthermore, the median filter is employed to remove the noise.
2.2. Multi-scale Laplacian-of-Gaussian (LOG) for blob detection
Multi-scale LOG filters is an effective technique to measure the saliency of the blob structures [9]. This method is employed to detect the blob-like features of stem cells. Specifically, the image is convolved with Gaussian filters with a series of continuous variance to form a scale space representation. Then a blob detector, Laplacian differential operator, is applied over the scale space to detect the blob-like features. In other words, we make use of a bank of LOG filters with different scales to filter the original images. In the maximum intensity projection (MIP) image of the series filtered images, the local intensity maxima indicate the centers of the blob-like features of stem cells. Therefore, we obtain the centers of the blob-like features by applying the Ostu thresholding method to the MIP image.
Mathematically, the 2D LOG filter at a scale σ can be written as,
| (1) |
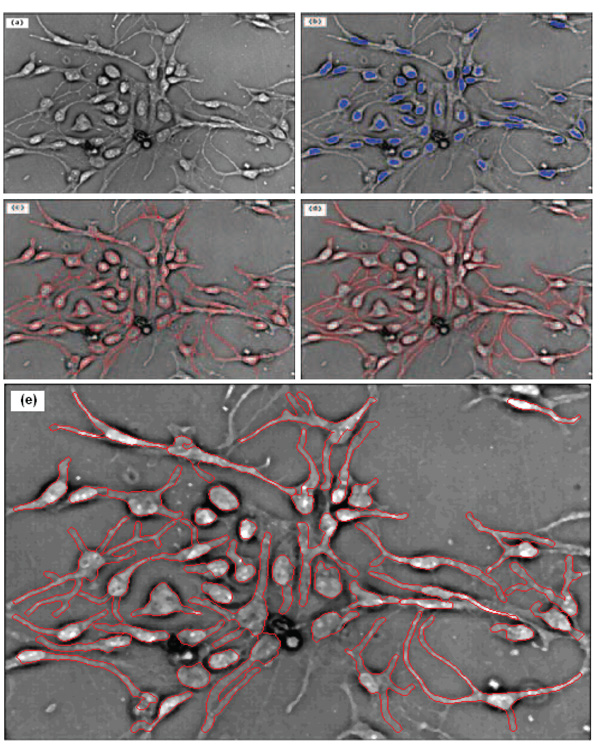
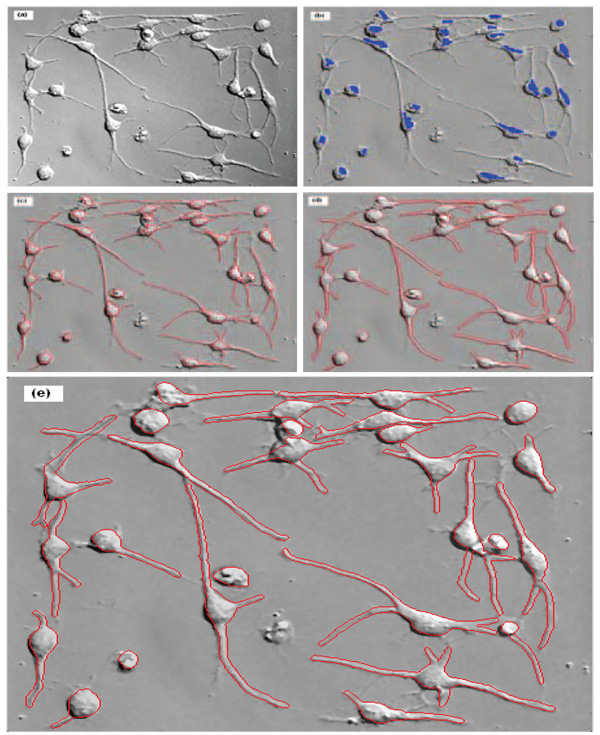
Let L(x,σ) = σ2I(x) * h(x,σ), where σ2 is a normalizing factor to guarantee the scale invariance of the LOG operator. The maximum value of L(x,σ) through varying scales, , measures the saliency of the blob-like feature at position x with the most appropriate scale σ*. Here LMIP(x) is the MIP image of the series of L(x,σ), from which we obtain the blob-like feature centers by using a simple thresholding method. Figure 3(b) and 4(b) show the representative detected blobs of single stem cells.
Fig.3.
Segmentation result of embryonic stem cell image. (a) The original image; (b) the blue blobs indicate the detected blob-structures; (c) the red curves show the skeleton structures of cells; (d) the final segmentation result; and (e) is the enlarged version of (d).
Fig.4.
Segmentation result of neural stem cell image. (a) The original image; (b) the blue blobs indicate the detected blob-structures; (c) the red curves show the skeleton structures of cells; (d) the final segmentation result; and (e) is the enlarged version of (d).
2.3. Modified multi-scale curvilinear detector for centerline detection
To detect the processes’ centerlines of stem cells, a modified method based on the multi-scale curvilinear structure detector [10] is proposed. Although the method [10] can detect both thick and thin curvilinear structures’ centerlines simultaneously due to its scalability, it has an obvious disadvantage to deal with the branching areas. In [10], the Hessian matrix was used to estimate the normal direction of each pixel. The eigenvector corresponds to the smaller and negative eigenvalue of the Hessian matrix points to the normal direction of the pixel. Therefore, each pixel has only one direction in this method. However, for branching areas, most pixels have more than one directions, furthermore, the eigenvector does not point to the normal direction of the centerline. To address this problem, we apply a steerable filter [11] instead of the Hessian matrix to give rise to multiple directions for those areas. This modified method can detect both the single processes and the branching areas.
In this improved method, two kinds of steerable filters G′(x,y,θ,σ) and G″(x,y,θ,σ) with direction θ are designed as,
| (2) |
| (3) |
where G(x,y,σ), Gx(x,y,σ) denote Gaussian and partial derivative function. Let’s define the following test function at pixel (x,y) under direction θ,
| (4) |
where the appropriate scale σθ satisfies the criterion [10] σθ = arg max(−l″(x,y,θ,σ)), l′(x,y,θ,σ) and l″(x,y,θ,σ) are the first and second normalized derivatives, which can be estimated by convolving the image with steerable filters described in (2)–(3) and multiplying the normalized coefficients similar as done in [10]. Now we quantize all the direction [0,2π] into 16 directions uniformly. Each direction is indicated by an index number from the set: {0,1,2,…,15}. For each pixel (x,y), we can calculate a vector t(x,y) with length 16, and (x,y) can be considered as a centerline candidate, if we find at least one index i from the set {0,1,2,…,15} such that |t(x,y,θi)| < 1/2 and −l″(x,y,θi,σθi) is larger than the user-specified threshold.
2.4. Skeleton detection
After the detection of blob-like feature and the centerline of processes, we can obtain the whole skeleton of stem cells successfully by the following steps. First, we expand the detected blobs using multi-level sets described in Section 2.5, because the detected blob-like feature centers are only small part of the whole blob, as seen in Figure 3(b) and 4(b). Second, we eliminate the noise centerlines according to their length, direction and intensity. Third, we link the filtered centerlines to the corresponding blobs, using the direction and distance information. And last, some centerlines, which link with at least two blobs, are cut off heuristically from the thinnest point. Figure 3(c) and 4(c) show the representative skeletons of single stem cells.
2.5. Multi-level sets for cell boundary delineation
To delineate the blob-like feature boundaries and then segment the whole stem cells, we employ the multi-level sets method [12]. This method is suitable for the cases with local intensity variations and clustered cells, which are present in our considered stem cell images. In this method, the corresponding level set evolution equation is as follows,
| (5) |
Here κ is the Euclidean curvature; c, d, and e are constants; g(I) = 1/(1 + |∇I|); h(I) is a rough segmentation using Fuzzy c-means clustering which is introduced to supplement the local edge information in g(I) with global regional information. We represent each single stem cell using one level set. To avoid the crossing of different level sets, the following equation is proposed
| (6) |
where n is the object number and m is the iteration step. Using the detected skeletons of single cells and the multi-level sets, the cell boundaries can be accurately delineated. The representative stem cell segmentation results are provided in Figure 3(d) and 4(d) while the enlarged versions of the results are shown in Figure 3(e) and 4(e).
3. EXPERIMENTAL VALIDATION
Two kinds of differentiating stem cell images, i.e. embryonic and neural stem cells, are selected to validate the proposed segmentation method. The representative results for our approach are provided in Figures 3–4. For further validation, we randomly select ten images with a 450 by 450 resolution from two differentiating neural stem cell sequences requested in [2]. Five kinds of errors occur, i.e. missed blobs, missed processes, false processes, under-detected blobs and over-detected blobs. Note that under-detection means several blobs are recognized as one blob, and in case of over-detection one blob is distinguished to multiple blobs. We compare the automated results with the manual results as ground truth. Table 1 provides the detailed statistical results, in which the total numbers of blobs and processes refer to the manual results. On average, 90.8% of the cell blobs are detected correctly; 2.2% of the cell blobs are missed, and 7% of the cell blobs, including 6.7% under-detected blobs and 0.3% over-detected blobs, are false detected. 85.1% of the processes are detected correctly; the rate of missed processes is 10.2% and the false processes rate is 4.7%. Our method is implemented in Matlab.
Tab.1.
The segmentation results of ten selected images.
| Img. | Total No. of Blobs |
Total No. of Proc. |
Missed Blobs (%) |
Under- detected Blobs (%) |
Over- detected Blobs (%) |
Missed Proc. (%) |
False Proc. (%) |
|---|---|---|---|---|---|---|---|
| 1 | 8 | 22 | 0.0 | 25.0 | 0.0 | 9.1 | 0.0 |
| 2 | 17 | 33 | 5.9 | 11.8 | 0.0 | 9.1 | 6.1 |
| 3 | 34 | 45 | 2.9 | 0.0 | 2.9 | 11.1 | 6.7 |
| 4 | 44 | 56 | 2.3 | 9.1 | 0.0 | 10.7 | 5.4 |
| 5 | 53 | 71 | 3.8 | 7.5 | 0.0 | 7.0 | 2.8 |
| 6 | 10 | 21 | 0.0 | 0.0 | 0.0 | 9.5 | 4.8 |
| 7 | 14 | 25 | 0.0 | 0.0 | 0.0 | 12.0 | 8.0 |
| 8 | 20 | 35 | 0.1 | 0.0 | 0.0 | 8.6 | 2.9 |
| 9 | 27 | 46 | 0.0 | 0.0 | 0.0 | 8.7 | 4.3 |
| 10 | 30 | 48 | 6.7 | 13.3 | 0.0 | 16.7 | 6.2 |
| Avg. | 26 | 40 | 2.2 | 6.7 | 0.3 | 10.2 | 4.7 |
4. CONCLUSION
In this paper, we propose a new stem cell segmentation scheme that combines multi-scale blob/curvilinear detector techniques and multi-level sets to study the differentiation abilities of embryonic and neural stem cells. The experimental results using ten neural stem cell image datasets show good performance of the proposed scheme for the identification and segmentation of stem cells. In the future work, we will develop tracking and classification methods based on the proposed stem cell segmentation method to quantitatively study the dynamic behaviors of the differentiation of stem cells.
ACKNOWLEDGEMENTS
H. Peng, X. Zhou, F. Li, X. Xia, and STC Wong are supported by a Bioinformatics Program grant from The Methodist Hospital Research Institute, NIH R01 LM008689, R01 LM009161, R01 CA121225, and R01 AG028928 (Wong). H. Peng is also partially funded by a seed grant from The Institute of Biomedical Imaging Sciences (IBIS) of Methodist-Cornell-University of Houston (Zhou).
REFERENCES
- 1.Brüstle O, et al. Embryonic Stem Cell-Derived Glial Precursors: A Source of Myelinating Transplants. Science. 1999;Vol. 285:754–756. doi: 10.1126/science.285.5428.754. [DOI] [PubMed] [Google Scholar]
- 2.Ravin R, et al. Potency and Fate Specification in CNS Stem Cell Populations In Vitro. Cell Stem Cell. 2008;Vol. 3(No. 6):670–680. doi: 10.1016/j.stem.2008.09.012. [DOI] [PubMed] [Google Scholar]
- 3.Otsu N. A threshold selection method from gray-level histograms. IEEE Trans. SMC. 1979;Vol. 9(no. 1):62–66. [Google Scholar]
- 4.Jones TR, Carpenter AE, Golland P. Voronoi-based segmentation of cells on image manifolds. In: Liu Y, Jiang T, Zhang C, editors. CVBIA, ser. Lecture Notes in Computer Science. vol. 3765. Springer; 2005. pp. 535–543. [Google Scholar]
- 5.Vincent L, Soille P. Watersheds in digital spaces: an efficient algorithm based on immersion simulations. IEEE Trans. PAMI. 1991;Vol. 13:583–598. [Google Scholar]
- 6.Boykov Y, Jolly M. Interactive graph cuts for optimal boundary and region segmentation of objects in N-D images. Int. Conf. on Computer Vision. 2001;Vol. 1:105–112. [Google Scholar]
- 7.Kass M, et al. Snakes: active contour models. International Journal of Computer Vision. 1988;Vol. 1:321–331. [Google Scholar]
- 8.Wählby C, et al. Algorithms for cytoplasm segmentation of fluorescence labelled cells. Analytical Cellular Pathology. 2002;Vol. 24:101–111. doi: 10.1155/2002/821782. [DOI] [PMC free article] [PubMed] [Google Scholar]
- 9.Bai W, Zhou X, Zhu J, Ji L, Wong STC. Tracking of migrating Glioma cells in feature space. ISBI. 2007:272–275. [Google Scholar]
- 10.Xiong G, Zhou X, Degterev A, Ji L, Wong STC. Automated neurite labeling and analysis in fluorescence microscopy images. Cytometry Part A, 69 A. 2006:494–505. doi: 10.1002/cyto.a.20296. [DOI] [PubMed] [Google Scholar]
- 11.Freeman WT, Adelson EH. The design and use of steerable filters. IEEE Trans. Pattern Anal Machine Intell. 1991;Vol. 13(no. 9):891–906. [Google Scholar]
- 12.Xiong G, Zhou X, Ji L. Automated segmentation of Drosophila RNAi fluorescence cellular images using deformable models. IEEE Transactions On Circuits And Systems-I: Regular Papers. 2006;Vol. 53(No. 11):2415–2424. [Google Scholar]


