Abstract
We report multifactorial analysis of candidate mechanisms of Alzheimer's disease utilizing high content analysis, gene expression microarray, and linear regression model to integrate neuronal imaging data with hippocampal gene expression data. Our analysis led to the identification of several genes that may contribute to different image traits or phenotypes in the amyloid-beta (Aβ) injured neurons. Gene network and biological pathways analysis for those genes were further analyzed and led to several novel pathways that may contribute to amyloid plaque triggered neurite loss.
I. Introduction
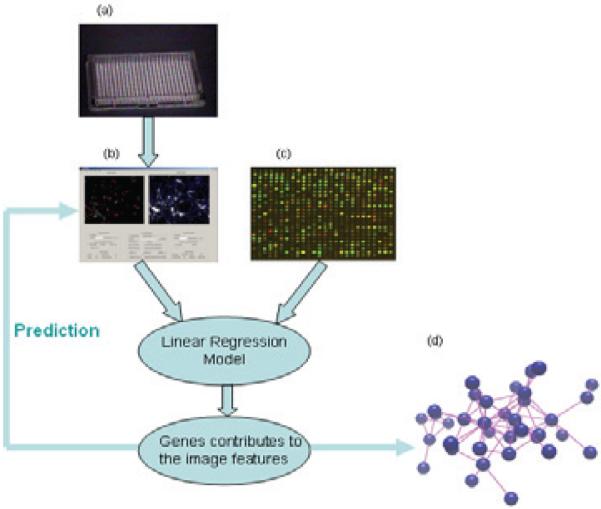
Alzheimer's disease (AD) is considered as one of the most common age associated neurodegenerative disorders affecting tens of millions worldwide. Extracellular amyloid plaques, intracellular neurofibrillary tangles (NFT), cerebrovascular amyloid, dystrophic neuritis, and loss of synaptic connections are classical markers of neurodegeneration in AD. Currently the leading hypothesis argues that aberrant toxic Aβ aggregation causes synaptic dysfunction, oxidative stress, ionic dyshomeostasis, tau aggregation, and apoptosis [1]. Advanced microscopic imaging and image analysis methods have been developed to observe and analyze neuronal images under neurodegenerative conditions [2-6]. Meanwhile, development of microarray technology provides neurobiologists with a tool to simultaneously measure the expression levels of tens of thousands of genes, offering possible molecular clues regarding mechanisms underlying the disease pathophysiology [7-10]. However, a coherent picture explaining cellular changes associated with AD at the molecular level has not emerged thus far. We employed a linear regression model for establishing a link between image features and microarray data. Figure 1 describes the concept of the proposed integrative genomics and bioimaging approach. We termed this approach an “image based system biology.”
Fig.1.
Basic idea of our work. High content image data generated from (a) is analyzed using NeuriteIQ in (b),; (c) is published gene expression AD related microarray data. Analytic results from (b) and (c) are entered into a regression model in order to select candidate genes, and then a group of candidate AD genes are detected using elastic net. (d) is the detected gene network.
II. Materials and methods
Gene microarray data from 31 individuals, comprising controls, incipient, moderate and severe of AD were utilized in the paper. The detailed description of the experiment can be found in the original publication [7].
Image acquisition
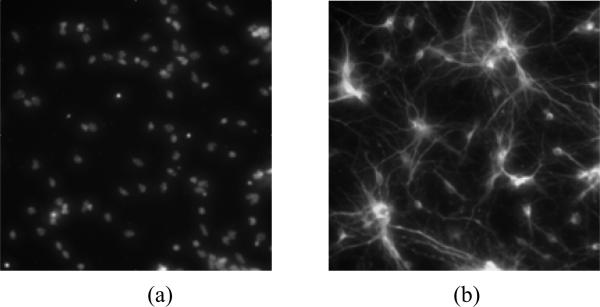
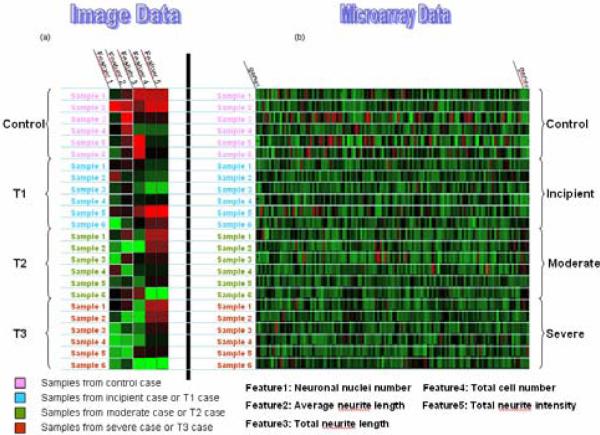
Experiment is designed to evaluate AD-associated neurotoxicity corresponding to the data generated in the microarray. Since Aβ is well established to represent a key factor in the development of AD, isolated mouse cortical neurons were subjected to three insults, reflecting different severity of Aβ -induced injury: 2.5μM Aβ for 6 hr (T1); 5 μM Aβ for 24 hr (T2); and 10 μM A-beta for 72hr (T3). Nuclei image and neurite images are acquired separately using fluorescent microscopy (Fig. 2). An assumption is made that the treatments T1, T2, and T3 correspond to incipient, moderate, and severe stages of AD (Fig.3)
Fig.2.
Microscopic image acquisition examples using high content screening: (a) is a nuclei image; (b) is a neurite image.
Fig.3.
shows how image data match microarray data. (a): Five image features are derived from neuriteIQ for each sample, and two of five features are involved in our study. We processed 6 samples for each condition. (b): In microarray data, there are 6 samples for each condition too. The assumption is condition T1, T2, T3, and Control in image data correspond to Incipient, Moderate, Severe, and Normal control cases.
Image data processing
Neuronal and nuclear images are processed using a software program, NeuriteIQ, developed by our group. This program segments nucleus in nuclear channel based on the gradient vector field and watershed methods and extracts soma region and skeleton of neurites by using Fuzzy C means clustering and curvilinear structure method in neurite channel [4]. Many parameters describing neurite length and other morphologic features can be assessed following image processing, including nuclei number, average neurite length, and average nuclei area. These parameters are considered as image features in the following model. Neurite loss and neuronal death were increased at the higher concentration or longer exposure to Aβ, which we propose may correspond to different degrees of disease severity.
Microarray data processing
178 gene candidates are selected according to KEGG (Kyoto Encyclopedia of Genes and Genomes) and commercial software, Ingenuity (http://www.ingenuity.com/). These genes are considered as AD related genes according to the literature searches. A new microarray data matrix is constructed based on these gene candidates.
Linear regression model
Our goal focuses on identifying groups of genes which contribute to the image features derived from NeuriteIQ and predicting the image features from combination of selected genes expression value. Therefore, a linear regression model is utilized to model this procedure.
| (1) |
Y = [y1...yi...ym]T is the image feature vector, yi is the image feature from ith sample; M is total sample number, X = [X1,...,Xj,...XN] is the model matrix, N is the total gene number, where Xj = (x1j,...xij,...xMj)T, j = 1,..., N are j th gene expression through all the samples; N is total gene number; xij is the expression value of j th gene in i th sample; b = [b1,...,bj,...bN]T is the weight vector of genes; bj represents the weight of j th gene in the prediction, δ is the noise and is not our focus in this work. For each condition, image features are averaged and considered as responses to microarray data.
LA-SEN (‘Elastic net’) is chosen to estimate weight vector b satisfying:
| (2) |
where , , λ1 and λ2 are non-negative turning parameters. For detailed description of LA-SEN and codes in R, please access Trevor Hastie's website http://www-stat.stanford.edu/~hastie/index.html. Simple normalization steps are required before applying LA-SEN. Parameters involved in these steps are determined by k-fold cross validation as described in original publication of LA-SEN [10]. After solving b, a group of genes whose coefficients in vector b are nonzero are detected and considered as important genes contributing to the image feature described in vector Y. Gene network based on the selected important genes can be generated by searching gene interaction information using Ingenuity software suite.
III. Results
Image feature prediction based on microarray data
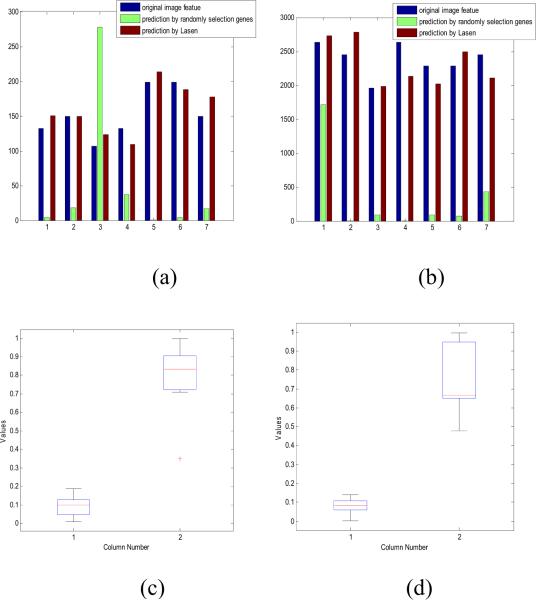
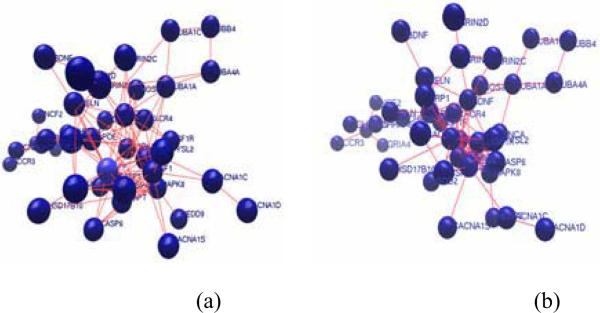
Two image features derived from NeuriteIQ analysis, Aβ -induced decrease of average neurite length and neuronal nuclei number, were utilized in the study. These features are important because they reflect neuronal dysfunction and neuronal death. We take 24 samples as training data and 7 samples as testing data. After applying elastic net, 40 and 45 genes whose coefficients in b are nonzero, were selected as key genes potentially contributing to the two selected image features. To verify the prediction results, weight matrix b was multiplied to microarray data matrix derived from testing data and average prediction error was calculated based on the test samples. In addition, we performed similar analysis using randomly selected 40 genes and 45 genes in predicting two image features. Next, we estimated the weight vector br using ordinary least squares and calculate the average prediction error. From Fig.4 it is obvious that prediction based on ‘elastic net’ was more accurate than random selection. Gene network resulting from “elastic net” analysis is shown in Fig. 5.
Fig.4.
Comparison between prediction results based on ‘elastic net’ and randomly selection. Blue bars represent original image feature derived from NeuriteIQ, red bar represent prediction based on ‘elastic net’ while green bar corresponds to randomly selection. (a) shows the result of neurite length analysis and (b) represents neuronal number. (c) and (d) are box-plots for average prediction error based on different methods, column1 is based on LASEN and column 2 represents randomly selection. (c) is the from neurite length prediction and (d) represents neuronal number prediction.
Fig.5.
Gene network for (a) neurite length reduction, and (b) nuclei number reduction.
Significance of the cellular signaling processes correlating to extracted neuronal image features
We attempted to identify cellular pathways correlated to the two biological processes, neuronal death, and neurite degeneration. Pathways, containing genes of interest, were identified using web-based software ‘WebGestalt,’ which incorporates information from multiple public resources. This analysis identified 33 and 29 putative pathways involved in neurite length reduction prediction and neuronal number reduction prediction, respectively. Some of the pathways are listed in Table.1 and Table.2. Calcium signaling pathway, gap junction pathway, MAPK pathway and apoptosis were identified as major categories since they contain large subsets of the identified genes. Our data also identified the contribution of some of the pathways to both biological processes. Calcium dysregulation, apoptosis and MAPK pathway signaling have been previously implicated in the pathopysiology of Alzheimer's disease [11-12]. Our data reveals that these pathways may contribute to the upstream steps in neurodegeneration, involving neurite loss and neuronal dysfunction and preceding death of neuronal bodies, .
Table.1.
Pathways in neurite length prediction
| Gap junction |
| MAPK signaling pathway |
| Calcium signaling pathway |
| Neuroactive ligand-receptor interaction |
| Adherens junction |
| Apoptosis |
| Cytokine-cytokine receptor interaction |
| Insulin signaling pathway |
Table.2.
Pathways in neurite length prediction
| Calcium signaling |
| Gap junction |
| MAPK signaling |
| Neuroactive ligand-receptor interaction |
| Long term potentiation |
| Apoptosis |
| Regulation of actin cytoskeleton |
| Leukocyte transendothelial migration |
Based on our results, many genes in gap junction pathway (e.g. TUBA1C, TUBB4) appear important in prediction both cell death and neurite loss because they possess relatively higher absolute weight values. To our knowledge, this is the first result pointing to the potential role of gap junction regulation in AD. .
Although the pathways found in the two processes are similar, some differences have also been observed. We analyzed difference in the role of the same pathway between two prediction procedures by a normalization defined as , where is the new coefficient of i th element, and P is number of weight vector. The re-scaled coefficients show an ‘important score’ of each gene in each prediction procedure. We averaged the coefficients for genes in each pathway of interest as a score for comparison.
From Table 3, the scores of gap junction and calcium signaling are higher in neuronal number (cell death) prediction compared to neurite length prediction; and for MAPK pathway, the two scores are similar. These data suggest that MAPK may equally contribute to both neurite loss and neuronal death while changes in calcium homeostasis and gap junctions may primarily contribute to neuronal death.
Table.3.
Scores of different pathways in two predictions
| Calcium signaling | Gap junction | MAPK | |
|---|---|---|---|
| Nuclei # | 0.253 | 0.282 | 0.181 |
| Neurite length | 0.331 | 0.375 | 0.207 |
IV. Discussions and Conclusions
The proposed image based system biology method has the potential to provide insight into the connection between image phenotypes of diseased neurons and underlying cellular pathways. We applied the concept of the consensus pathways in mice and humanas many of these pathways are conserved across species. This approach might also be useful for revealing relationship or link between phenotype and genotype in other diseases. In addition, since the approach can be used to seek detailed performance difference of one pathway or module defining different image features, it may also be considered as a referential method to investigate what kind of role that some genetic functions have when they are defining different phenotypes.
Acknowledge
This work is partially funded by NIH R01AG028928. XZ is also partially funded by a TMHRI Scholarship award and a TMH-Cornell-UH IBIS grant. The authors would like to thank members of The Methodist Center for Biotechnology and Informatics for helpful discussion.
Reference
- 1.Hardy J, Selkoe DJ. The amyloid hypothesis of Alzheimer's disease: progress and problems on the road to therapeutics. Science. 2002;297:353–356. doi: 10.1126/science.1072994. [DOI] [PubMed] [Google Scholar]
- 2.Zhang Y, Zhou X, Degterev A, et al. Automated neurite extraction using dynamic programming for high-throughput screening of neuron-based assays. NeuroImage. 2007;35:1502–1515. doi: 10.1016/j.neuroimage.2007.01.014. [DOI] [PMC free article] [PubMed] [Google Scholar]
- 3.Hause L, Ho K, Dellis J. Microscopic image analysis in a diagnostic system for Alzheimer's disease. Engineering in medicine and biology society. 1989;2:345–346. [Google Scholar]
- 4.Xiong G, Zhou X, Degterev A, et al. Automated neurite labeling and analysis in fluorescence microscopy images. Cytometry Part A. 2006;69:494–505. doi: 10.1002/cyto.a.20296. [DOI] [PubMed] [Google Scholar]
- 5.Xu X, Chen X, Liu K, et al. A computer-based system to analyze neuron images. ISCAS. 2005;5:4225–4228. [Google Scholar]
- 6.Loring J, Wen X, Lee J, et al. A gene expression profile of Alzheimer's disease. DNA Cell Biol. 2001;20:683–695. doi: 10.1089/10445490152717541. [DOI] [PubMed] [Google Scholar]
- 7.Miller J, Oldham M, Geschwind D, et al. A system level analysis of transcriptional changes in Alzheimer's disease and normal aging. Journal of neuroscience. 2008;28:1410–1420. doi: 10.1523/JNEUROSCI.4098-07.2008. [DOI] [PMC free article] [PubMed] [Google Scholar]
- 8.Blalock E, Geddes J, Chen K, et al. Incipient Alzheimer's disease: microarray correlation analyses reveal major transcriptional and tumor suppressor responses. PNAS. 2004;101:2173–2178. doi: 10.1073/pnas.0308512100. [DOI] [PMC free article] [PubMed] [Google Scholar]
- 9.Ricciarelli R, d'Abramo C, Massone S, Marinari U, Pronzato M, et al. Microarray analysis in Alzheimer's disease and normal aging. IUBMB Life. 2004;56:349–354. doi: 10.1080/15216540412331286002. [DOI] [PubMed] [Google Scholar]
- 10.Zou H, Trevor H. Regularization and variable selection via the elastic net. J.R.Statist.Soc.B. 2005;67:301–320. [Google Scholar]
- 11.Smith M, Zhu X, Perry G. Signal Transduction in Alzheimer Disease. Neurosignals. 2002;11:236–250. [Google Scholar]
- 12.Bojarski L, Herms J, Kuznicki J. Calcium dysregulation in Alzheimer's disease. Neurochem. Int. 2008;52:621–633. doi: 10.1016/j.neuint.2007.10.002. [DOI] [PubMed] [Google Scholar]


