

Abstract
S-adenosylmethionine (SAMe), the major methyl donor for DNA and histone methylation was fed with ethanol for one month in order to modify the effects of ethanol on rat liver. The following parameters were studied to determine the effects of SAMe; liver histology, the blood alcohol cycle (BAL), changes in gene expression mined from microarray analysis, changes in histone methylation, changes in liver SAMe levels and its metabolites and ADH. SAMe changed the type of fatty liver, reduced liver ALT levels and prevented the BAL cycle caused by intragastric ethanol feeding. Microarray analysis showed that SAMe feeding prevented most of the changes in gene expression induced by ethanol feeding, presumably by inducing H3K27me3 and gene silencing. H3K27me3 was significantly increased by SAMe with or without ethanol feeding. It is concluded that SAMe feeding stabilized global gene expression so that the changes in gene expression involved in the blood alcohol cycle were prevented.
Keywords: methyl donor, histone methylation, alcoholic steatosis, H3K27me3, adrenergic response, cytokine-cytokine interaction
INTRODUCTION
The pathogenesis of the blood alcohol level (BAL) in rats fed ethanol continuously at a constant rate (Tsukamoto et al., 1985) has been shown to involve cyclic changes in the metabolic rate influenced by fluctuations in body temperature, NADH/NAD ratio, mitochondrial electron transport/ATP synthesis, circulating levels of catecholamines and the hypothalamic thyroid axis (French 2005a; Li et al., 2005). What remains to be determined is the role that nutrition plays in the cycle pathogenesis. To determine the role of nutrition, the methyl donor S-adenosylmethionine (SAMe) was fed with ethanol based on the role of epigenetic changes that occur during chronic ethanol feeding. Gene expression changes and epigenetic changes such as methylation and acetylation differed at the peaks and troughs of the cycle (French, 2005b; Bardag-Gorce et al., 2007; Oliva et al., 2009a; Shukla et al., 2008; Li et al., 2009). SAMe feeding during acute ethanol binging altered the expression of gene expression changes dramatically when the animals were sacrificed at high and low blood alcohol levels (Bardag-Gorce et al., 2009). Feeding SAMe markedly inhibited the changes in gene expression induced when ethanol levels were high, 3 h after rats received a bolus of ethanol (Li et al., 2009). It is postulated here that SAMe feeding will prevent the BAL cycle by methylating histones. This would silence the expression of the genes which drive the cycle and the pathologic injury.
MATERIALS AND METHODS
Animal model of alcoholic liver disease
Male Wistar rats weighing between 250 and 300 g from Harleco (Hollister, CA) were pair-fed a liquid diet containing ethanol (13 g/kg/day) intragastrically at a constant rate 24 h/day for 1 month (3 rats) as described previously (Li et al., 2000). Pair-fed controls were fed dextrose isocaloric to ethanol (4 rats). A third group of rats (3 rats) were pair-fed the ethanol diet with 1 g/kg body weight of S-adenosylmethionine (SAMe) added to the diet (Nature Made Nutritional Products, Mission Hills, CA). A fourth group of rats (3 rats) were pair-fed the control diet with 1 g/kg of SAMe added. The urinary ethanol levels were monitored daily on the last 14 days of the month of feeding, to determine the urinary/blood alcohol cycle in the rats fed ethanol (Li et al., 2000) as determined by measuring the daily 24 h urine ethanol. This was done by collecting the urine under toluene using metabolic cages, one rat per cage and measuring the urine alcohol level using a kit (QED Saliva alcohol test kit A 150 (STC Technologies, Bethlehem, PA). Blood alcohol and alanine aminotransferase (ALT) were measured by a clinical analyzer. The rats were maintained according to the guidelines of Animal Care as described by the National Academy of Sciences and published by the National Institutes of Health (1996).
Microarray Analysis
Quick frozen liver tissue stored at −80°C was subjected to microarray analysis. The details of the methodology and statistical analysis have been previously described (French et al., 2005b).
Liver Histology
A portion of the rat liver was fixed in 10% zinc formalin for 4 h, and then kept in 80% ethanol until embedded in paraffin. Sections 4μ thick were cut and stained with hemotoxylin and eosin. The sections were then used to quantitate % fat morphologically using Nikon morphometric software (fat pixels/total pixels).
HPLC
Liver SAMe, SAH and MTA levels were measured as previously published (Huang et al., 1998; Huang et al., 1999) with slight modifications. Liver specimens were homogenized in 0.5 M perchloric acid and centrifuged at 1000 g (Beckman GPR centrifuge) for 15 min. Further details of the method used have been published (Oliva et al., 2000b).
Western Blot
Equal amounts of liver proteins determined by the Bradford Method (Bradford, 1976) were used. Aliquots (50 μg) from liquid nitrogen frozen stored livers were separated by SDS-PAGE gels and transferred to a PVDF membrane (Bio-Rad, Hercules, CA) for 1 h in 25 mM Tris-HC1 (pH 8.3), 192 mM glycine and 20% methanol. The membranes were stained using primary antibodies to H3K4me2 (Abcam Inc. Cambridge, MA), H3K27me3 (Carlsbad, CA) and ADH (Santa Cruz Biotechnology Inc., Santa Cruz, CA). Appropriate species polyclonal and monoclonal HRP conjugated antibodies were used as secondary antibodies. The membranes were subjected to chemiluminesence detection using luminal, according to the manufacturer’s instructions (Amersham Pharmacia Biotech, Piscataway, NJ).
Statistical Analysis
Tissues from 3 to 4 rats/group were compared. P values were determined by ANOVA and Student-Newman-Keuls for multiple group comparisons (Sigma-Stat software, San Francisco, CA).
RESULTS
The terminal urinary and blood alcohol levels of the two ethanol-fed groups were not significantly different (Table I).
Table 1.
UAL, BAL, BW and LW were determined for ethanol and SAMe fed rats
| Treatment | Animals | UAL mg% | BAL mg% | BW (g) | LW (g) | BW/LW | ALT |
|---|---|---|---|---|---|---|---|
| Dextrose | 4 | 0 | 352.6 ± 2.02 | 3.93 ± 0.03 (1) | 89.66 ± 0.441 (5) | 34 ± 3.2 (9) | |
| Ethanol | 3 | 386.6 ± 84 | 454.3 ± 148 | 351.6 ± 3.28 | 6.86 ± 0.06 (2) | 51.3 ± 167 (6) | 58.3 ± 6.1 (10) |
| Dextrose + SAMe | 3 | 0 | 352.3 ± 2.6 | 3.83 ± 0.03 (3) | 91.87 ± 0.37 (7) | 34.3 ± 2.03 (11) | |
| Ethanol + SAMe | 3 | 153.3 ± 35 | 315.2 ± 20 | 350.6 ± 2.6 | 5.1 ± 0.06 (4) | 68.7 ± 0.291 (8) | 45.67 ± 1.67 (12) |
LW (Liver weight ): 1 vs 2 p<0.001; 1 vs3 p<0.001; 2 vs4 p<0.001; 3 vs 4 p<0.001; 1 vs 4 p<0.001
BW/LW (body weight/Liver weight): 7 vs 6 p<0.001; 7 vs 8 p<0.001; 7 vs 5 p<0.002; 5 vs 6 p<0.001; 5 vs 8 p<0.001; 6 vs 8 p<0.001
ALT( Alanine aminotransferase): 9 vs 10 p<0.004; 10 vs 11 p<0.004; 10 vs 12 p<0.04
The body weights of the four groups were also not different. The liver weights were significantly different. The weights of the livers from the rats fed ethanol were the highest, followed by the rats fed ethanol and SAMe. The livers of the rats fed SAMe with ethanol weighed less than the group fed ethanol alone, but were significantly higher than the rats fed dextrose plus SAMe or dextrose alone. The same pattern of differences was seen when the liver wt/body wt ratio was calculated (Table 1). The ALT levels were highest in the ethanol fed group. The ALT levels of the ethanol plus SAMe fed group was significantly lower than the ethanol fed alone group and significantly higher than the two dextrose fed groups (Table 1).
The liver histology of the ethanol fed rats showed macrovesicular fatty change, whereas, the rats fed ethanol and SAMe showed only microvesicular fat (Fig 1A). The two groups fed dextrose showed no fatty change. Morphometric quantitation of the liver fatty change showed that both ethanol fed groups had significantly increased by fat but the ethanol plus SAMe had significantly less fat compared to the ethanol fed only group (Figure 1B).
Figure 1.
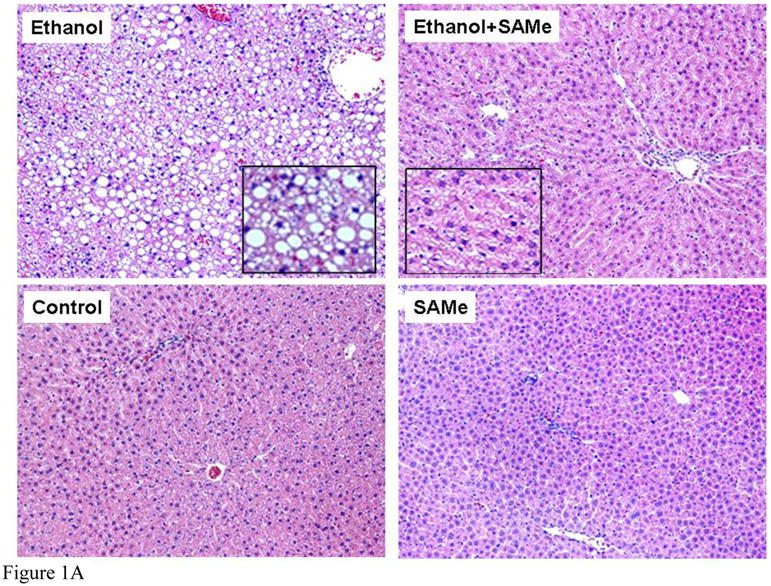

Figure 1A. Liver sections were stained with hematoxylin and eosin. Hepatocytes from rats fed ethanol only showed macrovesicular steatosis (x130). Hepatocytes from rats fed ethanol plus SAMe showed microvesicular steatosis (x130). Magnification of inserts was x 260. Hepatocytes from rats fed dextrose showed normal liver without steatosis (x130). Hepatocytes from rats fed SAMe alone, showed normal liver without steatosis (x130)
Figure 1B. Morphometric quantitation of liver fat. Ethanol fed alone caused a marked increase in fat, significantly greater than the 3 other groups of rats (Mean±SEM n=3 p<0.05). Ethanol fed with SAMe caused less steatosis but significantly more than the two controls (Mean±SEM, n=3, p<0.05).
The urinary ethanol cycle (UAL) was documented by daily 24 h urine alcohol measurements made in the rats fed ethanol alone (Fig 2A). Note, all10 3 rats fed ethanol cycled every 6 days. However, when SAMe was fed with ethanol all 3 rats maintained UALs between 120–220 mg% over the 14 day period when UALs were determined (Fig 2B).
Figure 2.

A. Graph showing that ethanol feeding caused a cyclic increase, and decrease, in the UAL 6 day cycle over a 6–7 day period.(n=3). B. Graph showing the absence of the UAL cycle in the group of rats (n=3) fed both ethanol plus SAMe.
When SAMe levels were measured by HPLC, ethanol feeding alone or SAMe plus ethanol significantly lowered liver levels (Fig 3A). SAMe levels did not differ when the ethanol alone and ethanol plus SAMe fed groups were compared. However, when the SAH levels were compared, all three experimental groups showed a reduction compared to the group fed dextrose, above (Fig 3B). When the SAMe/SAH ratio was calculated, only the difference between the group fed ethanol alone and SAMe plus dextrose were significantly different (Fig 3C). When MTA was measured in livers of the 4 groups, all 3 treatments groups were significantly lower than the dextrose controls (Fig 3D).
Figure 3.

A. SAMe levels were lower in the livers of rats fed ethanol and rats fed ethanol plus SAMe (Mean±SEM, n=3). B. SAH levels in the liver were lower in the 3 experimental groups of rats compared to the dextrose controls (Mean±SEM, n=3). C. SAM/SAH ratios of the four groups of rats show that ethanol alone caused a decrease in the ratio when compared to rats fed Dextrose plus SAMe (Mean±SEM, n=3).
D. MTA levels were reduced in the livers of the 3 rat treatment groups, compared to the control rats fed dextrose.
Microarray Analysis
When the ethanol fed group (3 rats) was compared with the dextrose controls (3 rats) the expression of 1300 genes was found changed. Fig 4 shows the KEGG functional pathways affected.
Fig 4.

KEGG functional pathways changed by ethanol feeding compared with the dextrose controls (n=3). Important functional pathways affected include adipocytokine, cytokine-cytokine receptor interaction, MAPK, cytochrome P450s, PPAR, TGFβ, and Toll-like receptor signaling pathways.
3 major pathways were especially up regulated, i.e., cytokine-cytokine receptor interaction, MAPK signaling and PPAR signaling pathways. When the SAMe plus ethanol group (3 rats) was compared to the dextrose controls (3 rats) the expressions of the up regulated genes were mostly decreased in number especially the cytokine-cytokine, MAP signaling and PPAR signaling pathways (Fig 5).
Fig 5.

KECG functional pathways changed by feeding ethanol plus SAMe compared with the dextrose controls (n =3). Note that many pathway changes have been reduced by SAMe treatment.
More detailed analysis of the changes in gene expression by ethanol alone when compared to the group fed SAMe plus ethanol was studied (Tables 2–6). Table 2 lists selected changes in gene expression by ethanol alone compared with the group fed SAMe plus ethanol (3 rats/group). Table 3 lists selected gene expressions involved in the cytokine-cytokine pathway, which were changed by ethanol alone but were prevented when SAMe was fed with ethanol. Table 4 lists selected gene expressions involved in the adrenergic response, which were prevented by SAMe feeding. Table 5 lists selected gene expressions involved in alcohol metabolism, which were normalized by SAMe feeding. Table 6 lists miscellaneous selected gene expression changes induced by ethanol alone, which were prevented by SAMe feeding.
Table 2.
Gene expression changes induced by ethanol but not prevented by SAMe: (EtOH vs Dex and EtOH + SAMe vs Dex)
| EtOH vs Dex | EtOH+SAMe vs Dex | ||||
|---|---|---|---|---|---|
| Gene title | Gene symbol | Ratio | ± Std Dev | Ratio | ± Std Dev |
| alpha-2-macroglobulin | A2m | 25.57 | 1.42 | 9.45 | 2.74 |
| glutathione S-transferase Yc2 subunit | Yc2 | 4.71 | 0.16 | 9.25 | 2.65 |
| fibroblast growth factor 21 | Fgf21 | 3.87 | 0.54 | 3.27 | 1.87 |
| leptin receptor | Lepr | 2.38 | 0.51 | 2.28 | 1.48 |
| Procollagen, type XXVII, alpha 1 | Col27a1 | −1.81 | 0.34 | −2.27 | 1.42 |
| cyclin D1 | Ccnd1 | −2.27 | 0.36 | −2.58 | 1.78 |
| mitogen-activated protein kinase kinase 6 | Map2k6 | −3.23 | 0.54 | −3.25 | 2.62 |
| adenosine A2B receptor | Adora2b | −5.99 | 0.65 | −3.46 | 2.19 |
| lysyl oxidase | Lox | −6.28 | 1.14 | −7.36 | 2.65 |
| Neuronal regeneration related protein | Nrep | −10.12 | 1.31 | −16 | 2.95 |
Table 6.
Additional gene expression changes induced by ethanol and prevented by SAMe:
| EtOH vs Dex | |||
|---|---|---|---|
| Gene title | Gene symbol | Ratio | ± Std Dev |
| insulin-like growth factor binding protein 2 | Igfbp2 | 4.03 | 0.95 |
| fatty acid binding protein 2, intestinal | Fabp2 | 2.12 | 0.22 |
| growth arrest and DNA-damage-inducible 45 beta | Gadd45b | 1.75 | 0.16 |
| phospholipase A2, group IVA (cytosolic, calcium-dependent) | Pla2g4a | 1.74 | 0.29 |
| heme oxygenase (decycling) 1 | Hmox1 | 1.70 | 0.35 |
| peroxisome proliferator activated receptor alpha | Ppara | 1.60 | 0.07 |
| homocysteine-inducible, endoplasmic reticulum stress-inducible, ubiquitin-like domain member 1 | Herpud1 | 1.54 | 0.17 |
| programmed cell death 4 | Pdcd4 | 1.51 | 0.28 |
| Janus kinase 3 | Jak3 | 1.44 | 0.21 |
| apolipoprotein A-I | Apoa1 | 1.44 | 0.14 |
| proteasome (prosome, macropain) subunit, beta type 10 | Psmb10 | 1.43 | 0.18 |
| procollagen, type IV, alpha 1 | Col4a1 | 1.41 | 0.06 |
| Kruppel-like factor 9 | Klf9 | 1.37 | 0.16 |
| Hepatocyte growth factor | Hgf | 1.35 | 0.14 |
| Janus kinase 2 | Jak2 | 1.32 | 0.12 |
| protein kinase C, beta 1 | Prkcb1 | 1.31 | 0.10 |
| coagulation factor X | F10 | 1.30 | 0.09 |
| insulin-like growth factor 1 receptor | Igf1r | 1.29 | 0.11 |
| protein kinase C binding protein 1 | Prkcbp1 | 1.27 | 0.10 |
| Src homology 2 domain-containing transforming protein C1 | Shc1 | 1.27 | 0.15 |
| retinoid X receptor alpha | Rxra | 1.25 | 0.14 |
| caspase 7 | Casp7 | 1.24 | 0.12 |
| G protein-coupled receptor kinase-interactor 2 | Git2 | 1.23 | 0.07 |
| Mitogen-activated protein kinase 4 | Mapk4 | 1.23 | 0.07 |
| Kruppel-like factor 3 (basic) (mapped) | Klf3 | 1.23 | 0.05 |
| caspase 6 | Casp6 | 1.19 | 0.08 |
| proteasome (prosome, macropain) 26S subunit, non-ATPase, 4 | Psmd4 | 1.18 | 0.09 |
| procollagen, type XXIII, alpha 1 | Col23a1 | 1.17 | 0.08 |
| mitogen-activated protein kinase 7 | Mapk7 | 1.14 | 0.05 |
| proteasome (prosome, macropain) 26S subunit, non-ATPase, 3 | Psmd3 | 1.14 | 0.06 |
| coagulation factor VIII | F8 | 1.12 | 0.04 |
| Complement component 3 | C3 | 1.12 | 0.04 |
| CREB regulated transcription coactivator 1 | Crtc1 | 1.12 | 0.05 |
| c-fos induced growth factor | Figf | −1.10 | 0.03 |
| glutathione peroxidase 1 | Gpx1 | −1.12 | 0.03 |
| Proteasome (prosome, macropain) 26S subunit, ATPase, 4 | Psmc4 | −1.12 | 0.05 |
| glutathione peroxidase 6 | Gpx6 | −1.13 | 0.04 |
| glutathione peroxidase 4 | Gpx4 | −1.14 | 0.05 |
| RNA (guanine-9-) methyltransferase domain containing 3 | Rg9mtd3 | −1.14 | 0.03 |
| protein arginine N-methyltransferase 4 | Prmt4 | −1.14 | 0.06 |
| histone deacetylase 5 | Hdac5 | −1.14 | 0.05 |
| mitogen activated protein kinase kinase kinase 12 | Map3k12 | −1.15 | 0.05 |
| mitogen-activated protein kinase 6 | Mapk6 | −1.15 | 0.07 |
| Histone deacetylase 7A | Hdac7a | −1.17 | 0.08 |
| glutathione S-transferase A3 | Gsta3 | −1.17 | 0.04 |
| pyridoxine 5′-phosphate oxidase | Pnpo | −1.22 | 0.11 |
| coagulation factor II (thrombin) receptor | F2r | −1.22 | 0.07 |
| Kruppel-like factor 3 (basic) | Klf3 | −1.24 | 0.10 |
| pyruvate dehydrogenase E1 alpha 1 /// pyruvate dehydrogenase E1 alpha 1 pseudogene | Pdha1 | −1.24 | 0.08 |
| epithelial membrane protein 2 | Emp2 | −1.24 | 0.10 |
| guanidinoacetate methyltransferase | Gamt | −1.25 | 0.10 |
| glypican 2 (cerebroglycan) | Gpc2 | −1.26 | 0.08 |
| glutathione-S-transferase, pi 1 /// glutathione S-transferase, pi 2 | Gstp1 | −1.26 | 0.14 |
| Protein kinase C, epsilon | Prkce | −1.28 | 0.09 |
| Thyroid hormone receptor alpha | Thra | −1.30 | 0.15 |
| leucine carboxyl methyltransferase 1 | Lcmt1 | −1.31 | 0.09 |
| phosphatidylinositol 3-kinase, regulatory subunit, polypeptide 1 | Pik3r1 | −1.31 | 0.13 |
| proteaseome (prosome, macropain) 28 subunit, 3 | Psme3 | −1.34 | 0.12 |
| insulin-like growth factor 2, binding protein 3 | Igf2bp3 | −1.36 | 0.11 |
| hypoxia induced gene 1 | Hig1 | −1.36 | 0.13 |
| cystathionine beta synthase | Cbs | −1.40 | 0.17 |
| protein kinase C, iota | Prkci | −1.42 | 0.11 |
| keratin complex 2, basic, gene 8 | Krt2-8 | −1.48 | 0.17 |
| insulin-like growth factor 2, binding protein 3 | Igf2bp3 | −1.57 | 0.10 |
| glutathione S-transferase, mu 2 | Gstm2 | −1.57 | 0.25 |
| platelet derived growth factor, alpha | Pdgfa | −1.79 | 0.23 |
| methyltransferase like 7B | Mettl7b | −2.26 | 0.18 |
| aldo-keto reductase family 1, member C18 | Akr1c18 | −3.91 | 0.85 |
| Proteasome (prosome, macropain) 26S subunit, ATPase, 4 | Psmc4 | −1.12 | 0.05 |
Table 3.
Gene expression changes induced by ethanol and prevented by SAMe: Cytokine-cytokine interaction
| EtOH vs Dex | |||
|---|---|---|---|
| Gene title | Gene symbol | Ratio | ± Std Dev |
| interleukin 1 receptor, type II | Il1r2 | 2.10 | 0.45 |
| Tumor necrosis factor receptor superfamily, member 6 | Tnfrsf6 | 1.96 | 0.34 |
| interleukin 1 receptor, type I | Il1r1 | 1.91 | 0.35 |
| chemokine (C-X-C motif) ligand 4 | Cxcl4 | 1.78 | 0.36 |
| Chemokine (C-C motif) ligand 6 | Ccl6 | 1.71 | 0.27 |
| toll-like receptor 4 | Tlr4 | 1.47 | 0.25 |
| chemokine (C-X-C motif) ligand 12 | Cxcl12 | 1.44 | 0.11 |
| chemokine (C-C motif) ligand 4 | Ccl4 | 1.43 | 0.24 |
| chemokine (C-X-C motif) ligand 12 | Cxcl12 | 1.34 | 0.10 |
| toll-like receptor 2 | Tlr2 | 1.32 | 0.18 |
| transforming growth factor, beta receptor III | Tgfbr3 | 1.16 | 0.07 |
| tumor necrosis factor (TNF superfamily, member 2) | Tnf | 1.11 | 0.03 |
| chemokine (C-X-C motif) ligand 14 | Cxcl14 | −1.19 | 0.07 |
| transforming growth factor alpha | Tgfa | −1.24 | 0.12 |
| chemokine (C-X-C motif) ligand 9 | Cxcl9 | −1.63 | 0.32 |
| chemokine (C-X-C motif) ligand 14 | Cxcl14 | −1.68 | 0.33 |
Table 4.
Gene expression changes induced by ethanol and prevented by SAMe: Adrenergic sensitivity
| EtOH vs Dex | |||
|---|---|---|---|
| Gene title | Gene symbol | Ratio | ± Std Dev |
| adrenergic receptor, beta 2 | Adrb2 | 1.74 | 0.29 |
| Adrenergic receptor, beta 1 | Adrb1 | 1.38 | 0.19 |
| adenylate cyclase 4 | Adcy4 | 1.25 | 0.10 |
| NADH dehydrogenase (ubiquinone) 1 beta subcomplex, 4, 15kDa | Ndufb4 | −1.11 | 0.04 |
| adrenergic receptor kinase, beta 2 | Adrbk2 | −1.17 | 0.07 |
| cAMP responsive element modulator | Crem | −1.21 | 0.06 |
| cAMP responsive element modulator | Crem | −1.36 | 0.21 |
| adrenergic receptor, alpha 1b | Adra1b | −1.33 | 0.10 |
Table 5.
Gene expression changes induced by ethanol and prevented by SAMe: Alcohol Metabolism
| EtOH vs Dex | |||
|---|---|---|---|
| Gene title | Gene symbol | Ratio | ± Std Dev |
| aldehyde dehydrogenase family 1, member A1 | Aldh1a1 | 2.53 | 0.32 |
| aldehyde dehydrogenase family 3, member A1 | Aldh3a1 | 1.11 | 0.02 |
| aldehyde dehydrogenase family 9, subfamily A1 | Aldh9a1 | −1.26 | 0.08 |
| aldehyde dehydrogenase 1 family, member B1 | Aldh1b1 | −2.26 | 0.51 |
Because SAMe could prevent the UAL cycle by down regulating alcohol dehydrogenase expression and thus changing the rate of elimination of ethanol, liver ADH was measured in all 4 groups by Western blot (Fig 6). Ethanol alone increased the expression of ADH; however, SAMe fed with ethanol did not prevent this change.
Figure 6.

Western blots showed that ADH levels were significantly over expressed when rats were fed ethanol. Feeding SAMe did not prevent this ((Mean±SEM, n=3).
SAMe could affect the changes in the expression of genes caused by ethanol feeding by increasing methylation of histones such as H3K27me3. This methylation of histones silences the expression of many genes. Therefore Western blots were run. In fact H3K27me3 was increased by feeding SAMe to both the ethanol fed rats and their dextrose controls (Fig 7A). However H3K4me2, a histone associated with up regulation of gene expression was found to be unchanged by ethanol or SAMe. (Fig 7B).
Figure 7.

A. Western blots show that SAMe feeding increased the levels of H3K27me3 with or without ethanol. (Dex+SAMe vs Dex= p<0.01; SAMe+ETOH vs Dex= p<0.008; Dex+SAMe vs EtoH= p<0.05; SAMe EtoH vs ETOH= p<0.03, Mean±SEM, n=3. B. Western blots show that the levels of H3K4me3 were unchanged by feeding ethanol and/or SAMe.
Discussion
The mechanisms involved in the prevention of the BAL cycle by SAMe may be multiple. For instance, feeding SAMe inhibited the changes in components of the adrenergic response, which are involved in the pathogenesis of the cycle (French, 2000a; Li et al., 2009a) (Table 4), Adrb1 and b2 Adrcy4, and Crem. Blood levels of catecholamines swing up and down during the cycle (Li, 2004). Rotenone prevents the cycle (Li et al., 2004) by inhibiting NADH dehydrogenase in the mitochondria and in this way prevents the conversion of NADH to NAD+. (Table 4, Ndufb4). The NADH/NAD ratio changes radically during the cycle (Bardag-Gorce, et al., 2002).
The rate of ethanol metabolism changes during the cycle in response to the hypothalamus-pituitary-thyroid axis induced changes (Li et al., 2000). Here it was shown that ethanol feeding induced an increase in the levels of ADH but SAMe did not prevent this. However, SAMe prevented changes in ALDH expression, which were induced by feeding ethanol (Table 5). These included Aldh1a1, Aldh3a1, Aldh9a1 and Aldh1b1. Thyroid hormone, which regulates the metabolic rate also regulates the rate of ethanol metabolism (Li et al., 2001). SAMe feeding prevented the change in the expression of Thra (Table 4).
SAMe feeding could have prevented the BAL cycle caused by feeding ethanol by donating methyl groups to modify DNA and histones, to silence gene expression by epigenetic means. Feeding Ethanol has been shown to change methylation of histones and DNA (Li et al., 2009a; Pal-Bhaara et al., 2007; Shukla et al., 2008). In the present study it was shown that H3K27me3 was increased by SAMe with or without ethanol treatment, a change which is associated with gene silencing (Vira et al., 2006). This suggests that the way SAMe prevents the BAL cycle is by stabilizing global gene expression. These changes in gene expression that drive the cycle are silenced by SAMe-induced H3K27me3 methylation of DNA through G-EZH2 interaction (Vira et al., 2006). It has been reported that when the levels of s-adenosylhomocysteine (SAH) were increased, EZH2 degradation was induced and thus H3K27me3 was decreased (Hormaeche I and Licht JD. 2007). We hypothesize that when SAH levels were decreased by feeding ethanol and SAMe for one month, EZH2 became stabilized. H3k27me3 would then be increased by ethanol plus SAMe, as a result of the decrease in SAH.
Major functional pathways affected by ethanol feeding, which were prevented by feeding SAMe were the cytokine-cytokine interaction pathway and the Toll-like receptor pathway (Table 3). Included were 111r2, tnfrsf6, Cxcl4, Ccl6, Tlr4, Cxcl-12, Ccl4, Tlr2, Tgfbr3, Tnf, Cxc114, Tgfa and Cxc19. Toll-like receptor 4 is a key regulator of the natural immune response in alcoholic liver disease (Hritz et al., 2008). TLR4 responds to gram negative bacteria and TLR2 responds to gram positive bacteria (Testro and Visnamahan, 2009). TLRs 1, 2, 4, 6, 7, 8 and 9 are up regulated by chronic alcohol consumption (Gustot et al., 2006).
In the present study SAMe reduced the type of fatty liver caused by ethanol feeding from macrovesicular fat to microvesicular fat. This suggests that the fatty liver caused by ethanol plus SAMe had its origin in mitochondrial β oxidation where microvesicular fat is characteristic. However, others have found that SAMe treatment reduces ethanol-induced changes in mitochondrial function and the proteasome (Kelley et al., 2008; King et al., Sykora et al., 2009; Gong et al., 2008) and the severity of fatty liver (Gong et al., 2008).
Ethanol feeding decreased the levels of SAMe (Fig 3A) but feeding SAMe did not prevent this decrease in SAMe induced by ethanol, nor did it prevent the reduction of SAH induced by ethanol (Fig 3B). MTA was also reduced by ethanol feeding and this was not prevented by feeding SAMe (Fig 3D). There was a tendency, however, for SAMe feeding to prevent the decrease of the SAMe/SAH ratios caused by feeding ethanol (Fig 3C). SAMe is an intermediate metabolite in methionine catabolism and it also acts as a control switch that regulates essential hepatic functions such as regeneration, differentiation and the sensitivity of liver to injury (Mato et al., 2002).
SAMe treatment prevents the over expression of proinflammatory cytokines induced by ethanol or LPS endotoxemia (McClain et al., 2002; Ko et al., 2008). SAMe inhibits LPS induced gene expression by modulating histone methylation (Ara et al., 2008). SAMe also protects the liver from oxidative stress induced by CYP2E1 generation of free radicals in vitro (Wu and Cederbaum, 2006). SAMe feeding also reduces oxidative stress in vivo. It also attenuates stellate cell activation and fibrosis due to ethanol-LPS induced fibrosis model (Karaa et al, 2008). In the present study, SAMe feeding prevented the changes in the increased in expression of procollagen type IV Alpha 1 induced by ethanol (Table 4), which is involved in capillarization of the liver sinusoids in alcoholic liver disease (Tsutsumi et al., 1983).
Acknowledgments
The authors thank Adriana Flores for typing the paper. This study was supported by from the NIH/NIAAA grant 8116 and Alcohol Center Grant Morphology Core NIH/NIAAA PA50-11999.
Abbreviations
- BAL
blood alcohol levels
- SAMe
S-adenosylmethionie
- SAH
S-adenosyl homocysteine
- MTA
methylthioadenosine
Footnotes
Publisher's Disclaimer: This is a PDF file of an unedited manuscript that has been accepted for publication. As a service to our customers we are providing this early version of the manuscript. The manuscript will undergo copyediting, typesetting, and review of the resulting proof before it is published in its final citable form. Please note that during the production process errors may be discovered which could affect the content, and all legal disclaimers that apply to the journal pertain.
References
- Ara AI, et al. S-Adenosylmethionineinhibits lipopolysaccharide-induced gene expression via modulation of histone methylation. Hepatology. 2008;47:1655–1666. doi: 10.1002/hep.22231. [DOI] [PMC free article] [PubMed] [Google Scholar]
- Bardag-Gorce F, et al. The importance of cycling of blood alcohol levels in the pathogenesis of experimental alcoholic liver disease in rats. Gastroenterology. 2002;123:325–335. doi: 10.1053/gast.2002.34177. [DOI] [PubMed] [Google Scholar]
- Bardag-Gorce F, et al. Histone acetyltransferase p300 modulates in an epigenetic manner at high blood alcohol levels. Exp Mol Pathol. 2007;82:197–202. doi: 10.1016/j.yexmp.2006.10.006. [DOI] [PMC free article] [PubMed] [Google Scholar]
- Bardag-Gorce F, et al. Chronic ethanol feeding alters hepatocyte memory which is not altered by acute feeding. Alcohol Clin Exp Res. 2009;33:684–692. doi: 10.1111/j.1530-0277.2008.00885.x. [DOI] [PMC free article] [PubMed] [Google Scholar]
- Bradford MM. A rapid and sensitive method for the quantification of microgram quantities of protein utilizing the principle of protein-dye binding. Anal Biochem. 1976;72:248–254. doi: 10.1016/0003-2697(76)90527-3. [DOI] [PubMed] [Google Scholar]
- French SW. The pathogenesis and significance of the urinary alcoholic cycle in rats fed ethanol intragastrically. Alcohol Clin Exp Res. 2005a;29 (11 Suppl):1585–1615. [PubMed] [Google Scholar]
- French BA, et al. Microarray analysis of gene expression of the liver during urinary ethanol cycle in rats fed ethanol intragastrically at a constant rate. Exp Mol Pathol. 2005b;79:87–94. doi: 10.1016/j.yexmp.2005.06.006. [DOI] [PubMed] [Google Scholar]
- Gong Z, et al. Effects of S-adenosylmethionine on liver methionine metabolism and steatosis with ethanol-induced liver injury in rats. Hepatol Inst. 2008;2:346–352. doi: 10.1007/s12072-008-9082-1. [DOI] [PMC free article] [PubMed] [Google Scholar]
- Gustot T, et al. Differential liver sensitization to Toll-like receptor pathways in mice with cirrhotic fatty liver. Hepatology. 2006;43:989–1000. doi: 10.1002/hep.21138. [DOI] [PubMed] [Google Scholar]
- Hormaeche I, Licht JD. Chromatin modulation by oncogenic transcription factors: new complexity, new therapeutic targets. Cancer Cell. 2007 Jun;11(6):475–8. doi: 10.1016/j.ccr.2007.05.005. [DOI] [PubMed] [Google Scholar]
- Hritz I, et al. The critical role of Toll-like receptor (TLR)4 in alcoholic liver disease is independent of the common TLR ad adapter MyD88. Hepatology. 2008;48:1224–1231. doi: 10.1002/hep.22470. [DOI] [PMC free article] [PubMed] [Google Scholar]
- Huang ZZ, et al. Changes in methionine adenosyltransferase during liver regeneration in the rat. Am J Physiol. 1998;225:C14–21. doi: 10.1152/ajpgi.1998.275.1.G14. [DOI] [PubMed] [Google Scholar]
- Huang ZZ, et al. Differential effect of thioacemide on hepatic methionine adenosyltransferase expression in the rat. Hepatology. 1999;29:1471–1478. doi: 10.1002/hep.510290525. [DOI] [PubMed] [Google Scholar]
- Karaa A, et al. S-Adenosyl-L-methionine attenuates oxidative stress and hepatic stellate cell activation in an ethanol-LPS-induced fibrotic rat model. Shock. 2008;30:197–205. doi: 10.1097/shk.0b013e318160f417. [DOI] [PubMed] [Google Scholar]
- Kelley K, et al. Modification to the liver mitochondrial proteasome by chronic alcohol consumption and S-adenosylmethionine. Hepatol. 2008;48(Suppl):462A. [Google Scholar]
- King A, et al. S-adenosylmethionine attenuates chronic alcohol-induced mitochondrial dysfunction and hypoxia in liver. Hepatology. 2008;48:Suppl, 635A. [Google Scholar]
- Ko K, et al. Changes in S-adenosyl-methionine and GSH homeostasis during endotoxemia in mice. Lab Invest. 2008;88:1121–1129. doi: 10.1038/labinvest.2008.69. [DOI] [PMC free article] [PubMed] [Google Scholar]
- Li J, et al. Mechanism of the alcohol cycle pattern: role of the hypothalamic-pituitary-thyroid axis. Am J Physiol Gastrointest Liver Physiol. 2000;279:G118–125. doi: 10.1152/ajpgi.2000.279.1.G118. [DOI] [PubMed] [Google Scholar]
- Li J, et al. Thyroid hormone causes liver necrosis in rats fed ethanol intragastrically. Exp Mol Pathol. 2001;76:79–88. doi: 10.1006/exmp.2001.2381. [DOI] [PubMed] [Google Scholar]
- Li J. Catecholamines are involved in the mechanism of the urinary alcohol level cycle in rats fed ethanol intragastrically at a constant rate. Life Sci. 2004;75:3043–3051. doi: 10.1016/j.lfs.2004.05.032. [DOI] [PubMed] [Google Scholar]
- Li J, et al. Uncoupling of oxidative phosphorylation prevents the urinary alcohol level cycling caused b feeding ethanol continuously at a constant rate. Exp Mol Pathol. 2005;78:228–232. doi: 10.1016/j.yexmp.2004.12.001. [DOI] [PubMed] [Google Scholar]
- Li J, et al. The effect of propranolol on gene expression during blood alcohol cycle of rats fed ethanol intragastrically. Exp Mol Pathol. 2009a doi: 10.1016/j.yexmp.2009.11.003. (Epub ahead of print) [DOI] [PMC free article] [PubMed] [Google Scholar]
- Li J, et al. Gene expression modification in the liver caused by binge and S-adenosylmethionine feeding. The role of epigenetic changes. Gene and Nutr. 2009b doi: 10.1007/s12263-009-0158-x. (Epub ahead of print) [DOI] [PMC free article] [PubMed] [Google Scholar]
- Li J, et al. The effect of rotenone on the urinary ethanol cycle in rats fed ethanol intragastrically. Exp Mol Path. 2004;77:210–213. doi: 10.1016/j.yexmp.2004.08.005. [DOI] [PubMed] [Google Scholar]
- Mato JM, et al. S-adenosylmethionine: a control switch that regulates liver function. FASEB J. 2002;16:15–26. doi: 10.1096/fj.01-0401rev. [DOI] [PubMed] [Google Scholar]
- McClain CJ, et al. S-adenosylmethionine cytokines and alcohol liver disease. Alcohol. 2002;27:185–192. doi: 10.1016/s0741-8329(02)00224-0. [DOI] [PubMed] [Google Scholar]
- Oliva J, et al. Epigenetics of proteasome inhibition in the liver of rats fed ethanol chronically. World J Gastroenterology. 2009a;15:705–712. doi: 10.3748/wjg.15.705. [DOI] [PMC free article] [PubMed] [Google Scholar]
- Oliva J, et al. Betaine prevents Mallory-Denk body formation in drug-primed mice by epigenetic mechanisms. Exp Mol Pathol. 2009b;86:77–86. doi: 10.1016/j.yexmp.2008.11.002. [DOI] [PMC free article] [PubMed] [Google Scholar]
- Pal-Bhaara M, et al. Ethanol and chromatin remodeling histone H3, methylation of lys 4 and lys 9 correlates with up and down regulation of genes in rat hepatocytes. Life Sci. 2007;81:979–987. doi: 10.1016/j.lfs.2007.07.030. [DOI] [PMC free article] [PubMed] [Google Scholar]
- Shukla SD, et al. Emerging role of epigenetics in the actions of alcohol. Alcohol Clin Exp Res. 2008;32:1525–1534. doi: 10.1111/j.1530-0277.2008.00729.x. [DOI] [PubMed] [Google Scholar]
- Sykora P, et al. S-adenosyl-methionine co-administration prevents the ethanol-elicited dissociation of hepatic mitochondrial ribosomes in male rats. Alcohol Clin Exp Res. 2009;33:1–9. doi: 10.1111/j.1530-0277.2008.00803.x. [DOI] [PMC free article] [PubMed] [Google Scholar]
- Testro AG, Visvanahan K. Toll-like receptors and their role in gastrointestinal disease. J Gastroenterol Hepatol. 2009;24:943–954. doi: 10.1111/j.1440-1746.2009.05854.x. [DOI] [PubMed] [Google Scholar]
- Tsukamoto H. Cyclic pattern of blood alcohol levels during continuous intragastric ethanol infusion in rats. Alcohol Clin Exp Res. 1985;9:31–37. doi: 10.1111/j.1530-0277.1985.tb05046.x. [DOI] [PubMed] [Google Scholar]
- Tsutsumi M, et al. Changes in type IV collagen content in livers of patients with alcoholic liver disease. Hepatology. 1983;17:820–827. [PubMed] [Google Scholar]
- Vire E, et al. The polycomb group protein EZH2 directly controls DNA methylation. Nature. 2006;439:871–874. doi: 10.1038/nature04431. [DOI] [PubMed] [Google Scholar]
- Wu D, Cederbaum AI. Opposite action of S-adenosyl methionine and its metabolites on CYP2E1-mediated toxicity in pyrazole-induced rat hepatocytes and HepG2 E1476 cells. Am J Physiol Gastrointest Liver Phys. 2006;29s:674–684. doi: 10.1152/ajpgi.00406.2005. [DOI] [PubMed] [Google Scholar]