

Abstract
In this paper, an objective assessment for determining whether a person has Parkinson disease is proposed. This is achieved by analyzing the correlation between joint movements, since Parkinsonian patients often have trouble coordinating different joints in a movement. Thus, the auto-correlation coefficient of single joint movements and the cross-correlation between movements in a pair of joints (hand, wrist, elbow and shoulder) were studied. These features were used to train and provide classification of subjects as having or not having Parkinson's disease using the Least Square Support Vector Machine. Experimental results showed that using either auto-correlation or cross-correlation features for classification provided over 91% correct classification. Using both features together provided better performance (96.0%) than using either feature alone. In addition, the performance of LS-SVM is better than that of Self Organizing Map (SOM) and k-nearest neighbor (KNN) in this case.
Index Terms: Medical diagnosis, Motion analysis, Signal classification
I. Introduction
Parkinson disease (PD), caused by death of the dopamine containing cells in the basal ganglia, is characterized in large part by motor deficits such as difficulties in initiating and executing movements. The cardinal signs of PD are resting tremor, bradykinesia (slowness and difficulty in carrying our voluntary movement), rigidity, and loss of postural reflexes. A clinical diagnosis of PD is made based on these cardinal signs, because there are no definitive diagnostic tests [1]. Our work has focused on elucidating the nature of the deficits in voluntary movement in PD through 3D motion analyses of subjects reaching for and grasping objects, making eye movements to spatial targets, and learning to move in novel virtual environments [1][2][3][4][5]. We have proposed that it is possible to differentiate two distinct types of Parkinsonian motor deficits: a simple loss of motor power or gain leading to bradykinesia and rigidity, and the loss of the more precise differentiated function of the basal ganglia facilitating the integration of different brain regions need for motor coordination [4]. Moreover, we have been finding that PD deficits in motor coordination can be quite resistant to treatment with dopamine replacement therapy [4][6]. In the present paper, we show that by using correlations among joint motions with machine learning algorithms, we can classify the movements of PD versus controls with very high accuracy.
PD monitoring can be categorized into two types, subjective assessments and objective assessments. Subjective assessment is mainly done by clinical evaluation involving simple tasks like turning of hands, sit-to-stand, finger-to-nose, etc. The evaluation is based on Unified Parkinson's Disease Rating Scale (UPDRS) which shows relationship between performance of motor tasks and PD rating scale. The drawback with this approach is that the observation is subjective and may vary among physicians. It can also be costly and difficult to keep on observing long-term changes of patients. As a result, we focus on applying objective assessment to aid in identifying PD patients. In the following subsections, we will first introduce the data collection process under various existing approaches and then discuss how the data are analyzed.
A. Data Collection for Objective Assessment
Objective assessments are done by using different measurement tools to assess the performance of subjects on different tasks. There are three common types of tasks: tracking/drawing, gait and natural motions in daily life. The following subsections explain these task types in more details.
1) Tracking/Drawing
Tracking and drawing are popular assessment approaches studied by researchers. PD patients show difficulty in tracking moving objects in several ways, including slowness in initiating movement and tremor. In some experimental setups, tools are developed for the subject to move a cursor and trace a target signal. Hacisalihzade et. al. set up an experiment in which subjects tracked reference signals shown on the screen with their end phalanx of thumbs [7]. They found that the reaction time, movement time and error rate of PD patients' movements increased when the effect of anti-Parkinsonian drugs started to wear off. Allen et. al. showed that low-cost computer peripherals like a joystick and steering wheel can also be used as possible assessment equipment [8]. Their experimental results showed that both of these peripherals can help discriminate between PD patients and controls by analyzing bradykinesia. Contreras-Vidal and Gold setup an experiment in which subjects moved a stylus on a digitized tablet to reach to presented targets [9]. Compared with elderly and young people, PD patients showed prolonged movement times and increased endpoint errors. Tracking involves visual sense and movement. Jones et. al. examined whether visuoperceptual deficits are related to the poor complex sensory-motor task performance of PD patients [10]. Subjects were asked to control a cursor to a target with a wheel that moved the cursor horizontally. PD patients were impaired in both normal tracking task and in a tracking task that included a visuoperceptual buffer-zone which minimized the role of visuoperceptual function. The result showed that visuoperceptual deficits play only a minor part in causing poor performance of PD patients in tracking. PD patients also show abnormalities in drawing. Figure copying is a common task to evaluate drawing performance. Subjects copy a given figure and the copied figure is compared with original one. Smith and Shannon suggested an objective assessment in which subjects were required to draw a three-dimensional cube with a digitizing tablet [11]. The PD patients showed greater movement hesitations and demonstrated larger standard deviation in speed. In addition, the frequency components containing 60% of the total energy in their motions were within the range 4-6Hz. Vinter and Gras studied spatial features of angular drawing patterns in PD patients [12]. Drawing and tracking are easy to do and the equipment required is usually inexpensive. Nevertheless, these tasks are not suitable for developing objective tests as controls can also have difficulty in performing these tasks. Moreover, other diseases such as Dyslexia can also cause such symptoms.
2) Gait
Gait of PD patients is characterized by walking with little or no arm swing, short and shuffling steps, difficulty in initiating and reduced velocity. Different devices are designed to measure these kinds of symptoms. Kimmeskamp and Hennig concentrated on studying the heel to toe motion during walking [13]. Distribution of in-shoe pressure was recorded by pressure sensitive insoles. Sekine et. al. used wavelet-fractal analysis method to assess the signal from an accelerometer [14]. Using gyroscopes attached to the left and right forearms, thighs, and shanks, Salarian et. al. analyzed the gait of PD patients [15]. Rather than walking in steady-state, some researchers studied the impaired turning movement of PD patients during walking. Ferrarin et. al. suggested that in early stage of PD, patients do not show large deficits in steady-state walking, but they do demonstrate impaired turning [16]. Crenna et. al. and Carpinella et. al. assessed the turning movements of PD patients and controls through the use of an optical motion analysis system [17][18]. Gait has been shown to be promising in PD assessment. However, it also has a number of drawbacks. First of all, gait difficulties generally do not appear early in the course of the disease, so such assessment may not be useful early on. Second, some studies have restricted subjects to a predefined walkway which in itself might cause unnatural gait. Third, sensors stored in shoes may be intrusive and affect the patient's gait. Fourth, PD patients tend to shuffle during walking which can make it difficult to judge the start and stop times of the stride. Finally, PD patients and elderly people may have difficulty with balance during walking thus this task may be too dangerous.
3) Natural motions in daily life
To assess Parkinson Disease in a more natural way and longer term, researchers have used ambulatory systems to observe daily activities of PD patients. Mounted accelerometers and gyroscopes with pocket PC's are commonly used tools. Moore et. al. designed a setup for observing stride [19]. The setup included an Inertial Measurement Unit that was mounted above the ankle for recording 3D linear acceleration and angular velocity, and also a pocket PC for post-processing. Ackmann et. al. used a transducer mounted at the wrist to measure the angular displacement caused by tremor [20]. Also aiming to measure tremor, Salarian et. al. mounted gyroscopes at hands with data stored in a portable data-logger carried by subjects [21]. They also designed another measurement tool [22] in which two gyroscopes, data-logger, flash memory and battery are integrated into a system called “Autonomous Sensing Unit Recorder”. The system is mounted to the subject's forearm to record angular changes in the roll and pitch direction. Although the measurement device is designed to be as small as possible, the required wire or cable can still cause discomfort to subjects.
The above task may have one or more shortcomings: 1) The method may be subjective, costly, and involve a lot of human effort; 2) The experimental task may be dangerous or may require time for learning; 3) The task may depend on some features that are not general to all PD patients. Here we use a task that is free of all of these shortcomings.
B. Analyses Used in Objective Measurements
In addition to the usage of a proper movement task, a choice of an efficient method of data analysis is also important. Firstly relevant features are extracted from the captured data. Then machine learning techniques can be applied to characterize the features and a trained machine can be used to make decision about an unknown data. In the following subsections, we first introduce various feature extraction methods and then describe different kinds of machine learning approaches.
1) Feature extraction
Features are extracted from motion data for evaluation. The extracted features used by physicians can be mainly categorized into three groups: direct physical quantification, signal properties, and measurements of third party objects. Direct physical quantification involves physical features obtained from movement of limbs. From the motion tasks of gait described above, researchers extracted the stride length, initiation and velocity in locomotion, range of arm movement during walking and force production at feet during walking, as well as features of hand movement. Korsten et. al. used their designed tool to record the exerted force of the subjects when they are laying their hand on a stable knob or try to prevent the knob from rotating [23]. Andria et. al developed a system to measure the force produced during handgrip [24]. Although the task may require coordination of several joints, the extracted features did not directly characterize the subjects' capabilities of joint coordination. Signal properties involved wavelet-fractal analysis and power spectral density for the accelerometer signal. Fractal dimensions in the acceleration signal during the body movement of PD patients are higher than healthy subjects [25]. Power spectral density can indicate PD tremor ranged at 4-6 Hz. For measurement of third party objects like joystick, researchers studied the distance between the target signal and the cursor controlled by subjects and the reaction time to the target. They found that PD patients demonstrate longer stationary time, reduced moving speed and larger movement oscillation. In the drawing task, size comparison between the subjects' drawing and the given figure was also considered. The size of drawings by PD patients has been found to be consistently smaller than the size of the given figure. As these kinds of measurements require external equipment, the reliability of the extracted features heavily depends on the accuracy of the equipment measurement and subjects' familiarity of the equipment. As a result, in our experimental setup, we use sensors that can provide us measurements with high accuracy and equipment that is not too intrusive to the subjects.
2) Machine learning
With features extracted from the motion tasks, some researchers applied machine learning techniques to quantify Parkinson disease. One common technology is the neural network. Fritsch et. al. applied Self-Organizing Map (SOM) to classify Parkinson Rating-Scale-Data [26]. The learning data are ten items in Webster rating scales which involves bradykinesia, rigidity, posture, etc. They also applied SOM to cluster Parkinson patients and control persons [27]. They captured motor data in tasks like tapping and handling small objects. Lee and Guan applied another type of neural network, the back-propagation neural network [28]. Using a video analysis system, features about gait such as front knee joint angle, back knee joint angle and stepping distance are extracted for classification.
Support Vector Machine (SVM) is a common approach in supervised machine learning for both linear and non-linear classification [29]. The SVM can be trained by a set of data with known class labels. After the training, a hyperplane is defined to separate the data into clusters. During classification, the input data is grouped into the corresponding class according to the hyperplane. Compared with traditional SVM, Least Squares Support Vector Machines (LS-SVM) can be applied with low computational cost and fewer local minima. LS-SVMlab is a Matlab toolbox for LS-SVM [30].
Our approach is to use LS-SVM to assess PD movements by examining the coordination between joints in the movement using auto-correlation and cross-correlation features. This method has many advantages as it is objective, uses a pointing task that is easy to carry out, and relies on features that are common to most PD patients. We describe our method in detail in the following section (section II). In section III, experiments are reported to test how well auto-correlation and cross-correlation can be used to classify motions of PD patients and controls. In section IV, the classification performance between SOM, KNN and LS-SVM is compared. Discussion and future work are provided in section V.
II. Methods
The experimental dataset used in this paper contains some motion data used in two papers by Poizner et. al. [31] and Adamovich et. al. [32]. In [31], they examined whether PD patients show deficits in pointing to remembered targets in 3D space. In [32], they studied the influence of visual information, proprioceptive feedback and spatial working memory on the accuracy of PD patients in pointing movement. The motion data in both papers are obtained under similar settings with the same equipment. In this paper we will assess the movements of the subjects using a different approach. In the following section, the information about the subjects, the experiment setup details and our suggested method will be introduced.
A. Subjects
Our data are collected from a total of 28 subjects under two different environments. Under the first environment, 5 PD patients (See Table 1) and 5 age-matched controls participated in the experiment in [31]. Under the second environment, 9 PD patients (See Table 1) and 9 age-matched controls participated in the experiment in [32]. Controls were selected to match PD patients in age, handedness, and hand used in the movements. All subjects were given a brief description of the study and signed institutionally approved consents. All PD patients were reviewed by a trained movement specialist and their Hoehn and Yahr stage were 2-3, having mild to moderate PD. They were studied neuropsychologically with tests (Mini-Mental Test and Beck Depression Inventory, in some cases, Mattis Dementia Rating Scale, Halstead-Reitan Category Test, the Wisconsin Card Sorting Test, and a word production test) to exclude patients with depression or dementia. All PD patients were tested either in the morning before their first dose of anti-Parkinsonian medications for the day, or in between the end of a dosing period and the next dose of medication.
Table 1.
Characteristics of the Parkinson's disease patients under the first environment (PD patient 1-5) and second environment (PD patient 6-14)
| PD patient | Age (years) | Disease duration (years) | Hoehn & Yahr Stage | Medicationsa |
|---|---|---|---|---|
| 1 | 71 | 12 | 3 | D, P, R |
| 2 | 69 | 13 | 3 | B, D, P |
| 3 | 75 | 4 | 2 | D, E, M |
| 4 | 64 | 8 | 2 | B, D, E |
| 5 | 71 | 3 | 2 | E, T, Z |
| 6 | 73 | 25 | 2 | L, P, T |
| 7 | 75 | 16 | 2.5 | Ve, LS, Pro |
| 8 | 74 | 10 | 2.5 | Be, L, S |
| 9 | 79 | 4 | 3 | A, L, Pra, S |
| 10 | 75 | 8 | 2.5 | Bu, C, Lu, S, Sy, T |
| 11 | 77 | 9 | 3 | None |
| 12 | 58 | 8 | 2 | L, LS, To, P, C, No |
| 13 | 72 | 5 | 3 | P, S |
| 14 | 58 | 4 | 2.5 | L, S |
A=amantidine, B=bromocriptine, Be=benztropine, Bu=buspar, C=clonazepam, D=levodopa, E=depreynl, L=levodopa preparation, regular release, LS=levodopa preparation, sustained release, Lu=ludiomil, M=primidone, No=nortriptyline, P=pergolide, Pra=pramipexole, Pro=propranolol, R=propranolol, S=selegiline, Sy=synthroid, T=trihexphenidyl, To=tolcapone, Ve=vitamin E, Z=benztropine.
B. Setup and Procedure
The motion task was to point (i.e. “touch”) a memorized 3D target using the index fingertip with a comfortable speed. The setup and procedure were similar in two sets of motion data. Firstly, we started with setup and procedure in [31]. The targets were presented by a robotic arm with a small illuminated light-emitting diode (LED) at the tip. At the start of each trial, the robotic arm was extended to a target position and held its position for 1.5s. When the arm was retracted, a short auditory signal was generated. Subjects were told to close their eyes when they heard the first signal. After one second, a second auditory signal was given and subject would point to their remembered virtual target with their eyes remained closed. Subjects were requested to make a movement to each target for four to eight times and there were five targets in total. Four targets formed a diamond in the frontal plane centered on the right shoulder, and the fifth target was in a more distal plane at the level of the shoulder. Thus, there were targets to the left and right of the shoulder, higher and lower than the shoulder and closer and farther from the shoulder. The distance between each subject and the target was adjusted accordingly such that all the subjects could reach the targets comfortably. The main difference between setup and procedure in [31] and [32] was whether the eyes are open. In [31], the subjects were asked to close their eyes during movement. In [32], the subjects could open their eyes but they were required to move their finger in a completely dark environment thus there was no visual feedback. Besides, another difference between the two dataset was the time interval of robot arm holding.
C. Data Acquisition
Infrared emitting diodes (IREDs) were affixed to the subject's acromial process of the scapula (shoulder), lateral epicondyle of the humerus (elbow), ulnar styloid process (wrist) and nail of the index fingertip (hand). The positions of IREDs were sampled at a rate of 100 Hz by each of two optoelectronic cameras (Northern Digital OPTOTRAK/2010). The positions of IREDs were represented in xyz dimensions.
D. Feature Extraction
Fig. 1 shows our procedure to generate features from the input motion data. Input motion data are first divided into ‘preparation’ and ‘pointing’ segments before feature extraction. A motion is divided into small motion segments and the standard deviation (std) of the joint coordinates at each segment is found. The motion segment is considered as a primary pointing segment if std is higher than the overall standard deviation of the joint coordinates in the whole motion. Then the primary pointing segments are combined into one longer segment if they are close to each other in time. Those pointing segments that have small durations are no longer considered as pointing segments. This gives the final pointing segment; the remaining segments are defined as the preparation segment.
Fig. 1.

Procedure to generate features from an input motion data
The motion signals can be represented in the format of acceleration and velocity. The auto-correlation coefficient (rauto) and the cross-correlation coefficient (rcross) of various motion signals are extracted as the features. Auto-correlation is commonly used in signal processing to find out the correlation between a signal and its copy with a time lag k.
| (1) |
where Y is the signal, Y¯ is the mean of the signal Y, N is the number of elements in the signal, k is time lag.
Cross-correlation is used to determine the correlation between two different signals.
| (2) |
where X and Y are two signals, X and Y are the mean signals of X¯ and Y¯, N is the number of elements in the signal X, k is the time lag.
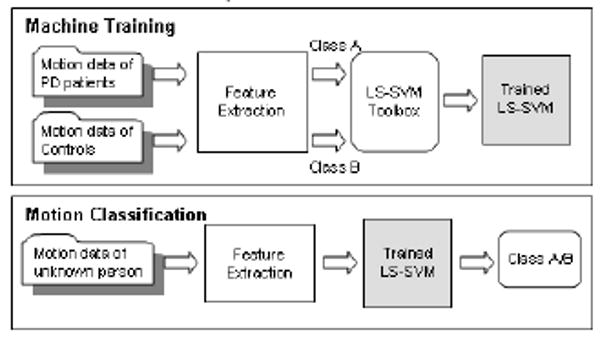
E. SVM Machine Training and Motion Classification
Fig. 2 shows the procedure of supervised machine training (left) and motion classification (right). In the process of machine training, the features extracted from the motion of PD patients and controls as well as the class labels (PD patients/controls) are passed to LS-SVM. The toolbox learns from those features and finds the hyperplane to separate data from different classes. In the process of motion classification, features are first extracted from an input motion and then passed to a trained LS-SVM. Based on the hyperplane in LS-SVM, the motion will be classified as PD patient or control. In our experiment, part of the motion data from Parkinson patients and controls will be used as training data (machine training) and the remaining motion data will be used as testing data (motion classification).
Fig. 2.
Procedure of supervised machine training and motion classification
III. Experiment 1
Some joint coordinates of a PD patient during the motion are shown in Fig. 3(a) and those of a control during the motion are shown in Fig. 3(b). It can be observed that motions of PD patients appear to be more irregular than those of controls. To quantify this fluctuation, the rauto is used. Fig. 4(a) shows the distribution of the rauto with lag k=6 of the acceleration signal in z dimension. There is a larger probability for the rauto for controls to be closer to 1 implying a strong correlation. One of the objectives in this experiment is to determine if the rauto can be used to classify motions between PD patients and controls.
Fig. 3.
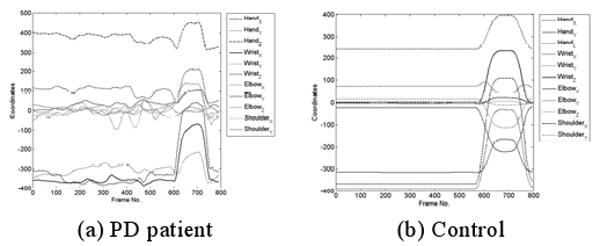
Sample joint coordinates during the motion. One second = 100 frames.
Fig. 4.
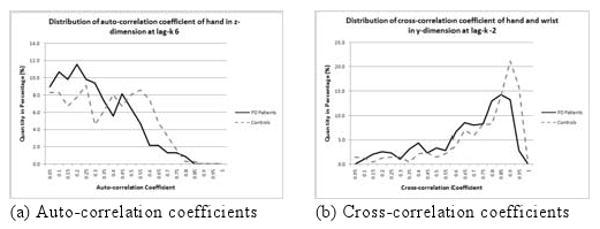
Distribution of correlation coefficients obtained from motion of PD patients and controls
PD also affects the coordination between different joints during movement. Fig. 4(b) shows the distribution of the rcross with lag k=-2 of the acceleration signal in y dimension. Samples from controls are closer to 1 which means a strong correlation. The distribution for the rcross for PD patients is closer to 0 implying a weaker correlation between joints compared with controls. Another objective of this experiment is to test if the rcross can be used as a feature to classify motions from PD patients and controls. The last objective of this experiment is to determine if the rauto and the rcross can be combined as features to boost up the classification performance. In the following subsections, we will present the experimental procedure followed by the experimental result.
A. Experimental Procedure
Using the experimental setup and procedure described in Section IIB, 395 pointing movements were captured from 14 PD patients and 476 pointing movements were captured from 14 controls under two different environments (with and without visual feedback). We split our data into four parts with each part containing approximately the same number of motions. For each trial, three parts were used as training and the remaining part was used as testing. Thus the training set and testing set were independent, and data from the two sets were not mixed. This was repeated four times using different parts for training and testing thus performing a four-fold cross-validation. The average classification rate among the four trials was obtained to show the discriminative power of the features being tested. The combinations of parameters tested in this experiment are shown in Table 2. The correlation coefficients were computed from single joints or pairs of joints. Different representations of the motion signal such as the acceleration and velocity were considered. Different values of the time lag k for each correlation coefficient were examined.
Table 2.
Parameters used in Experiment 1
| rauto alone | rcross alone | rauto & rcross combined | |
|---|---|---|---|
| Joint(s) | hand, wrist, elbow, shoulder | hand, wrist, elbow, shoulder | hand, wrist, elbow, shoulder |
| Motion signal | acceleration, velocity | acceleration, velocity | acceleration, velocity |
| Dimension | x y z as separate component | x y z as separate component | x y z as separate component |
| Motion segmentation | {preparation, pointing} | {preparation, pointing} | {preparation, pointing} |
| Lag k | 1 to 10 | -5 to 5 | 1 to 10 (for rauto), -5 to 5 (for rcross) |
B. Results for Experiment 1
This experiment tested how well auto-correlation and cross-correlation can be used to discriminate motion of PD patients and controls. In the experiment, the features listed in Table 2 were examined. For each category of features, the five best sets of parameters are shown here.
1) Result using auto-correlation
The five parameter sets used for computing the rauto with the highest classification rates are shown in Table 3. The highest classification rate was 91.7% using the rauto with lag 6 from the acceleration signals of hand, wrist, elbow and shoulder in both preparation and pointing states.
Table 3.
Parameters used for computing the auto-correlation coefficient resulting in the five highest classification rates
| Motion signal s | Ac | Ac | Ac | Ac | Ac |
|---|---|---|---|---|---|
| Joint considered* | All | All | All | All | All |
| Lag k | 6 | 7 | 5 | 4 | 2 |
| Avg. classification rate | 91.7% | 90.7% | 90.3% | 89.9% | 89.6% |
All = {hand, wrist, elbow, shoulder},
Ve = Velocity, Ac = Acceleration
2) Result using cross-correlation
The five parameter sets used for computing the rcross with the highest classification rates are shown in Table 4. The highest classification rate was 91.6% using the rcross with lag -2 from the acceleration signals of pairs from hand, wrist, elbow and shoulder in both preparation and pointing states.
Table 4.
Parameters used for computing the rcross resulting in the five highest classification rates
| Motion signal s | Ve | Ac | Ve | Ve | Ve |
|---|---|---|---|---|---|
| Joint considered* | All | All | All | All | All |
| Lag k | -2 | -1 | -1 | 1 | -4 |
| Avg. classification rate | 91.6% | 91.0% | 90.7% | 89.9% | 89.6% |
All = {hand, wrist, elbow, shoulder},
Ve = Velocity, Ac = Acceleration
3) Result using cross-correlation and auto-correlation together
The five parameter sets used for computing the rauto and rcross with the highest classification rates are shown in Table 5. In all the five cases, the correlation coefficients were computed for the acceleration motion signals at the preparation and the pointing states. The highest classification rate was 96.0% using the rcross with lag -2 from the acceleration signals of pairs from the hand, wrist, elbow and shoulder, and using the rauto with lag 6 from the acceleration signals of hand, wrist, elbow and shoulder.
Table 5.
Parameters used for computing the rauto and rcross resulting in the five highest classification rates
| Joint considered* | All | All | All | All | All |
|---|---|---|---|---|---|
| Motion signal s | Ac | Ac | Ac | Ac | Ac |
| Lag k for rauto | 6 | 8 | 6 | 5 | 6 |
| Lag k for rcross | -2 | 2 | -1 | -3 | -5 |
| Avg. classification rate | 96.0% | 95.9% | 95.9% | 95.9% | 95.8% |
c All = { rcross(H,W), rcross(H,E), rcross(H,S), rcross(W,E), rcross(W,S), rcross(E,S), rauto(H), rauto(W), rauto(E), rauto(S)},
Ve = Velocity, Ac = Acceleration
IV. Experiment 2
Apart from SVM, neural network is another machine learning technique that can also be applied for classification problems. In this experiment, Self Organizing Map (SOM) which is a common neural network was applied. On the other hand, we also compared the result with the k-nearest neighbor (KNN) method which is a simple classifier. The performance between LS-SVM, SOM and KNN were compared.
A. Experimental Procedure
A similar setup and procedure used in Experiment 1 was applied in this experiment with two differences: 1) the LS-SVM was replaced with SOM and KNN respectively; and 2) only the five sets of parameters resulting in the highest classification rates in Experiment 1 were considered.
B. Results for Experiment 2
Table 6 shows the classification rates of SOM and KNN using different sets of parameters. In all the five cases, the motion signal was represented as separate components in x, y and z dimensions of the acceleration for each of the preparation and the pointing states. The result showed that SOM and KNN work with an average classification rate of 92.7% and 95.1% respectively under the best cases. It can be seen that LS-SVM with an average classification rate of 96.0% outperforms SOM and KNN in terms of higher classification rate.
Table 6.
Classification result using SOM and KNN
| Correlation and joints involvedc | All | All | All | All | All |
|---|---|---|---|---|---|
| Motion signal s | Ac | Ac | Ac | Ac | Ac |
| Lag k for rauto | 6 | 8 | 6 | 5 | 6 |
| Lag k for rcross | -2 | 2 | -1 | -3 | -5 |
| Average classification rate of SOM | 91.7% | 91.8% | 92.7% | 89.6% | 92.4% |
| Average classification rate of KNN | 94.6% | 95.1% | 94.7% | 93.6% | 94.1% |
| Average classification rate of our approach | 96.0% | 95.9% | 95.9% | 95.9% | 95.8% |
All = { rcross(H,W), rcross(H,E), rcross(H,S), rcross(W,E), rcross(W,S), rcross(E,S), rauto(H), rauto(W), rauto(E), rauto(S)},
Ve = Velocity, Ac = Acceleration
V. Discussion
A. Basic Findings
The main purpose of our study was to examine the use of rauto and rcross on classification of motion between PD patients and controls. In this study, we used the correlation of various motion signals (acceleration, velocity) of different joints (hand, wrist, elbow, shoulder) as features and tested their classification performance with LS-SVM. The results from Experiment 1 show that using auto-correlation and cross-correlation together as features can provide the best classification (96.0%). Moreover, the classification using auto-correlation alone (91.7%) is similar to that using cross-correlation alone (91.6%). When more joints are considered, the classification performance increases. In the best five cases, all of them consider all the joints showing that all the joints favor the classification process.
B. Robustness
A general feature should perform well on different conditions and produce stable results. The robustness here is verified by the classification performance of the features under different conditions. The experiment included two sets of motion data which was obtained under different conditions. Given that the PD patients were in the mild to moderate stage of the disease, these high classification rates demonstrate the utility of these methods.
C. Classifier Comparison
In Experiment 2, SOM and KNN were trained and tested in a similar manner as in Experiment 1. Experiment results showed that classification by LS-SVM is better than that by either SOM or KNN. The classification rate by LS-SVM (96.0%) is 4% higher than that by SOM (91.6%). Although the classification rate by LS-SVM (96.0%) is only slightly (about 1%) higher than that by KNN (95.1%), the drawback with KNN is that all the training samples need to be stored and the distance between the input sample and each training sample should be computed. The recognition process by KNN will become slower and slower as we have more training data.
D. Preliminary Result on Estimating PD Severity
Apart from Experiments 1 and 2, we have performed a preliminary study estimating PD severity using our features obtained from the previous experiments. We used the Hoehn and Yahr Stage as a clinical indicator of PD severity. All PD subjects in our study have mild to moderate PD and have Hoehn and Yahr stage of 2, 2.5 and 3. Together with the controls who do not have PD, there were 4 classes of subjects with different levels of PD. We used the features found to be optimal from the previous experiments, i.e., the rauto and the rcross. We tried a simple linear discriminant analysis approach by using the function classify in Matlab to classify among these 4 classes. The training set contained 75% of the data and the testing set contained the remaining 25% of the data. A four-fold cross-validation was performed and the average classification performance of 87% was obtained. Although our data did not cover the entire range of Hoehn & Yahr Stages, this preliminary result shows that our features have the potential to be combined with more sophisticated classifiers for estimating the PD severity in accordance with clinical scales.
E. Future Work
We will apply various feature selection approaches in order to identify a reduced set of features that can improve the classification performance. Moreover, we will extend our proposed method and develop a function to evaluate the severity of a PD patient which should have a positive correlation with the UPDRS. Another possible research direction is to extend our approach for classifying among different diseases in addition to PD given the patients' motion data. Finally, physicians and surgeons can use tools with our approach to assess the effectiveness of drug and surgical therapies for PD, and to detect PD early in the course of the disease or even in asymptomatic but at-risk individuals.
Acknowledgments
The work was fully supported by a grant from the Research Grants Councils of the Hong Kong Special Administration Region, China (Project No. CityU 1167/05E). The research also was funded in part by NIH grant #2 R01 NS036449 and NSF grant #SBE-0542013 “The Temporal Dynamics of Learning Center” to UCSD.
Contributor Information
Jacky Chan, Jacky Chan is with City University of Hong Kong, 83 Tat Chee Avenue, Kowloon, Hong Kong SAR (phone: 852-2194-2925; fax: 852-2194-2836; jcpchan@cityu.edu.hk).
Howard Leung, Howard Leung is with City University of Hong Kong, 83 Tat Chee Avenue, Kowloon, Hong Kong SAR (howard@cityu.edu.hk).
Howard Poizner, Howard Poizner is with Institute for Neural Computation, University of California, San Diego (hpoizner@ucsd.edu).
References
- 1.Jankovic J. Parkinson's Disease: Clinical Features and Diagnosis. Journal of Neurology, Neurosurgery and Psychiatry. 2008 Apr;79(4):368–76. doi: 10.1136/jnnp.2007.131045. [DOI] [PubMed] [Google Scholar]
- 2.Briand K, Strallow D, Hening W, Poizner H, Sereno A. Control of Voluntary and Reflexive Saccades in Parkinson's Disease. Experimental Brain Research. 1999;129:38–48. doi: 10.1007/s002210050934. [DOI] [PubMed] [Google Scholar]
- 3.Adamovich S, Berkinblit M, Hening W, Sage J, Poizner H. The Interaction of Visual and Proprioceptive Inputs in Pointing to Actual and Remembered Targets in Parkinson's Disease. Neuroscience. 2001;104:1027–1041. doi: 10.1016/s0306-4522(01)00099-9. [DOI] [PubMed] [Google Scholar]
- 4.Schettino L, Adamovich S, Hening W, Tunik E, Sage J, Poizner H. Hand Preshaping in Parkinson's Disease: Effects of Visual Feedback and Dopaminergic Medication. Experimental Brain Research. 2006;168:186–202. doi: 10.1007/s00221-005-0080-4. [DOI] [PubMed] [Google Scholar]
- 5.Messier J, Adamovich S, Jack D, Hening W, Sage J, Poizner H. Visuomotor Learning in Immersive 3D Virtual Reality in Parkinson's Disease and in Aging. Experimental Brain Research. 2007;179:457–474. doi: 10.1007/s00221-006-0802-2. [DOI] [PubMed] [Google Scholar]
- 6.Tunik E, Feldman A, Poizner H. Dopamine Replacement Therapy Does Not Restore the Ability of Parkinsonian Patients to Make Rapid Adjustments in Motor Strategies According to Changing Sensorimotor Contexts. Parkinsonism and Related Disorders. 2007;13:425–433. doi: 10.1016/j.parkreldis.2007.02.003. [DOI] [PMC free article] [PubMed] [Google Scholar]
- 7.Hacisalihzade SS, Mansour M, Albani C. Optimization of Symptomatic Therapy in Parkinson's Disease. IEEE Transaction on Biomedical Engineering. 1989 Mar;36(3):363–372. doi: 10.1109/10.19857. [DOI] [PubMed] [Google Scholar]
- 8.Allen DP, Playfer JR, Aly NM, Duffey P, Heald A, Smith SL, Halliday DM. On the Use of Low-Cost Computer Peripherals for the Assessment of Motor Dysfunction in Parkinson's Disease-Quantification of Bradykinesia Using Target Tracking Tasks. IEEE Transactions on Neural Systems and Rehabilitation Engineering. 2007 June;15(2):286–294. doi: 10.1109/TNSRE.2007.897020. [DOI] [PubMed] [Google Scholar]
- 9.Contreras-Vidal JL, Gold DR. Dynamic Estimation of Hand Position is Abnormal in Parkinson's Disease. Parkinsonism and Related Disorders. 2004;10:501–506. doi: 10.1016/j.parkreldis.2004.06.002. [DOI] [PubMed] [Google Scholar]
- 10.Jones RD, Donaldson IM, Sharman NB. A Technique for Removal of the Visuoperceptual Component from Tracking Performance and Its Application to Parkinson's Disease. IEEE Transaction on Biomedical Engineering. 1996 Oct;43(10):1001–1010. doi: 10.1109/10.536901. [DOI] [PubMed] [Google Scholar]
- 11.Smith SL, Shannon K. Vector-based Analysis of Motor Activities in Patients with Parkinson's Disease. Proceedings of the 23rd Euromicro Conference - Short Contributions; Sep. 1997.pp. 50–55. [Google Scholar]
- 12.Vinter A, Gras P. Spatial Features of Angular Drawing Movements in Parkinson's Disease Patients. Acta Psychologica. 1998;100:177–193. doi: 10.1016/s0001-6918(98)00033-x. [DOI] [PubMed] [Google Scholar]
- 13.Kimmeskamp S, Hennig EM. Heel to Toe Motion Characteristics in Parkinson Patients During Free Walking. Clinical Biomechanics. 2001;16:806–812. doi: 10.1016/s0268-0033(01)00069-9. [DOI] [PubMed] [Google Scholar]
- 14.Sekine M, Tamura T, Akay M, Fujimoto T, Togawa T, Fukui Y. Discrimination of Walking Patterns Using Wavelet-Based Fractal Analysis. IEEE Transactions on Neural Systems and Rehabilitation Engineering. 2002 Sep;10(3):188–196. doi: 10.1109/TNSRE.2002.802879. [DOI] [PubMed] [Google Scholar]
- 15.Salarian A, Russmann H, Vingerhoets FJG, Dehollain C, Blanc Y, Burkhard PR, Aminian K. Gait Assessment in Parkinson's Disease: Toward an Ambulatory System for Long-term Monitoring. IEEE Transactions on Biomedical Engineering. 2004 Aug;51(8):1434–1443. doi: 10.1109/TBME.2004.827933. [DOI] [PubMed] [Google Scholar]
- 16.Ferrarin M, Carpinella I, Rabuffetti M, Calabrese E, Mazzoleni P, Nemni R. Locomotor Disorders in Patients at Early Stages of Parkinson's Disease: a Quantitative Analysis. 28th Annual International Conference of the IEEE Engineering in Medicine and Biology Society EMBS '06; Aug. 2006; pp. 1224–1227. [DOI] [PubMed] [Google Scholar]
- 17.Crenna P, Carpinella I, Rabuffetti M, Calabrese E, Mazzoleni P, Nemni R, Ferrarin M. The Association Between Impaired Turning and Normal Straight Walking in Parkinson's Disease. Gait & Posture. 2007;26:172–178. doi: 10.1016/j.gaitpost.2007.04.010. [DOI] [PubMed] [Google Scholar]
- 18.Carpinella I, Crenna P, Calabrese E, Rabuffetti M, Mazzoleni P, Nemni R, Ferrarin M. Locomotor Function in the Early Stage of Parkinson's Disease. IEEE Transactions on Neural Systems and Rehabilitation Engineering. 2007 Dec;15(4):543–551. doi: 10.1109/TNSRE.2007.908933. [DOI] [PubMed] [Google Scholar]
- 19.Moore ST, MacDougall HG, Gracies JM, Cohen HS, Ondo WG. Long-term Monitoring of Gait in Parkinson's Disease. Gait & Posture. 2007;26:200–207. doi: 10.1016/j.gaitpost.2006.09.011. [DOI] [PubMed] [Google Scholar]
- 20.Ackmann JJ, Sances A, Larson SJ, Baker JB. Quantitative Evaluation of Long-Term Parkinson Tremor. IEEE Transactions on Biomedical Engineering. 1977 Jan;BME-24(1):49–56. doi: 10.1109/TBME.1977.326216. [DOI] [PubMed] [Google Scholar]
- 21.Salarian A, Russmann H, Vingerhoets FJG, Burkhard PR, Blanc Y, Dehollain C, Aminian K. An ambulatory system to quantify bradykinesia and tremor in Parkinson's disease. 4th International IEEE EMBS Special Topic Conference on Information Technology Applications in Biomedicine; April 2003.pp. 35–38. [Google Scholar]
- 22.Salarian A, Russmann H, Wider C, Burkhard PR, Vingerhoets FJG, Aminian K. Quantification of Tremor and Bradykinesia in Parkinson's Disease Using a Novel Ambulatory Monitoring System. IEEE Transaction on Biomedical Engineering. 2007 Feb;54(2):313–322. doi: 10.1109/TBME.2006.886670. [DOI] [PubMed] [Google Scholar]
- 23.Korsten M, Brouwer P, Veltink P, Neef K. Assessing Motion Control Performance Of Persons with Parkinson's Disease. Proceedings of the 3rd Workshop on European Scientific and Industrial Collaboration; June 2001.pp. 287–296.pp. 27–29. [Google Scholar]
- 24.Andria G, Attivissimo F, Giaquinto N, Lanzolla AML, Quagliarella L, Sasanelli N. Functional Evaluation of Handgrip Signals for Parkinsonian Patients. IEEE Transactions on Instrumentation and Measurement. 2006 Oct;55(5):1467–1473. [Google Scholar]
- 25.Sekine M, Akay M, Tamura T, Higashi Y, Fujimoto T. Fractal Dynamics of Body Motion in Patients with Parkinson's Disease. Journal of Neural Engineering. 2004;1:8–15. doi: 10.1088/1741-2560/1/1/002. [DOI] [PubMed] [Google Scholar]
- 26.Fritsch T, Kraus PH, Pruntek H, Tran-Gia P. Classification of Parkinson Rating-Scale-Data Using a Self Organizing Neural Net. IEEE International Conference on Neural Networks. 1993 Mar;:93–98. [Google Scholar]
- 27.Fritsch T, Neuner B, Klotz P, Kraus PH. A Self-organizing Neural Net Clustering Parkinson Patients and Control Persons Using Motor Data. Proceedings of the Eighth IEEE Symposium on Computer-Based Medical Systems; June 1995.pp. 118–124. [Google Scholar]
- 28.Lee H, Guan L. Human Gait and Posture Analysis for Diagnosing Neurological Disorders. Proc IEEE Int Conf on Image Processing. 2000 Sep;2:435–438. [Google Scholar]
- 29.Theodoridis S, Koutronmbas K. Pattern Recognition. 2nd. Academic Press; New York: 2003. [Google Scholar]
- 30.Pelckmans K, Suykens JAK, Van Gestel T, De Brabanter J, Lukas L, Hamers B, De Moor B, Vandewalle J. Internal Report 02-44, ESAT-SISTA. K.U.Leuven; Leuven, Belgium: 2002. LS-SVMlab : a Matlab/C toolbox for Least Squares Support Vector Machines. [Google Scholar]
- 31.Poizner H, Fookson OI, Derkinblit MB, Hening W, Feldman G, Adamovich S. Pointing to Remembered Targets in 3-D Space in Parkinson's Disease. Motor Control. 1998 July;2(3):251–277. doi: 10.1123/mcj.2.3.251. [DOI] [PubMed] [Google Scholar]
- 32.Adamovich SV, Berkinblit MB, Hening W, Sage J, Poizner H. The Interaction of Visual and Proprioceptive Inputs in Pointing to Actual and Remembered Targets in Parkinson's Disease. Neuroscience. 2001;104(4):1027–1041. doi: 10.1016/s0306-4522(01)00099-9. [DOI] [PubMed] [Google Scholar]