

Abstract
Staff turnover on assertive community treatment (ACT) teams is a poorly understood phenomenon. This study examined annual turnover and fidelity data collected in a statewide implementation of ACT over a 5-year period. Mean annual staff turnover across all observations was 30.0%. Turnover was negatively correlated with overall fidelity at Year 1 and 3. The team approach fidelity item was negatively correlated with staff turnover at Year 3. For 13 teams with 3 years of follow-up data, turnover rates did not change over time. Most ACT staff turnover rates were comparable or better than other turnover rates reported in the mental health and substance abuse literature.
Keywords: staffing, assertive community treatment, turnover, fidelity, implementation
Introduction
Mental health administrators have been concerned about high rates of staff turnover for decades. According to the limited number of reports in the literature, annual turnover rates hover around 50% for residential mental health staff (Ben-Dror, 1994), children’s mental health programs (Glisson & James, 2002), and substance abuse treatment facility directors and counselors (McLellan, Carise, & Kleber, 2003). However, published reports range from a low of 19% annual turnover (combined voluntary and involuntary) in a survey of psychosocial rehabilitation programs (Blankertz & Robinson, 1997) to a high of 72% in residential staff when involuntary turnover is included, (Ben-Dror, 1994). In addition to program type, there is some indirect evidence that turnover varies by geographic area and may be more problematic in rural areas (Rohland & Rohrer, 1998). Given the wide, but generally high rates of turnover, concern for retaining a qualified mental health workforce is well-founded. This study seeks to describe turnover rates and their relationship to program fidelity in assertive community treatment (ACT) teams. ACT teams are specialty mental health teams serving people with serious mental illness with intense service needs.
With personnel costs consuming the majority of mental health agency budgets (Blankertz & Robinson, 1997), the impact of turnover can be detrimental in terms of additional training and administrative costs for new staff. However, the stakes are raised when considering turnover in an evidence-based practice, where specialized training, supervision, and implementation efforts are often invested in personnel (Sheidow, Schoenwald, Wagner, Allred, & Burns, 2007). For instance, there are relatively few individuals trained in evidence-based practices like ACT (Drake et al., 2001). In these programs, not only must agencies invest resources in recruiting, hiring and basic training and orientation, but ACT requires more intensive training for new staff in the specialized practice (and/or recruiting scarce staff who already know the model). Turnover on an ACT team can also increase expectations placed on staff who remain with the team, thus producing vulnerability for burnout (Pines, 1993) and negatively impacting consumer care (Maslach & Pines, 1979). Also, consumers have to adjust to new staff members and therapeutic relationships have to be rebuilt with each new staff hired.
Although staff turnover has been implicated as a barrier to progress in implementation of evidence-based practices, the impact of turnover can have both positive and negative effects. Sometimes, turnover of staff who are resistant to the practice can yield the influx of new, more engaged and cooperative staff who facilitate implementation (Wieder & Kruszynski, 2007; Woltmann & Whitley, 2007). As an example, if a staff member is uncomfortable with performing a key aspect of an evidence-based practice, such as providing services in the community rather than an office setting, turnover of that particular staff member may increase adherence to the community-based service aspect of the model. However, turnover is a complex issue in implementation, which must be understood in the context of recruiting, hiring, and training new staff and the long-term results for the team.
The ACT model
ACT remains one of the most clearly defined and well researched case management models for individuals with severe mental illness. ACT has received national recognition as an evidence-based practice (Allness & Knoedler, 2003; Lehman et al., 2004; President’s New Freedom Commission on Mental Health, 2003; Surgeon General’s Report on Mental Health, 2000; Torrey, Finnerty, Evans, & Wyzik, 2003) and has shown to be effective in key outcomes such as reducing hospitalizations, preventing homelessness, and improving quality of life (Bond et al., 2001; Coldwell & Bender, 2007; Phillips et al., 2001). Unfortunately, implementation of ACT programs has been variable and many teams do not follow the model as it was intended, even though core ingredients of ACT have been identified (Bond, 1991; Drake et al., 2001). Consequently, teams may not truly be delivering evidence-based care. The Dartmouth Assertive Community Treatment Scale (DACTS) (Teague, Bond, & Drake, 1998) was created to measure the degree to which programs are following the ACT model (i.e., fidelity). While high fidelity to the ACT model may not be sufficient in itself to ensure better consumer outcomes, it can serve as an important guide to structural elements that are necessary (Bond & Salyers, 2004), and fidelity is increasingly being recognized as essential to quality assurance (Torrey et al., 2003). Research has shown that high fidelity ACT teams have better consumer outcomes in terms of hospitalizations, substance abuse, treatment retention, and housing (Latimer, 1999; McGrew, Bond, Dietzen, & Salyers, 1994; McHugo, Drake, Teague, & Xie, 1999).
ACT may reduce levels of turnover
Fidelity to the ACT model may not only benefit consumers, but several features of the approach may lend themselves to reducing staff burnout and turnover. Boyer and Bond (1999) found that, compared to traditional case managers, ACT case managers reported significantly less burnout, less work pressure, and more job satisfaction even though they served consumers with more intensive needs in terms of diagnosis and hospitalization history. One of the primary reasons for this may be the multidisciplinary team approach of ACT. Working together as a team, collaborating with other health professionals, and sharing consumer caseloads are key features of ACT. These features may promote unity and organizational commitment among staff members, leading to less burnout, greater job satisfaction, and thus lower turnover. In their study, Boyer and Bond (1999) also reported that shared responsibility, increased knowledge, clarity of job roles, and supervisor and peer support were all correlated with reduced burnout. Moreover, the longer traditional case managers had worked in their agencies the more likely they were to be burned out or dissatisfied with their job. This was not found with ACT case managers, suggesting ACT teams fostered a greater sense of camaraderie and fellowship.
Some researchers have noted that there is a real burden with being solely responsible for consumers (Maslach & Pines, 1979). In ACT, shared caseloads where the successes and failures of consumers are shared among case managers (Test, 1979) can decrease that burden. Staff can also work with the full range of consumers on the team’s caseload without being solely responsible for any one consumer. Bond and colleagues (1991) compared an ACT team approach with an intensive individual caseload approach over a 2-year period and found that the team approach mitigated the impact of staff turnover and led to better consumer outcomes. Another notable part of the ACT team approach is daily staff team meetings. These meetings can help facilitate communication among staff and provide opportunities for mutual support (McGrew & Bond, 1995). They can also increase clarity of roles and responsibilities, which is related to decreased burnout (Cordes & Dougherty, 1993).
Other research in organizational culture and climate in human service workers has indicated that constructive team-level culture (that is, shared behavioral expectations and norms to take on challenging tasks, support maximum human potential, and encourage others) was one of the best predictors of better work attitudes, higher service quality, and lower staff turnover (Glisson & James, 2002). Conversely, another study found that hierarchical, centralized decision-making structures that require frequent supervisory approval were indicative of higher emotional exhaustion and turnover intention, compared to participatory structures where there are high levels of perceived distributive justice (i.e., fair distribution of work load and rewards) and procedural justice (i.e., organizational decisions are made fairly and involve relevant staff prior to final decision) (Knudsen, Ducharme, & Roman, 2006). These concepts map nicely onto the conceptualization of ACT as a complex adaptive system of care using ongoing mutual learning, sensemaking, and self-organization across diverse but complementary team disciplines (Allred, Burns, & Phillips, 2005). Also, team dynamics that are indicative of a participatory approach to decision-making (such as the ACT multi-disciplinary team approach) may also be related to lower staff turnover.
There is little research documenting staff turnover rates in the mental health field in general, much less on ACT teams. In ACT fidelity measurement, a related construct, staffing a team at capacity is typically not reported in the literature. Moreover, longitudinal turnover reports and information on how turnover affects program fidelity is sorely needed. We conducted an observational study of ACT programs participating in a state-wide implementation effort. We examined the relationship between turnover and fidelity, and rates of turnover over time. In this report, we: (1) describe levels of staff turnover and capacity during implementation, (2) determine whether lower turnover and higher capacity are correlated with higher ACT fidelity and better adherence to the team approach, (3) determine whether staff turnover is higher in rural teams compared to urban teams, and (4) describe the fluctuation of staffing characteristics over time.
Methods
Setting
Our study used ACT fidelity data being collected as part of a statewide technical assistance initiative for ACT teams in Indiana. The data were collected from January 2002 to December 2007 on 28 different teams. In Indiana, ACT implementation began slowly in 2001 with only 3 teams, one beginning officially in January 2001 and two others beginning in the Spring of 2002 (all 3 baseline assessments completed in early 2002). The number of ACT teams has grown substantially each year with 5 additional “cohorts” of ACT teams: 8 teams in Cohort 2 (baseline assessments Fall 2002), 4 teams in Cohort 3 (baseline assessments in late 2003 and early 2004), and 13 teams in Cohort 4 (baseline assessments in late 2004 and 2005). Cohort groupings are particularly important in the historical evolution of ACT implementation in our state because cohorts vary in the type of start-up funding obtained from the state, the context for implementation (e.g., Cohort 2 were teams taking part in the National Implementing Evidence-based practices project (Drake et al., 2001)), or whether the team started after special Medicaid funding was approved for ACT. In this report, we examined staff turnover, staff capacity levels, and overall fidelity at each of 89 available annual assessment periods (after baseline).
ACT programs in Indiana
ACT programs in Indiana are required to follow a set of standards (http://psych.iupui.edu/ACTCenter/Standards.pdf) set forth by Division of Mental Health and Addiction (DMHA) in order to maintain certification and funding as an ACT team. At a minimum, ACT teams consist of a master’s level team leader, a psychiatrist (32 hours/week for 100 consumers), at least one registered nurse, a substance abuse specialist, a vocational specialist, and bachelor’s level case managers. Team sizes vary, but programs must have a minimum of 8 staff members (6 in rural areas) and must have enough staffing to maintain a caseload ratio of 10:1 or less. Total caseload size cannot exceed 120 consumers.
ACT teams meet daily, and caseloads are shared, with 90% of consumers seen by at least 3 members of the ACT team within a month. ACT teams provide at least 75% of services in the homes and communities of consumers. Indiana DMHA standards for ACT also specify the major types of services provided by ACT teams, including symptom management, crisis assessment and intervention, family support services, ensuring access to other support services (medical/dental, legal, social, transportation), and directly providing needed case management functions for all ACT consumers, including attention to housing, finances, and activities of daily living, interpersonal skills and support, and psychoeducation regarding and mental illness and treatments.
Measures
Dartmouth assertive community treatment scale (DACTS)
The DACTS (Teague et al., 1998) is a 28-item scale that assesses the degree of fidelity to the ACT model along 3 dimensions: Human Resources (e.g., small caseload, psychiatrist on staff), Organizational Boundaries (e.g., explicit admission criteria), and Nature of Services (e.g., in-vivo services). Each item is rated on a 5-point behaviorally anchored scale, ranging from 1 = not implemented to 5 = fully implemented. The full implementation ratings were determined through a variety of expert sources, including published reports from the ACT model developers and from an expert panel (McGrew & Bond, 1995). The DACTS has been shown to discriminate between types of case management programs (Teague et al., 1998) and a precursor to the DACTS predicted consumer outcomes (McHugo et al., 1999). Ratings are made after a day-long site visit in which trained assessors review charts, observe team meetings, interview staff, and observe consumer-staff interactions. An adjusted DACTS mean was computed as the mean of 26 items, excluding H5 Continuity of Staffing item and H6 Staff capacity item described below. The adjusted DACTS mean and 28-item DACTS mean were virtually identical in this study. A mean of 4.0 is a frequently used benchmarks indicating that a program exhibits substantial fidelity to the ACT model (Teague et al., 1998).
Annual staff turnover rate
Staff turnover rates are collected as part of the fidelity assessment. We used raw data within the fidelity report or within fidelity assessment notes to determine actual staff turnover rates. Computation of staff turnover followed the DACTS protocol: (# staff left the team over the past 2 years / total number of staff positions) * (12 / # months, up to 2 years). The formula converts up to two years of data into an annualized rate. In instances where no raw turnover rate could be calculated from available reports or data, we extrapolated the annual turnover rate based on the mean of the anchor point ranges on the DACTS score the team received during that time period. For example, a team scoring a 2 on the DACTS Item H5 (Continuity of staffing) would have had an annual turnover rate ranging from 30-40% or 35% on average. For H5=1 (where the anchor description is greater than 40% annual turnover), the existing raw values ranged only from 43% to 86%, therefore we chose the mean value of 60% for three observations where H5= 1, but the raw value was missing. Across all annual turnover observations (from 1 to 5 years after baseline), the extrapolation method was used in 10 out of 89 instances.
Annual staff capacity rate
Staff capacity is a construct related to turnover. Whereas turnover is the percentage of staff positions that leave within a year, capacity refers to the degree to which a team is fully staffed, based on the budgeted number of staff positions. Aside from turnover, capacity is an important indicator that a team has maintained service continuity. For example, a team that fills vacant staff positions quickly may still run fairly efficiently compared to a team where positions are vacant for extended periods of time.
Similar to our methods for computing annual staff turnover, we used raw data within the fidelity report or fidelity assessment notes to determine actual staff capacity rates. Computation of staff capacity followed the DACTS protocol for item H6 Staff Capacity: 100 - (100 * (sum of # of staff vacancies each month for past year) / (total number of staff positions * 12 months)). In instances where no raw staff capacity rate could be calculated from available reports, we extrapolated the annual staff capacity rate based on the mean of the anchor point ranges on the DACTS score the team received during that time period. For example, a team scoring a 2 on the DACTS Item H6 (Staff capacity) would have had an annual staff capacity rate ranging from 50-64% or 57% on average. The extrapolation method was used in 15 out of 89 instances.
Team Approach
The DACTS item H2 Team Approach measures the extent to which the program functions as a team that shares the entire consumer caseload rather than individual practitioners with individual caseload. As a percentage of consumers who have face-to-face contact with more than one staff member in the most recent 2-week period, a score of 5 indicates 90% or more, 4 indicates 64-89%, 3 indicates 37-63%, 2 indicates 10-36%, and 1 indicates less than 10%.
Rural/Urban Status
Rural or urban status was determined by Indiana DMHA criteria. In Indiana, urban designations are reserved for teams in which the primary county served must have at least one city with a population of over 100,000 (n= 17 teams). All others were coded as rural (n=11 teams).
Procedures
Fidelity assessments have been part of regular technical assistance provided by a statewide technical assistance center since 2001. Assessments were completed every 6 months for the first year of a team’s development, then annually thereafter. Fidelity assessments include a day-long site visit with observations of the morning meeting, interviews with staff and consumers, chart reviews, and shadowing community visits when time allows. Initially, all fidelity visits were made by two independent assessors who compared ratings at the end of the day for consensus purposes. However, because of high inter-rater reliability (McHugo et al., 2007) and stretched resources in terms of number of assessors available for the number of sites, we began using only one assessor for fidelity assessment in 2005. All fidelity assessors were trained in the DACTS and were either consultant/trainers or implementation monitors employed by the ACT Center, the technical assistance center tasked with monitoring ACT implementation in Indiana (Salyers, McKasson, Bond, McGrew, Rollins, & Boyle, 2007). Because the assessment interval did not continue on 6-month intervals, only annual assessments after the baseline assessment were included in this report. Annual assessments were included in the report if they were completed within 6 months of the targeted date for follow-up.
Data Analysis
First, we computed descriptive statistics according to both cohort and annual follow-up periods. Then, we examined correlations between staff turnover and staff capacity with adjusted mean DACTS fidelity within each annual follow-up period. For more exploratory analyses, we performed correlations between the Team Approach fidelity item, staff turnover rates, and staff capacity rates. T-tests were completed to determine differences in ACT turnover or capacity based on urban/rural status within each annual follow-up period. To describe the fluctuation of staffing characteristics over time, we graphed turnover for each cohort over each annual follow-up year and also across calendar years to examine historical trends. Then to further assess longitudinal changes in staff turnover and capacity, we selected a subsample of 13 teams (cohorts 2001- 2004) who each had follow-up periods of at least 3 years for longitudinal analyses. We used repeated measures analysis of variances (ANOVAs) to test for significant changes in staff turnover, staff capacity, and fidelity scores over time.
Results
Across all annual observations, mean staff turnover was 30.0% (SD = 19.0%, ranging from 4.8% to 85.5%; n = 89). Using a benchmark of 50% from some published rates, 76 (83.5%) of the observations had a staff turnover rate less than 50%. Mean staff capacity across all observations was 93.9% (SD = 5.8%, ranging from 57.0% to 100.0%; n = 89). Descriptive statistics for staff turnover, staff capacity, and adjusted DACTS mean fidelity scores of all cohorts across each available follow-up period are shown in Table 1.
Table 1.
Descriptive statistics of staff turnover, capacity, and fidelity across cohorts, across rural/ urban status, and across follow-up year.
| Year 1 | Year 2 | Year 3 | Year 4 | Year 5 | |
|---|---|---|---|---|---|
| All teams combined | |||||
| N (teams) | 28 | 26 | 14 | 10 | 11 |
| Staff Turnover % mean (sd) | 28.7 (21.9) | 31.2 (19.2) | 23.5 (13.9) | 36.1 (18.9) | 32.7 (17.1) |
| Staff Capacity % mean (sd) | 93.4 (8.0) | 93.2 (5.0) | 94.9 (4.5) | 96.1 (2.1) | 93.4 (4.6) |
| Adjusted DACTS mean (sd)a | 4.1 (0.3) | 4.2 (0.3) | 4.2 (0.2) | 4.3 (0.2) | 4.2 (0.4) |
| Cohort 1 | |||||
| N (teams) | 3 | 2 | 2 | 2 | 3 |
| Staff Turnover % mean (sd) | 11.4 (8.5) | 9.8 (7.1) | 10.8 (0.4) | 27.7 (10.8) | 23.5 (10.2) |
| Staff Capacity % mean (sd) | 97.8 (1.5) | 92.3 (7.4) | 96.4 (1.6) | 95.6 (2.2) | 94.2 (6.2) |
| Adjusted DACTS mean (sd)a | 4.4 (0.1) | 4.5 (0.0) | 4.2 (0.1) | 4.3 (0.2) | 4.2 (0.2) |
| Cohort 2 | |||||
| N (teams) | 8 | 8 | 8 | 7 | 7 |
| Staff Turnover % mean (sd) | 20.0 (7.8) | 23.4 (10.5) | 25.6 (15.1) | 39.3 (21.8) | 39.0 (17.8) |
| Staff Capacity % mean (sd) | 90.4 (13.7) | 93.9 (5.9) | 93.5 (5.3) | 96.3 (2.4) | 93.0 (4.7) |
| Adjusted DACTS mean (sd)a | 4.0 (0.1) | 4.0 (0.2) | 4.1 (0.2) | 4.2 (0.2) | 4.2 (0.4) |
| Cohort 3 | |||||
| N (teams) | 4 | 4 | 3 | 1 | 1 |
| Staff Turnover % mean (sd) | 38.5 (25.7) | 46.6 (25.8) | 30.9 (10.0) | 30.7 (--) | 16.5 (--) |
| Staff Capacity % mean (sd) | 91.7 (4.5) | 90.7 (6.9) | 95.9 (2.1) | 95.4 (--) | 94.5 (--) |
| Adjusted DACTS mean (sd)a | 4.1 (0.1) | 4.2 (0.3) | 4.2 (0.0) | 4.4 (--) | 4.5 (--) |
| Cohort 4 | |||||
| N (teams) | 13 | 12 | 1 | 0 | 0 |
| Staff Turnover % mean (sd) | 35.1 (25.8) | 34.9 (18.7) | 10.0 (--) | N/A | N/A |
| Staff Capacity % mean (sd) | 94.7 (3.8) | 93.7 (3.8) | 100.0 (--) | N/A | N/A |
| Adjusted DACTS mean (sd)a | 4.2 (0.5) | 4.3 (0.3) | 4.5 (--) | N/A | N/A |
| Total Urban | |||||
| N (teams) | 17 | 16 | 7 | 5 | 6 |
| Staff Turnover % mean (sd) | 35.3 (24.8) | 35.0 (19.4) | 28.5 (11.2) | 45.2 (15.3) | 34.2 (15.0) |
| Staff Capacity % mean (sd) | 93.1 (3.6) | 93.5 (4.5) | 95.8 (2.7) | 96.2 (2.7) | 94.0 (3.4) |
| Adjusted DACTS mean (sd)a | 4.1 (0.4) | 4.2 (0.3) | 4.2 (0.2) | 4.3 (0.2) | 4.2 (0.5) |
| Total Rural | |||||
| N (teams) | 11 | 10 | 7 | 5 | 5 |
| Staff Turnover % mean (sd) | 18.6 (11.0) | 25.2 (18.1) | 18.5 (15.3) | 27.0 (19.0) | 30.9 (21.0) |
| Staff Capacity % mean (sd) | 93.9 (12.3) | 92.8 (6.0) | 94.1 (5.8) | 95.9 (1.7) | 92.8 (6.1) |
| Adjusted DACTS mean (sd)a | 4.3 (0.2) | 4.3 (0.3) | 4.2 (0.2) | 4.3 (0.2) | 4.2 (0.2) |
DACTS is the Dartmouth Community Treatment Scale, with possible means ranging from 1 – 5, with 5 indicating maximum adherence to the model. The Adjusted DACTS mean is the mean of all DACTS items, excluding H5 (Staff Turnover) and H6 (Staff Capacity).
Table 2 shows the correlations between staff turnover, staff capacity, adjusted DACTS fidelity mean, and team approach item scores during each annual follow-up period. Staff turnover was negatively correlated with overall fidelity (as turnover increased, fidelity to the model decreased) at Year 1 and Year 3 follow-ups. Staff capacity was not significantly correlated with overall fidelity in any time period. Staff turnover and capacity rates were negatively correlated only at Year 3, with all other time periods demonstrating no significant correlation between these two staffing characteristics. Looking at effect sizes over multiple time periods, staff turnover is negatively correlated with staff capacity (average effect size of .54, or medium) and overall fidelity (average effect size of .74, or medium to large). Staff capacity showed a small to medium effect size for its positive correlation with overall fidelity (average effect size of .45). The team approach item score was negatively correlated with staff turnover at Year 3 and positively correlated with staff capacity at Year 1 and Year 3. Over all time periods, team approach showed a medium to large effect size for negative correlation with staff turnover (average effect size of .66) and a small effect size for positive correlation with staff capacity (average effect size of .34).
Table 2.
Correlations and effect sizes between staff turnover, staff capacity, and fidelity at Year 1 follow-up (N=28), Year 2 follow-up (N=26), Year 3 follow-up (N=14), Year 4 follow-up (N=10), and Year 5 follow-up (N=11).
| Assessment time period | Staff turnover % | Staff capacity % | |||
|---|---|---|---|---|---|
| r | Effect size (d) | r | Effect size (d) | ||
| Staff capacity % | Year 1 | -.04 | -0.08 | ---- | ---- |
| Year 2 | -.16 | -0.32 | ---- | ---- | |
| Year 3 | -.57* | -1.39 | ---- | ---- | |
| Year 4 | -.37 | -0.80 | ---- | ---- | |
| Year 5 | -.06 | -0.12 | ---- | ---- | |
| Adjusted DACTS mean a | Year 1 | -.52** | -1.22 | .36 | 0.77 |
| Year 2 | -.06 | -0.12 | .15 | 0.30 | |
| Year 3 | -.62* | -1.58 | .39 | 0.85 | |
| Year 4 | -.54 | -1.28 | .13 | 0.26 | |
| Year 5 | .24 | 0.49 | .03 | 0.06 | |
| Team Approach item | Year 1 | -.25 | -0.52 | .53** | 1.25 |
| Year 2 | -.05 | -0.10 | .29 | 0.61 | |
| Year 3 | -.67** | -1.81 | .63* | 1.62 | |
| Year 4 | -.34 | -0.72 | -.54 | -1.28 | |
| Year 5 | -.08 | -0.16 | -.26 | -0.54 | |
DACTS is the Dartmouth Community Treatment Scale, with possible means ranging from 1 – 5, with 5 indicating maximum adherence to the model. The Adjusted DACTS mean is the mean of all DACTS items, excluding H5 (Staff Turnover) and H6 (Staff Capacity).
p<.05.
p<.01.
Comparing urban and rural teams within each follow-up year, there was only one significant finding. At Year 1, urban teams had higher turnover (n = 17, M = 35.3; SD = 24.8) than rural teams (n = 11, M = 18.6; SD = 11.0; t = 2.10, p = .046). There were no other significant differences between urban and rural teams on staff turnover rates, staff capacity rates, or adjusted mean DACTS score, as shown in Table 1.
Figure 1 indicates the fluctuation of mean turnover across annual follow-up year for each cohort with more than one year of staff turnover data. Turnover seems relatively stable for Years 1 and 2 for all 4 cohorts. However, turnover starts out lower in Cohorts 1 and 2 at Year 1, 2, and 3, followed by some increase in turnover in Years 4 and 5. The pattern is reversed for Cohorts 3 and 4, with turnover starting off relatively high in Years 1 and 2, and decreasing somewhat in subsequent years. Alternatively, in Figure 2, we present data for each cohort in absolute calendar years of assessment to get an idea of historical fluctuations in staff turnover. With the exception of Cohort 3’s spike in 2004, a more defined increase in turnover can be noted in 2006 and 2007.
Figure 1. ACT staff turnover by follow-up year for cohorts 1-4.
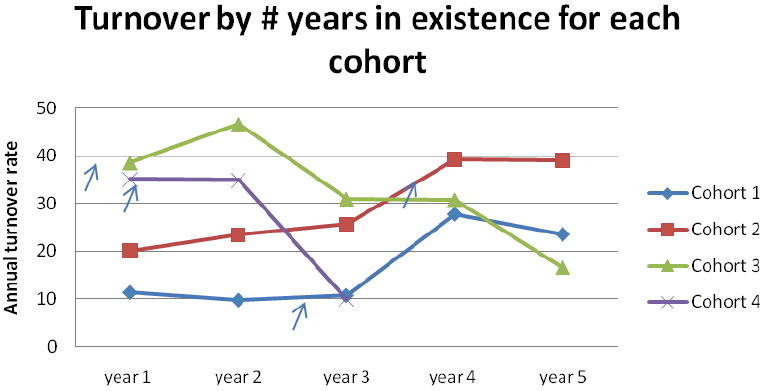
Cohort is defined by when the baseline assessment was completed. Cohort 1: early 2002; Cohort 2: Fall 2002; Cohort 3: late 2003 and early 2004; Cohort 4: late 2004 and 2005.
Note: The arrows show the approximate time that Medicaid per diem began for each cohort. The change in admission criteria happened approximately one year later.
Figure 2. ACT staff turnover rates by calendar year for cohorts 1-4.
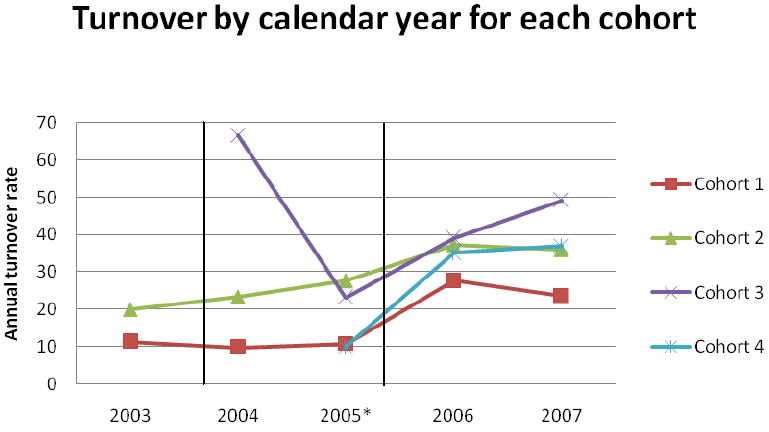
Cohort is defined by when the baseline assessment was completed. Cohort 1: early 2002; Cohort 2: Fall 2002; Cohort 3: late 2003 and early 2004; Cohort 4: late 2004 and 2005.
The first vertical line indicates the start of special Medicaid per diem funding for ACT (October 2004) and the second indicates a policy change of more stringent admission criteria (October, 2005).
A subsample of 13 teams who each had 3 years of follow-up data is shown in Table 3. For the 13 teams, staff turnover rates, capacity, and adjusted DACTS means were stable across assessments at Year 1, 2, and 3.
Table 3.
Staff turnover, staff capacity, and fidelity for subsample of 13 teams over time
| Year 1 | Year 2 | Year 3 | Test of Significance | |
|---|---|---|---|---|
| Staff turnover % mean (sd) | 22.4 (14.9) | 24.4 (11.8) | 24.5 (13.9) | F= 0.1, n.s. |
| Staff capacity % mean (sd) | 91.4 (11.0) | 92.0 (5.8) | 94.7 (4.6) | F= 1.3, n.s |
| Adjusted DACTSa mean (sd) | 4.1 (0.2) | 4.1 (0.3) | 4.2 (0.2) | F= 1.2, n.s. |
DACTS is the Dartmouth Community Treatment Scale, with possible means ranging from 1 – 5, with 5 indicating maximum adherence to the model. The Adjusted DACTS mean is the mean of all DACTS items, excluding H5 (Staff Turnover) and H6 (Staff Capacity).
n.s. = nonsignificant
Discussion
The overall ACT staff turnover rates in this study (averaging about 30%) seem to be slightly higher than that of psychosocial rehabilitation programs (Blankertz & Robinson, 1997) but lower than turnover rates reported for residential staff, substance abuse treatment staff, and children’s mental health staff, reported in the literature. The vast majority of observations indicated annual turnover of 50% or less. Overall fidelity scores were generally high (above 4.0) at one year follow-up and beyond. This corroborates other studies from the National Implementing Evidence-based Practices Project indicating ACT teams typically ramp up to high fidelity within the first year and do not fluctuate much after this (McHugo et al., 2007).
Staff turnover seems to be relatively stable during the first few years of a team’s development. However, in our sample, we saw two divergent patterns by cohort. This may be an indication of the urgency of start-up. Cohorts 1 and 2, with relatively low and stable turnover rates in the first 3 follow-up years (means of 26% or less), began their ACT programs with some competitive, but modest state incentive funding, but under no urgent deadlines to implement ACT. Many of these teams had an interest in ACT implementation over and above funding incentives. Cohorts 3 and 4 teams had generally higher rates of turnover in their first 2 years of implementation (means of 35% or more). Cohort 4 teams, in particular, started during or soon after our state’s implementation of ACT Medicaid funding in late 2004. In retrospect, some teams in Cohorts 3 and 4 anecdotally reported assembling their staff quickly to take advantage of the enriched funding source, with many agencies uninterested in ACT implementation prior to initiation of ACT Medicaid funding. In some cases, hires may have been a poor match for the job and turned over early in the team’s development. Also, the historical data on turnover in calendar years indicates a rise in turnover across most cohorts in 2006 and 2007, regardless of year of follow-up. Some older teams anecdotally reported some staff turnover soon after a new policy was enacted in 2005 that tightened admission criteria and encouraged teams to graduate higher functioning clients from their caseloads. For some staff, the prospect of working with new consumers who were functioning poorly was an undesirable shift, though designed to bring caseloads more in line with the explicit admission criteria for ACT. Comparing the two graphs, it appears that team age did not have a consistent impact on team turnover across all cohorts, particularly when compared to the more consistent patterns across cohorts in discrete calendar years. From this, we might gather that contextual historical events (e.g., shifts in mental health policies and other system changes) may have a stronger impact on staff turnover than the age of a particular team. Shifts in mental health policy, such as those implicitly increasing the acuity of consumer caseloads, may also impact level of burnout experienced by staff, thus increasing turnover. Also, initial turnover during a short period, may add burden to remaining staff who then leave the program as well, resulting in a cascade of turnover. Though burnout was not measured in this study, it would be a fruitful avenue of future research into factors impacting turnover, possibly as an intervening variable that could be targeted for intervention to reduce turnover.
Higher turnover rates were correlated with overall fidelity to the model in a negative way, though not consistently across each year of follow-up. Effect sizes were, however, medium or larger in 4 of the 5 follow-up years, a relationship between higher turnover and lower overall fidelity to the model. Either turnover lowers team functioning or poor team functioning increases turnover; the direction of the relationship cannot be inferred. Alternatively, a third factor could impact both turnover and overall fidelity. For example, both phenomena could be a function of hiring clinicians who are uncommitted to ACT’s multidisciplinary, community-based treatment approach and ultimately leave the team. Capacity was positively related to overall fidelity in only one follow-up year. Ironically, staff turnover and staff capacity rates were negatively correlated in only one year, indicating some independence in constructs: staff turnover does not necessarily translate into decreased staffing levels. Some of this may be an artifact of our state’s high ACT standards that requires teams to function at high staff capacity to receive and maintain certification (no such requirement for turnover). Another explanation may be the ability or tendency to fill staff vacancies with relative ease, compared to the arguably tougher task of getting staff to stay in these positions. Another explanation could be that the addition of new staff positions as a team grows would impact staff capacity scores but would not impact turnover. The team approach fidelity item was negatively correlated with staff turnover at Year 3 follow-up and positively correlated with staff capacity at Years 1 and 3 follow-up, indicating some relationship between use of the team approach and staffing patterns. As indicated earlier, team approach has been associated with decreased team burden in the event of staff turnover (Bond et al., 1991). Though the DACTS item level score is a crude indicator of use of the team approach, these findings indicate future studies might examine a more fine-grained assessment of team approach and its potential for reducing turnover or improving capacity on ACT teams (or vice versa). The strongest effects were seen in Year 3, though it is difficult to conclude why this was the case from the data available. One possible explanation could be that extraneous start-up issues are resolved by Year 3 so that relationships between turnover and other aspects of fidelity are more easily observed. But even this explanation has limitations because the patterns of turnover varied considerably across cohorts, and Cohort 1 began fidelity assessments at a later point in their start-up, relative to other cohorts who assembled quickly and had the initial assessment earlier in the teams’ development.
The only difference between rural and urban teams was at Year 1 where urban teams had higher turnover than rural teams, the opposite direction of the anticipated relationship. Subsequent follow-ups trended similarly with urban teams having higher turnover than rural teams. Much discussion in our state has been focused on the lack of mental health professionals in rural areas. The data in this study indicate that turnover and capacity is not necessarily an issue for ACT teams in rural areas, potentially influenced again by the strict state standards for ACT that “level the playing field.”
In conclusion, turnover on ACT teams seems comparable or better than other mental health and substance abuse treatment programs. Although complicated by historical context, turnover on ACT teams seems relatively stable in the first 3 years of implementation and negatively correlated with overall fidelity of implementation.
Limitations of paper
One potential limitation of our study is that it is based on one state’s implementation of ACT, limiting variability and generalizability of the data. This state environment requires high fidelity to the model in order to obtain certification and funding, restricting the range in fidelity scores. A wider range of ACT fidelity scores may yield different relationships with staff turnover and capacity.
This paper examines gross level of turnover without the ability to distinguish between role of the position that turns over or types of turnover (e.g., voluntary). In our data, the turnover of a team leader is treated equally with the turnover of other clinical positions on the team (e.g., the turnover of 1 of several case management positions). It is not difficult to imagine that the impact of turnover in positions might not be equal. Also, turnover of particularly problematic staff may have a positive impact on the team. In other words, turnover of undedicated staff or staff who are a poor fit with the ACT model might sometimes be a good thing and both were lumped together in this study. Unfortunately, we were unable to examine such fine-grained relationships in the data available.
Another limitation of this study is the heavily structural nature of many of the DACTS items. Although we did find a relationship between high turnover and low overall ACT fidelity, staff turnover probably impacts other facets of service quality not measured well by the current DACTS. New developments with the ACT fidelity measurement may identify an even more robust relationship between staff turnover and ACT model fidelity. Future studies should also address the relationship between staff turnover and consumer outcomes.
Acknowledgments
This study was supported by contracts with the Indiana Division of Mental Health and Addiction and an IP-RISP grant from the National Institute of Mental Health (R24 MH074670; Recovery Oriented Assertive Community Treatment). We thank Lia Hicks, Jennifer Wright, David McClow, and Kevin Rand for their helpful comments on an earlier draft of this manuscript.
Contributor Information
Angela L. Rollins, Research Director, ACT Center of Indiana; Assistant Research Professor, Psychology Department, Indiana University Purdue University Indianapolis (IUPUI)
Michelle P. Salyers, Research Scientist, VA HSR&D Center on Implementing Evidence-based Practice, Roudebush VAMC and IU Center for Health Services and Outcomes Research, Regenstrief Institute, Inc; Co-Director, ACT Center of Indiana; Associate Research Professor, Department of Psychology, IUPUI
Jack Tsai, Postdoctoral Research Fellow, Department of Psychiatry, Yale University
Jennifer M. Lydick, Research Assistant, ACT Center of Indiana, Department of Psychology, IUPUI
References
- Allness DJ, Knoedler WH. The PACT model of community-based treatment for persons with severe and persistent mental illness: A manual for PACT start-up. Arlington, VA: NAMI; 2003. [Google Scholar]
- Allred CA, Burns BJ, Phillips SD. The assertive community treatment team as a complex dynamic system of care. Administration and Policy in Mental Health. 2005;32(3):211–220. doi: 10.1007/s10488-004-0841-6. [DOI] [PubMed] [Google Scholar]
- Ben-Dror R. Employee turnover in community mental health organization: A developmental stages study. Community Mental Health Journal. 1994;30(3):243–257. doi: 10.1007/BF02188885. [DOI] [PubMed] [Google Scholar]
- Blankertz LE, Robinson SE. Turnover intentions of community mental health workers in psychosocial rehabilitation services. Community Mental Health Journal. 1997;33(6):517–529. doi: 10.1023/a:1025000703487. [DOI] [PubMed] [Google Scholar]
- Bond GR. Variations in an assertive outreach model. New Directions for Mental Health Services. 1991;52:65–80. doi: 10.1002/yd.23319915207. [DOI] [PubMed] [Google Scholar]
- Bond GR, Becker DR, Drake RE, Rapp CA, Meisler N, Lehman AF, et al. Implementing supported employment as an evidence-based practice. Psychiatric Services. 2001;52(3):313–322. doi: 10.1176/appi.ps.52.3.313. [DOI] [PubMed] [Google Scholar]
- Bond GR, Pensec M, Dietzen L, McCaffety D, Giemza R, Sipple HW. Intensive case management for frequent users of psychiatric hospitals in a large city: A comparison of team and individual caseloads. Psychosocial Rehabilitation Journal. 1991;15(1):90–98. [Google Scholar]
- Bond GR, Salyers MP. Prediction of outcome from the Dartmouth assertive community treatment fidelity scale. CNS Spectrums. 2004;9(12):937–942. doi: 10.1017/s1092852900009792. [DOI] [PubMed] [Google Scholar]
- Boyer SL, Bond GR. Does assertive community treatment reduce burnout? A comparison with traditional case management. Mental Health Services Research. 1999;1(1):31–45. [Google Scholar]
- Coldwell CM, Bender WS. The effectiveness of assertive community treatment for homeless populations with severe mental illness: a meta-analysis. American Journal of Psychiatry. 2007;164(3):393–399. doi: 10.1176/ajp.2007.164.3.393. [DOI] [PubMed] [Google Scholar]
- Cordes CL, Dougherty TW. A review and an integration of research on job burnout. Academy of Management Review. 1993;18(4):621–656. [Google Scholar]
- Drake RE, Goldman HH, Leff HS, Lehman AF, Dixon L, Mueser KT, et al. Implementing evidence-based practices in routine mental health service settings. Psychiatric Services. 2001;52(2):179–182. doi: 10.1176/appi.ps.52.2.179. [DOI] [PubMed] [Google Scholar]
- Glisson C, James LR. The cross-level effects of culture and climate in human service teams. Journal of Organizational Behavior. 2002;23(6):767–794. [Google Scholar]
- Knudsen HK, Ducharme LJ, Roman PM. Counselor emotional exhaustion and turnover intention in therapeutic communities. Journal of Substance Abuse Treatment. 2006;31(2):173–180. doi: 10.1016/j.jsat.2006.04.003. [DOI] [PubMed] [Google Scholar]
- Latimer E. Economic impacts of assertive community treatment: A review of the literature. Canadian Journal of Psychiatry. 1999;44:443–454. doi: 10.1177/070674379904400504. [DOI] [PubMed] [Google Scholar]
- Lehman AF, Kreyenbuhl J, Buchanan RW, Dickerson FB, Dixon LB, Goldberg R, et al. The Schizophrenia Patient Outcomes Research Team (PORT): Updated treatment recommendations 2003. Schizophrenia Bulletin. 2004;30:193–217. doi: 10.1093/oxfordjournals.schbul.a007071. [DOI] [PubMed] [Google Scholar]
- Maslach C, Pines A. Burnout, the loss of human caring. In: Pines A, Maslach C, editors. Experiencing social psychology. New York: Random House; 1979. [Google Scholar]
- McGrew JH, Bond GR. Critical ingredients of assertive community treatment: Judgments of the experts. Journal of Mental Health Administration. 1995;22:113–125. doi: 10.1007/BF02518752. [DOI] [PubMed] [Google Scholar]
- McGrew JH, Bond GR, Dietzen LL, Salyers MP. Measuring the fidelity of implementation of a mental health program model. Journal of Consulting and Clinical Psychology. 1994;62(4):670–678. doi: 10.1037//0022-006x.62.4.670. [DOI] [PubMed] [Google Scholar]
- McHugo GJ, Drake RE, Teague GB, Xie H. The relationship between model fidelity and client outcomes in the New Hampshire Dual Disorders Study. Psychiatric Services. 1999;50:818–824. doi: 10.1176/ps.50.6.818. [DOI] [PubMed] [Google Scholar]
- McHugo GJ, Drake RE, Whitley R, Bond GR, Campbell K, Rapp CA, et al. Fidelity outcomes in the National Evidence-Based Practices Project. Psychiatric Services. 2007;58:1279–1284. doi: 10.1176/ps.2007.58.10.1279. [DOI] [PubMed] [Google Scholar]
- McLellan AT, Carise D, Kleber HD. Can the national addiction treatment infrastructure support the public’s demand for quality care? Journal of Substance Abuse Treatment. 2003;25(2):117–121. [PubMed] [Google Scholar]
- Phillips SD, Burns BJ, Edgar ER, Mueser KT, Linkins KW, Rosenheck RA, et al. Moving assertive community treatment into standard practice. Psychiatric Services. 2001;52(6):771–779. doi: 10.1176/appi.ps.52.6.771. [DOI] [PubMed] [Google Scholar]
- Pines AM. Burnout. In: Goldberger L, Breznitz S, editors. Handbook of stress: theoretical and clinical aspects. 2. New York: The Free Press; 1993. [Google Scholar]
- President’s New Freedom Commission on Mental Health. Achieving the promise: Transforming mental health care in America Final Report. DHHS Pub No SMA-03-3832. Rockville, MD: Substance Abuse and Mental Health Services Administration; 2003. [Google Scholar]
- Rohland BM, Rohrer JE. Capacity of rural community mental health centers to treat serious mental illness. Community Mental Health Journal. 1998;34(3):261–273. doi: 10.1023/a:1018765724121. [DOI] [PubMed] [Google Scholar]
- Sheidow AJ, Schoenwald SK, Wagner HR, Allred CA, Burns BJ. Predictors of workforce turnover in a transported treatment program. Administration and Policy in Mental Health and Mental Health Services Research. 2007;34(1):45–56. doi: 10.1007/s10488-006-0061-3. [DOI] [PubMed] [Google Scholar]
- Surgeon General’s Report on Mental Health. Washington, DC: US Government Printing Office; 2000. [Google Scholar]
- Teague GB, Bond GR, Drake RE. Program fidelity in assertive community treatment: development and use of a measure. American Journal of Orthopsychiatry. 1998;68(2):216–232. doi: 10.1037/h0080331. [DOI] [PubMed] [Google Scholar]
- Test MA. Continuity of care in community treatment. New Directions for Mental Health Services. 1979;2:15–23. [Google Scholar]
- Torrey WC, Finnerty M, Evans A, Wyzik PF. Strategies for leading the implementation of evidence-based practices. Psychiatric Clinics of North America. 2003;26:883–897. doi: 10.1016/s0193-953x(03)00067-4. [DOI] [PubMed] [Google Scholar]
- Wieder BL, Kruszynski R. The salience of staffing in IDDT implementation: One agency’s experience. American Journal of Psychiatric Rehabilitation. 2007;10:103–112. [Google Scholar]
- Woltmann EM, Whitley R. The role of staffing stability in the implementation of integrated dual disorders treatment: An exploratory study. Journal of Mental Health Administration. 2007;16:757–769. [Google Scholar]