

Summary
We examine obesity, intentional weight loss, and physical disability in older adults. Based on prospective epidemiological studies, BMI exhibits a curvilinear relationship with physical disability; there appears to be some protective effect associated with older adults being overweight. Whereas the greatest risk for physical disability occurs in older adults who are ≥class II obesity, the effects of obesity on physical disability appears to be moderated by both sex and race. Obesity at age 30 constitutes a greater risk for disability later in life than when obesity develops at age 50 or later; however, physical activity may buffer the adverse effects obesity has on late life physical disability. Data from a limited number of randomized clinical trials (RCTs) reinforce the important role that physical activity plays in weight loss programs for older adults. Furthermore, short-term studies have found that resistance training may be particularly beneficial in these programs since this mode of exercise attenuates the loss of fat-free mass during caloric restriction. Multi-year RCTs are needed to examine whether weight loss can alter the course of physical disablement in aging and to determine the long-term feasibility and effects of combining resistance exercise with weight loss in older adults.
Keywords: Body-mass index (BMI), physical function, elderly, physical activity, exercise
INTRODUCTION
The obesity epidemic has generated concern in the press and scientific literature largely due to the documented increases in diabetes (www.cdc.gov/diabetes), a possible stalling of the improvements in hypertension, and its potential to contribute to cardiovascular disease (CVD) incidence, certain cancers, and mortality (1-3). Despite the paucity of randomized clinical trials (RCTs) on obesity treatment in older adults, a position statement by The Obesity Society has articulated quite clearly the magnitude of the health threat that obesity poses for the elderly (4). Ironically, physical disability, one of the most costly complications of obesity with aging, is often overlooked (5-7). Physical disability is a core element of health-related quality of life (8), it is a key indicator of morbidity in the population, and the ultimate marker of success for public health programs (9).
There are many different pathways through which obesity poses a threat to physical disability in aging. For example, in addition to the direct effects on mobility and musculoskeletal conditions such as arthritis, there is the long-term impact that obesity has on physical disability due to the complications of diabetes and the increased risk it poses for cardiovascular disease (1,7,10). Furthermore, the relationship between obesity and physical disability is particularly problematic because clinical and public health programs are less equipped to address the prevention and treatment of physical disability than traditional clinical outcomes.
Defining the Terms Older Adults, Obesity, and Physical Disability
Consistent with the Centers for Disease Control (www.cdc.gov/aging), we define an older adult as a person ≥65 years of age. An obese older adult is anyone with a BMI ≥30 kg/m2. Although the use of BMI as an index of obesity has been criticized in the epidemiological literature (11), it remains the primary clinical approach used to assess obesity and continues to be used in large national trials such as the Diabetes Prevention Program (12) and Look AHEAD (13).
The earliest and most prominent framework for disability was described by sociologist Saad Nagi (14). His work was influential in medicine through the World Health Organization's (WHO) International Classification System of Impairments, Disability and Handicaps (ICIDH-1) (15). Recently, the ICIDH-1 was revised through the International Classification System of Functioning, Disability, and Health (ICF) (16). The ICF now includes impairments (e.g., deficits in strength or cardiorespiratory fitness) under the rubric of disability along with a range of behaviors including either discrete tasks/actions or participation in life situations. Discrete tasks or actions typically include walking tests, stair climbing, and in some instances balance tasks. These discrete tasks or actions are assessed through either actual performance or self-report. Participation in life situations has been assessed by self-report and includes either basic activities of daily living (ADLs) such as difficulty getting into and out of bed and toileting or instrumental activities of daily living (IADLs) such as doing house work or shopping. For the purpose of this review, physical disability is limited to either discrete physical tasks/actions or to ADLs/IADLs. The reason is that until publication of the revised ICF model in 2002, impairments were not considered a disability.
Specific Aims of this Review
The specific aims of this paper are to provide a narrative review of the prospective epidemiological evidence in which investigators have studied older adults providing data on the role of obesity in the onset or progression of physical disability. When available, we also evaluate the role that physical activity/fitness has in buffering the adverse relationship that obesity has on physical disability. Finally, we review the few RCTs that have been conducted on weight loss as a treatment for physical disability in aging. We believe that the direction taken in this review will be helpful in guiding researchers as they design future RCTs to investigate the important topic of how to best treat excessive weight in older adults in order to promote independence and thus an enhanced quality of life.
SEARCH METHODS
To identify potential studies for this review, we conducted database searches of PubMed for English language articles. In order to be included, studies had to involve older human subjects. Other requirements included data on BMI and at least one relevant outcome that could be classified as physical disability. For the prospective epidemiological search, we used the following keywords: BMI (All Fields), obesity (MeSH Terms, All Fields), older (All Fields), adult (MeSH Terms, All Fields), adults (All Fields), disability (All Fields), impairments (All Fields), limitations (All Fields), “physical function” (All Fields), and “physical activity” (All Fields), and exercise (All Fields). In searching for RCTs, the keywords were identical with the exception that we included the term “weight loss” (All fields). In addition, we completed searches for related articles by first or senior authors identified using this initial search strategy and also reviewed the reference lists of these publications.
RESULTS AND DISCUSSION
Our search methods produced 659 prospective epidemiological studies and 177 randomized clinical trials. These groups were refined by removing duplicates, eliminating inappropriate study designs/target populations, and studies that did not include relevant outcomes. Cross-sectional studies, review articles, and studies where BMI was used only as a covariate were also excluded. This process identified 30 prospective epidemiological studies and 6 RCTs; 3 of the RCTs came from a single large scale investigation of older adults with knee osteoarthritis (OA).
Key Findings from the Prospective Epidemiological Evidence
A review of the prospective epidemiological studies in Table 1 uncovered four key issues that are discussed in detail below. To facilitate interpretation of this information, the references in this Table are arranged in the order that they are referenced in the text although they may also appear in later sections.
Table 1.
Longitudinal Observational Studies that Examine Obesity and Disability
| Sample Information | Measures of Obesity and Physical Disability | Main Statistical Analyses | Results | |
|---|---|---|---|---|
| Reference |
Follow-up (FU) Information |
BMI: Body Mass Index (kg/m2) SR: Self Report P: Performance |
Covariates |
OR: Odds Ratio HR: Hazard Ratio CI: Confidence Interval |
| (17) Sharkey et al. (2004) | N = 331 black and white men and women Age: ≥ 60 yrs FU: 1 yr Home delivered meal recipients | Obesity: BMI via measured height and weight. Disability: SR—7 item ADLs P—balance (standing, dynamic), mobility (usual walking speed), strength (repeated chair stands) |
Structural equation modeling | • Greater BMI was directly associated with worse lower extremity performance and indirectly with greater severity of disability. • Better lower extremity performance at baseline was associated with less disability at baseline and 1 yr follow-up. |
| (18) Houston et al. (2005) | N = 9416 African American and white men and women Data: Atherosclerosis Risk in Communities (ARIC) Study Age: 45–64 yrs at baseline FU: 4 visits at 3 yr intervals | Obesity: BMI via measured height and weight Disability: 12 item SR measure including functional limitations (walking a quarter of a mile, walking up 10 steps without resting, stooping, crouching, or kneeling, lifting or carrying something as heavy as 10 pounds, and standing up from an armless straight chair), and ADLs and IADLs. Disability dichotomized. |
Logistic regression stratified by gender and race. Covariates: age, education, smoking status, alcohol consumption, physical activity, and field center |
• BMI, waist circumference, and WHR were positively associated with functional limitations and ADL and IADL impairment approximately 9 y later among African American and white men and women. |
| (19) Lang et al. (2008) | N = 3793 men and women Data: English Longitudinal Study of Aging Age: ≥65 yrs FU: 5 yrs | Obesity: BMI via measured height and weight. Disability: SR—ADLs P—SPPB |
Multinomial logistic models Covariates: year of study entry, age, sex, level of education, wealth, income, smoking status, number of comorbidities, alcohol consumption. |
• Linear association between obesity and physical function. • Participants in higher BMI categories had greater risk of impaired physical function at follow-up. • Compared with men of recommended weight, obese men (BMI = 30.0–34.9) had relative risk ratios of difficulties with ADLs of 1.99 (95% CI = 1.42– 2.78), of measured functional impairment of 1.51 (95% CI = 1.05–2.16). |
| (20) Galanos et al. (1994) | N = 3061 men and women Data: NHANES I (1971-5) & NHEFS (1982-4) Age: ≥65 yrs FU: approximately 10 yrs | Obesity: BMI via measured height (at baseline) and weight Disability/Function: SR—functional status as measured by a 26-item battery. Items from Fries Functional Disability Scale for Arthritis, Rosow-Breslau Scale, Katz ADL Scale. |
Logistic regression. Stratified by sex, 5 yr age group, and BMI. Covariates: race, education, income, marital status, diet, mental status questionnaire, self-rated health, depressive symptoms, alcohol consumption, smoking, comorbidities, vision. |
• The relationship between BMI and function is nonlinear. • Both high and low body mass index continued to be significantly related to functional status when 22 other potential confounders were included in the model. |
| (21) Ferraro & Booth (1999) | N = 2869 men and women Data: Americans’ Changing Lives longitudinal survey Age: 24-96 yrs at baseline FU: 3 yrs | Obesity: BMI via SR height and weight Disability/Functional Illness: SR—impairment (4 category Guttman scale ranging from no functional impairment to currently in bed or chair and/or high difficulty bathing), limitation (5 category Likert scale for how much are your daily activities limited in any way by your health or health related problems), days ill, days in hospital. |
Residualized change analyses, lagged effects models, tobit models | • Relationship between BMI and functional illness is nonlinear. • In change analyses, obesity was associated with more days hospitalized or illness in bed and an increase in functional limitations. |
| (22) Ferraro et al. (2002) | N = 6833 men and women Data: NHANES1 & NHANES Epidemiologic Follow-up Study (NHEFS) Age: 26-74 yrs FU: Approx 10 & 20 yr | Obesity: BMI via SR height and weight or measured height and weight. Disability: Not assessed at baseline. SR—19 items from Stanford Health Assessment Questionnaire Disability Index |
Tobit regression models Covariates: age, sex, race, widowed, live alone, comorbidity, education, income, smoking history |
• Obesity (BMI>30) at baseline or becoming obese during the study was associated with higher levels of upper- and, especially, lower-body disability. • Underweight persons (BMI<18.5) also manifested higher disability in most instances. • In persons who began the study with a BMI of 30 or more and became normal weight, disability was not reduced. |
| (23) Mendes de Leon et al. (2006) | N = 4195 Data: Chicago Health and Aging Project (CHAP) Age: ≥65 yrs Community dwelling FU 2 visits at 3 yr intervals | Obesity: BMI via measured weight and SR height. Disability: SR—ability to walk across a room, walk up/down stairs, walking ½ mile. P—timed 8ft walk |
Generalized estimating equation models Covariates: age (in years, centered at 75), sex, self-reported race, lifetime socioeconomic status, and number of comorbidities. |
• BMI showed a curvilinear association with SR mobility outcomes at baseline. Mobility levels tend to be lower at both higher and lower levels of BMI. • BMI was not associated with change in mobility scores during follow-up. BMI was not related to rate of progression in mobility impairment over time. • Blacks and women reported lower mobility levels at baseline than nonblacks and men. |
| (10) Al Snih et al. (2007) | N = 12725 men and women Data: Established Populations for Epidemiologic Studies of the Elderly (EPESE) Age: ≥65 yrs Entry: reported no ADL difficulty FU: Annual for 7 years | Obesity: BMI via SR height and weight or measured height and weight. Disability: SR—7-item ADL scale (dichotomized: needing no help vs. needing help or unable to perform) |
Cox proportional hazards regression analysis Covariates: age, sex, marital status, smoking status, years of formal education, and selected medical conditions |
• Curvilinear relationship between obesity and disability. • Lowest HR for disability was BMI of 18.5-24.9 and 25-29.9. • Subjects with BMI <18.5 or >30 at baseline, were significantly more likely to experience disability during follow-up. • Disability-free life expectancy most favorable among subjects with BMI 25-29.9. |
| (24) Ebrahim et al. (2000) | N = 5717 men Data: British Regional Heart Study Age: mean 63 yrs (52-73 yrs) FU: 12-14 yrs | Obesity: BMI via measured height and weight at baseline (obesity defined as BMI ≥ 28). Disability: SR—locomotor disability: inability to get outdoors, walk 400 m, climb stairs, maintain balance, bend down, straighten up. |
Logistic regression Covariates: Age, social class, smoking, BMI, physical activity, alcohol use |
• Obesity, and physical inactivity in middle age were strong predictors of locomotor disability in later life independent of the presence of diagnosed disease. |
| (25) Peeters et al. (2004) | N = 1352 Original and 2268 Offspring men and women Data: Framingham Heart Study FU: For disability measures, between 36 and 46 years of follow-up for Original and at 20 years of follow-up for Offspring. Excluded BMI ≤ 18.5 at baseline. | Obesity: BMI via measured height and weight Disability: SR—6 activity items (dressing, grooming/bathing, feeding/eating, transferring, walking on a level surface (50 yds), walking up and down one flight of stairs (five steps)). Dichotomized |
Logistic regression, Life tables Covariates: age, sex, smoking status, comorbidities |
• Obesity at ages 30 to 49y was associated with a 2.21-fold (95% CI, 0.97 to 5.07) increased odds of mobility only-limitations and a 2.01-fold (95% CI, 1.01 to 4.03) increased odds of ADL-limitations after 46 years of follow-up, compared with those of individuals with normal weight, after adjustment for age and sex. • There was no significant difference in the total number of years lived with disability throughout life between those obese or normal weight, due to both higher disability prevalence and higher mortality in the obese population. |
| (26) Jensen & Friedmann (2002) | N = 2634 men and women Age: 71-75 yrs FU: 3-4 yrs Medicare participants in rural Pennsylvania | Obesity: BMI via measured height and weight at baseline and SR of weight, weight change Disability: SR—ADLs, IADLs Dichotomized |
Logistic regression sex stratified analyses Covariates: age, depression, polypharmacy |
• Women (OR = 2.61, 95% CI 1.39–4.95) and men (OR = 3.32, 95% CI 1.29–8.46) exhibited increased risk for any functional decline at BMI ≥ 35. • Women had a higher prevalence of reported functional decline than men at BMI ≥40: 31.4% for women & 14.3% for men. • Weight loss of 10 lbs and weight gain of 20 lbs were also risk factors for any functional decline. |
| (27) Jensen et al. (2006) | N = 12834 men and women Data: Geisinger Rural Aging Study (GRAS) Age:65-97 years Entry: community dwellers, ≥65 years old FU: 3-4 yrs | Obesity: BMI via SR height and weight at baseline Disability: SR—functional limitations (ADLs, IADLs), and housebound status |
Multivariable logistic regression | • Five significant independent predictors of homebound status: BMI >35, >75 years, poor appetite, low income, and any functional limitation. • Obesity is an independent risk factor for reporting homebound status. |
| (28) Al Snih et al. (2003) | N = 245 Mexican American men and women Data: Hispanic EPESE Age: ≥ 65 yrs FU: 2 yrs Functionally disabled at baseline | Obesity: BMI via measured height and weight Disability/Physical Function: SR—ADLs (walking across a small room, bathing, grooming, dressing, eating, transferring, toileting), dichotomized. P—SPPB |
Logistic regression Covariates: age, sex, living arrangements, education, comorbidities, depressive symptoms, medication use. |
• Factors significantly associated with recovery included a BMI ≥30 (OR 3.08, 95% CI 1.17-8.07), younger age (65-74) (OR 2.18, 95% CI 1.08-4.42), higher summary performance measure of lower body function (OR 1.19, 95% CI 1.05-1.34), and fewer depressive symptoms (OR 2.84, 95% CI 1.39-5.78). |
| (29) Bannerman et al. (2002) | N = 1272 men and women Data: Australian Longitudinal Study of Aging Age: >70 yrs FU: 2 yrs | Obesity: BMI via measured height and weight, waist circumference, waist-to-hip ratio Mobility/Physical Function: SR—Rosow-Breslau, Nagi Both dichotomized. |
Logistic regression Covariates: baseline age, gender, marital status, smoking, self-rated health, sum of morbid conditions, physical function, basic activities of daily living, cognition, depressive symptoms. |
• A BMI >85th percentile or >30 or a waist circumference of >102 cm in males and >88 cm in females increased risk of functional and mobility limitations compared to individuals below these cutpoints. |
| (30) McDermott et al. (2006) | N = 389 men and women with peripheral arterial disease Age: ≥55 yrs FU: 48 months | Obesity: BMI via measured height and weight at baseline Disability: SR—leg symptoms, comorbidities, depression, cigarette smoking P—6 minute walk, SPPB |
Mixed-effects regression analysis Covariates: age, sex, race, comorbidities, ABI, leg symptoms, regular exercise, depressive symptoms, and pack-years of smoking |
• Obesity is associated with functional decline in persons with PAD. • Those with BMI >30 had greater annual decline in 6 minute walk, and usual and fast-paced walking speed at 4 yr FU compared to those with a BMI of 20-25. • Participants with weight gain of 5-10lbs who walked 3x wk had less decline in 6 min walk than those with no weight change who did not walk. • PAD people with weight loss of 10+lbs who walked regularly did not have increased rates of functional decline. |
| (31) Koster et al. (2007) | N = 2694 black and white men and women Data: Health Aging and Body Composition (Health ABC) study Age:70-79 yrs Entry: no report of ADL difficulty FU: annual visit for 6.5 yrs | Obesity: BMI via measured height and weight. Disability/Physical Function: SR—Incident persistent mobility limitation was considered to be present when a person reported any difficulty walking one quarter of a mile or climbing 10 steps at 2 consecutive semiannual follow-up assessments. |
Cox proportional hazard regression models Covariates: age, sex, race, study site, marital status, and educational level, comorbidities, baseline function (SPPB), depression, cognitive function |
• Obesity was a strong risk factor for both early and late onset of mobility limitations. • 66% of obese group developed mobility limitation compared to 41% of non-obese. • Low physical activity levels were related to higher incidence of mobility limitation. • Obese persons had a significantly higher risk of mobility limitation compared with non-obese persons, independent of lifestyle factors (HR=1.73; 95% CI, 1.52 to 1.96). |
| (32) Zoico et al. (2007) | N = 145 men and women Age: 66-78 yrs FU: 2 yrs No functional limitations at baseline | Obesity: BMI via measured height and weight DXA Physical Function: SR—ADLs, 3 item Rosaw-Breslau physical function, IADLs. Dichotomized |
Logistic regression models Stratified by sex Covariates: age, number of diseases, osteoarthritis. |
• In women (not men), BMI > 25 was associated with a 3-5 fold increase in the risk of limitations in climbing stairs and lower body performance. • High body fat and high BMI were associated with a greater probability of developing functional limitations. |
| (33) Rejeski et al. (2008) | N = 480 black and white men and women Age: ≥65 yrs Data: observational arthritis study in seniors (OASIS) Chronic knee pain on most days, difficulty with at least 1 mobility-related activity caused by knee pain. FU: 15 and 30 months |
Obesity: BMI via measured height and weight Disability: SR—19 item Pepper Assessment Tool for Disability (ADLs, Mobility, IADLS) |
Hidden Markov Models | • Six distinct disability states were identified. • Trend for older adults to experience greater progression than regression and for obesity to be important in understanding severe states of disability. • Older adults with BMIs >35 had a .90 probability of remaining in this most severe state compared with a probability of .76 for those with BMI≤35. • The probability of remaining in the healthiest functional state declined with increasing BMI: .62 for those <30, .58 for those ≥30 but <35, and .52 for those ≥35. |
| (36) Jenkins (2004) | N = 4087 men and women Data: 2 waves of Asset and Health Dynamics Among the Oldest Old (AHEAD) survey Age: ≥70 yrs in 1993 Community dwellers Entry: free of a strength impairment FU: 3yrs, baseline (1995) and 1998 | Obesity: BMI by SR height and weight Disability: SR—Yes-no-can't do for strength, upper body mobility, lower body mobility, and ADLs All four domains dichotomized. |
Logistic regression Covariates: age, gender, race, marital status, income, education, cigarette smoking, binge drinking, and exercise, comorbidity, disability domains |
• Females were more likely to experience functional impairment in strength, upper and lower body mobility, and ADLs compared to men. • Subjects who were overweight or obese were more likely to experience the onset of functional impairment in strength, lower body mobility, and ADLs. |
| (37) Reynolds et al. (2005) | N = 7132 Data: first 3 waves of AHEAD survey Age: ≥70 yrs Community dwellers FU: 2 visits at ~2 yr intervals | Obesity: BMI via SR height and weight at baseline Disability: SR—Active life defined as having no difficulty performing any functions necessary for day-to-day personal care (ADLs); disabled life defined as having difficulty in one or more of six ADLs. Living in a nursing home at FU. |
Interpolation of Markov Chains (IMaCh) approach, Life tables Covariates: sex |
• Probability of becoming disabled was higher in women compared to men. • No significant difference between obese and non-obese men or women in the probability of transitioning between disability states. • Obese people were more likely to become disabled. • For the obese men, the years lived with disability were longer, and the years lived free of disability were shorter. • Similar to men, non-obese women lived more active years and fewer disabled years than obese women. At age 70, non-obese women averaged 10.5 active years and 4.8 years with disability. For the obese, these numbers were 8.1 and 7.4 years. |
| (41) Janssen et al. (2007) | N = 4968 men and women Data: Cardiovascular Health Study (CHS) Age: ≥65 yrs FU: annually for up to 9 yrs BMI < 20 excluded Participants were grouped into normal-weight (BMI = 20 to 24.9), overweight (BMI = 25 to 29.9), and obese (BMI≥30) categories | Obesity: BMI via measured height and weight Disability: SR—6 item IADLs |
Cox proportional hazards models Covariates: sex, age, race, income, smoking, physical activity |
• The risks for arthritis and physical disability were modestly increased in the overweight group (p < 0.05). |
| (43) Fine et al. (1999) | N=40098 women Data: Nurses’ Health Study Age: 46-72 yrs in 1992 FU: 4 yrs (1992-1996) 3 groups of women: weight gain, weight loss, and weight maintain over the 4 years. | Obesity: BMI via measured height and SR weight Disability: SR—SF-36 |
Ordinary least squares regression Logistic regression Covariates: age, cigarette smoking, levels of physical activity, alcohol consumption, and self reported comorbid conditions |
• Weight gain was associated with decreased physical function and vitality, and increased bodily pain regardless of baseline BMI. • Weight loss was associated with significant improvements in physical function in women with BMI >30, whereas weight loss was associated with decrease in physical functioning among those with a BMI < 25. |
| (44) Launer et al. (1994) | N = 1124 white women Data: National Health and Nutrition Examination Survey (NHANES) I (1971-1987) Age: young-old (mean age 60 yrs at baseline, mean age 65 yrs at follow-up) and old-old (mean age 76 yrs at baseline, mean age 80 yrs at follow-up) Entry: reported no ADL difficulty FU: ~5 yrs | Obesity: BMI via measured height and weight. Disability: Mobility disability was defined as a SR of any difficulty in executing at least one of the following activities: walking 400 m (a quarter of a mile), walking across a room, climbing two steps, doing heavy chores, carrying a full bag of groceries, running errands, bending to the floor, or transferring from a car, bed, bath, chair, or toilet. |
Logistic regression Covariates: age, smoking status, SES (measured as years of education), study time between the 1971 through 1975 and 1986 and 1987 surveys. |
• Women in the high past BMI group (>27 in the young-old and >28.1 in the old-old cohort) had a twofold increase in the risk for disability compared with women in the low past BMI group (≤22.9 in the young-old and ≤23.8 in the old-old cohort) • High current BMI was as strongly related as past BMI to risk of disability in the young-old women; it was not as strong a predictor in old-old women. • In the old-old group only, women who experienced a weight loss of more than 5% had a twofold increase in risk of disability compared with weight-stable women. • Did not assess intentional/unintentional weight loss. |
| (45) Brach et al. (2004) | N = 171 women Age: 50-65 years in 1982 Entry: women, at least 1 year after ceasing menses, abstention from estrogen replacement therapy and no physical limitations that might preclude walking. FU: 14 yr (1982, 1985, 1995, 1999) |
Obesity: BMI via measured height and weight (SR in 1995) Disability: SR—Functional Status Questionnaire (FSQ) P—Gait speed | Hierarchical linear regression Covariates: age, chronic conditions |
• Women who reported >1000 kcal/week of physical activity in 1982, 1985, and 1995 (i.e., always active) and who had a BMI < 25 in 1982, 1985, and 1995 (i.e., never overweight) reported less difficulty with ADL and walked faster than women who were inactive or who were overweight/obese at any of the time points. • Women who were never active and always overweight reported the greatest amount of ADL difficulty and walked at the slowest gait speeds. • Women who were always active but always overweight reported less ADL difficulty than women who were never active and never overweight. |
| (46) Ohmori et al. (2005) | N = 655 men and women Data: Ohsaki National Health Insurance (NHI) beneficiaries’ cohort study FU: 6 yrs Retrospective observation of the deceased who had earlier been enrolled in a prospective cohort study |
Obesity: BMI by SR height and weight Disability: SR—Structured interviews of families of the deceased regarding the disability status of the subjects before death. P—Performance of four ADL tasks (eating, toileting, dressing, and bathing) at each of the following 6 time points before death: 1 week, 1 month, 3 months, 6 months, 1 year, and 3 years. |
Multivariate logistic regression Covariates: sex, age at death, cause of death, baseline physical functioning status, and history of arthritis, osteoporosis, hypertension, or diabetes mellitus. |
• Both higher BMI and shorter time spent walking were significantly associated with an increased risk of long-term disability (more than 6 months). • The odds ratios of long-term disability were 1.3 in those with BMI 20–25 and 2.1 in those with BMI > 25, compared with BMI < 20. The odds ratios of long-term disability were 1.3 in those walking for 0.5– 0.9 h/day and 1.7 in those walking for < 0.5 h/day, compared with those walking for > 1.0 h/day. These relationships were unchanged after stratification for causes of death. |
| (47) Stenholm et al (2007) | N = 840 men and women Data: Mini-Finland Follow-up Study Age: ≥55 yrs at FU Entry: reported no difficulty walking, and not pregnant FU: 22 yrs | Obesity: BMI via measured height and weight. Physical Function: SR--Walking difficulty was assessed using the question: "Are you able to walk about half a kilometer without resting?" (without difficulty, with minor difficulties, with major difficulties, and not at all). P—Timed 6.1m walk |
Multivariate analyses with logistic regression Covariates: age, gender, education, baseline physical activity, smoking status, alcohol use, and physician-diagnosed chronic diseases |
• High BMI predicted walking limitation in both genders. • Physical limitations in middle age predicted later life walking limitations. • For persons in the highest BMI tertile who had two or more physical impairments, the adjusted risk of walking limitation was 4.5 times higher in comparison to normal weight persons with no physical impairments. |
| (48) Koster et al. (2008) | N = 2982 black and white men and women Data: Health ABC study Age:70-79 yrs Entry: no report of ADL difficulty FU: annual visit for 6.5 yrs | Obesity: BMI via measured height and weight. Waist circumference, DXA Disability/Physical Function: SR—Incident persistent mobility limitation was considered to be present when a person reported any difficulty walking one quarter of a mile or climbing 10 steps at 2 consecutive semiannual follow-up assessments. |
Cox proportional hazard regression models Covariates: age, sex, race, study site, marital status, and educational level, comorbidities, baseline function (SPPB), depression, cognitive function |
• White and black men with a high BMI (≥30), high total percentage body fat (≥31.3%), or high waist circumference (≥102 cm) had ~60%, 40%, and 40%, respectively, higher risk of incident mobility limitation than those with low adiposity. • Persons with high adiposity and low physical activity were at particularly high risk of mobility limitation. People with high adiposity who were physically active had an equally high risk of mobility limitation as inactive people with low adiposity. |
| (49) Lang et al. (2007) | N = 8702 US and 1507 UK men and women Data: HRS, ELSA Age: 50-69 yrs at baseline FU: 6 yrs | Obesity: BMI via SR height and weight (HRS) BMI via measured height and weight (ELSA) Functional Limitations: SR—HRS-difficulty walking several blocks, climbing several flights of stairs, and climbing one flight of stairs. P—ELSA-SPPB |
Logistic regression Covariates: Age, sex, smoking, drinking, income, education, baseline functional limitations |
• Overweight and obesity were associated with greater risk of impairment (than being of recommended weight). In all weight categories and both countries, higher levels of physical activity were associated with lower risks of mobility impairment. • Excess bodyweight is a risk factor for impaired physical function in middle-aged and older people. • Physical activity is protective of impaired physical functioning in normal, overweight, and obese individuals. |
| (50) Bruce et al. (2008) | N = 805 men and women Age: 50-72 at enrollment FU: 2-13 yrs | Obesity: BMI via SR height and weight. Disability: SR—Health Assessment Questionnaire Disability Index, (20 items in 8 categories (rising, dressing, eating, walking, hygiene, reaching, gripping, and ability to do usual daily activities) |
Multivariable analysis of covariance, generalized estimating equations Covariates: age, gender, ethnicity, education, number of comorbid conditions, baseline HAQ-DI score. |
• In adjusted analyses, the physically inactive participants had significantly more disability than the active participants regardless of BMI. • Being physically active mitigated development of disability, largely independent of BMI. |
| (51) Yates et al. (2008) | N = 2357 men Data: Physicians Health Study Age = 72 yrs at FU (66-84 yrs) Enrolled 1981-1984 FU ended March 31, 2006. FU: 2 visits in first year, annual thereafter. | Obesity: BMI via SR height and weight. Physical Function: SR—SF-36 |
Chi Squared tests, Cox proportional hazards Covariates: age, BMI, smoking status, alcohol intake, exercise frequency, history of hypertension, diabetes, high cholesterol level, or angina; and randomized treatment assignments (aspirin or beta carotene). |
• Regular exercise was associated with significantly better-and smoking and overweight with significantly worse-late life physical function. |
1. BMI and functional decline in aging: A nonlinear effect
There has been a steady increase in the number of prospective epidemiological studies that have addressed the relationship between body weight and the subsequent risk for physical disability with aging (see Table 1). While there are data suggesting that the relationship between BMI and disability is linear (17-19), a number of studies with data across the entire spectrum of BMI, from underweight (BMI <18 kg/m2) to morbid obesity (BMI ≥40 kg/m2), illustrate that it is curvilinear (10, 20-23). To depict this point, Figure 1 provides data presented by Al Snih et al. (10) for older adults who were free of disability at baseline. Across a 7-year follow-up period, the relationship between BMI and subsequent activities of daily living (ADL) was curvilinear, with the lowest risk at a BMI of 24 kg/m2. The most favorable hazard ratio for disability-free life expectancy was among participants with a BMI between 25.0 kg/m2 to 29.9 kg/m2.
Figure 1.
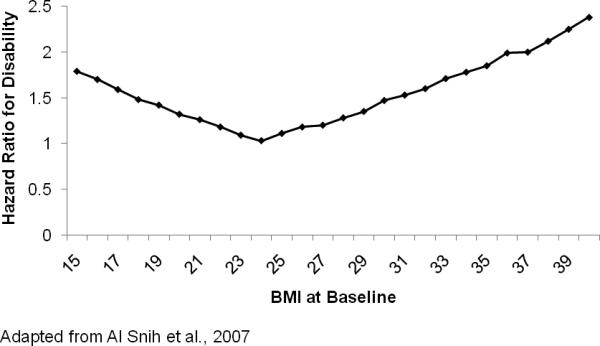
Curvilinear relationship between BMI and risk for physical disability in older adults
2. When is adiposity a concern and is weight loss advisable for older adults?
There are two prospective studies which suggest that the development of obesity in middle-age is a risk factor for the subsequent onset of physical disability later in life (24, 25), suggesting that the topic of physical disability is relevant to prevention efforts with younger, obese populations. A more controversial topic, however, concerns the level of obesity that poses a risk for physical disability among older adults (see Table 1). Jensen and his colleagues argue that it is BMI levels ≥35 kg/m2 among older adults that constitute a risk for functional decline and that being overweight or having class I obesity as an older adult is desirable. This perspective has evolved from 2 independent projects by this group. First, in a 3-4 year follow-up of older adult men and women, class I obesity (BMI = 30-34.9 kg/m2) was not a risk factor for an increased need of assistance in performing either ADLs or IADLs with odds ratios of 0.77 for men and 0.82 for women; however, BMIs ≥35 kg/m2 yielded odds ratios of 3.32 for men and 2.61 for women (26). And second, in a more recent study, Jensen et al. reported that having a BMI ≥35 kg/m2, but not below <35 kg/m2, was a predictor for older men and women aged 65-97y becoming homebound, an indirect index of functional decline (27). These data are consistent with Al Snih et al. (28) who reported that older Mexican-American adults with a BMI ≥30 kg/m2 were 3 times as likely to recover from ADL disability over a 2 year period, suggesting that, to a point, added weight may add resilience during aging. However, there is not agreement on this issue. Data from other investigators suggest that the BMI cutpoint for increasing risk of disability may be lower than 35 kg/m2 (22, 29-31), particularly when outcomes involve tasks that require raising the center of mass, e.g., ascending stairs (32). An interesting hypothesis is that the risk that added weight poses for physical disability may depend upon the demands of the task. Clearly, older adults fail at mobility-related tasks before they lose function in IADLs (33).
Mendes de Leon et al. (23) found that for either self-reported or performance-related measures of mobility, the maximum predicted scores occurred at a higher level of BMI for blacks than whites—see Table 1 & Figure 2 below; also, note the main effects for both race and sex in these data. In general, women experience higher rates of disability with aging than men (26, 34-37), and blacks are at a greater risk for disability than whites (38-40). Whereas clinical research data are unclear as to whether class I obesity constitutes a risk for functional decline in older adults, with few exceptions (41) the evidence indicates that being overweight—having a BMI from 25-29.9 kg/m2—is not a reason for concern (10, 26, 27); in fact, it could confer some protection against functional decline (28). For example, there is considerable evidence supporting the health benefits of adiposity in diseases such as end-stage renal failure, heart failure, COPD and other inflammatory diseases (42).
Figure 2.
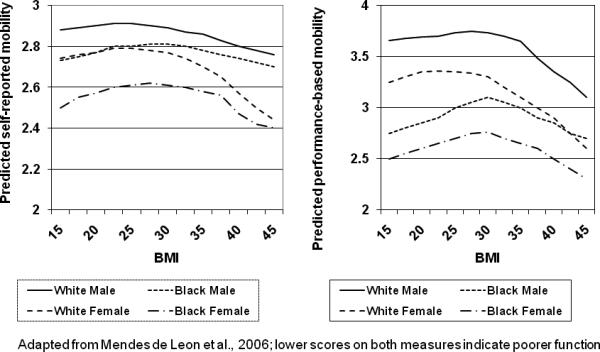
Predicted mobility for typical 75-year old black and non-black people
The evidence from prospective studies on weight loss is conflicting (see Table 1). For example, Fine et al. (43) found that weight loss was associated with significant improvement in physical function among women with a BMI >30 kg/m2, but actually lead to a decline in function for those with a BMI <25 kg/m2. Similarly, Launer et al. (44) and Jensen and Friedmann (26) reported that weight loss had a negative impact on physical function, while Ferraro and colleagues (22) found that weight loss in those with a BMI ≥30 kg/m2 had no change in disability status. However, in these latter studies, it is unclear whether the weight lost was intentional or unintentional and whether the individuals in question were physically active during weight loss. In addition, due to the simultaneous nature of change in weight and study outcomes, these findings have to be treated as cross-sectional.
3. The influence of fitness and physical activity on obesity & functional decline
There is both indirect and direct evidence to suggest that being fit and/or physically active as an obese older adult is beneficial (30,45-51) (see Table 1). Stenholm et al. in a Finish population of predominately middle-aged adults, examined the combined effects of BMI and fitness—grip strength, a performance measure of squatting, and self-reported difficulty running 500 meters—on walking speed over a 6.1 meter course 22 years later (47). The age- and sex-adjusted risk for a walking limitation among those at baseline who were in the highest BMI grouping—a BMI > 26.5 kg/m2 for men and 26.1 kg/m2 for women—and had two or more fitness impairments was 6.4 times that of participants who were neither overweight nor had evidence of a fitness-related impairment. The risk was attenuated some when adjusting for socioeconomic status, comorbidities and lifestyle behaviors, yielding an odds ratio of 4.4. Thus, whereas being overweight does appear to afford protection against disability among older adults, these data reinforce the previously discussed that being overweight at middle-age is a risk factor for disability in late life. Of course, this may well be due to the fact that being overweight at mid-life is a risk factor for obesity as an older adult.
It is also worth underscoring work by McDermott and her colleagues with older PAD patients (30) as well as findings by Brach et al. with older women (45). McDermott et al. reported that regular exercise buffered the negative effects that a ≥5 to <10 lb annual weight gain had on 6-min walking performance; however, exercise did not buffer weight gain when it was in excess of 10 lbs (see Table 1). In a 14-year follow-up of 171 women who had participated in a physical activity trial, Brach and colleagues found that women reporting >1000 kcal of weekly physical activity during assessments taken in 1982, 1985 and 1995, and who had a BMI <25 kg/m2 at each of these time points, reported less difficulty with ADLs and had a faster gait speed than those who were either inactive or who had been overweight or obese at any prior assessment. Women who were never active and were overweight or obese had the greatest disability in both activities of daily living (ADLs) and gait speed. This effect was tempered in overweight and obese women who were physically active.
With respect to obesity and physical activity (see Table 1), Ebrahim and colleagues (24) also reported that both obesity and physical inactivity in middle age were strong predictors of physical disability in later life independent of disease, whereas Lang and colleagues (49) reported that physical activity was protective against physical disability across all categories of BMI. Similarly, Bruce et al. (50) reported that being physically active was protective against disability, largely independent of BMI. Finally, in a very recent study, Koster and her colleagues (48) reported on the joint effects of adiposity and self-reported physical activity on incident mobility disability among older adults in the Health ABC study. In this investigation, the high activity group was represented by the 4th quartile, whereas the low activity group consisted of those in the 1st quartile. The moderate activity group was represented by those in the 2nd and 3rd quartiles. As shown in Table 2, with the exception of black women, high levels of physical activity offset the negative effect that obesity (BMI >30 kg/m2) had on mobility disability. In general, this was not the case for moderate or low levels of physical activity. Finally, although the data by Koster et al. support the benefits of physical activity in aging, another publication by this group suggests that physical activity in combination with other positive health behaviors (non-smoker, good diet quality, and low levels of alcohol use) does not totally eliminate the detrimental effect that obesity has on physical functioning at an advanced age (31). That is, in a fully adjusted model including these 4 lifestyle variables, obesity remained a strong predictor of mobility limitations (hazard ratio = 1.73; CI, 1.52 to 1.96).
Table 2.
Joint Effects of BMI and Physical Activity on the Onset of Mobility Disability*
| BMI ≥30 | Hi PA Hazard Ratio | Medium Physical Activity Hazard Ratio | Low Physical Activity Hazard Ratio |
|---|---|---|---|
| White Men | 1.18 | 2.52 | 2.10 |
| Black Men | 1.66 | 1.77 | 3.18 |
| White Women | 1.62 | 3.30 | 3.51 |
| Black Women | 3.79 | 2.94 | 4.12 |
Adapted from Koster et al., 2008
4. The measurement and conceptualization of physical disability
Measures of physical disability vary in the extent of the demand required of participants. Although ADLs are a common outcome in studies of older adults, we have found that, in community populations, these types of measures often yield truncated data that are insensitive to short-term interventions (52). If effects are forthcoming, it is likely that they will be small. Additionally, although disability in aging is often treated as a “trait”, research suggests that older adults move in and out of disability; suggesting that the concept is a “state” (53,54). In a recent paper (33) (see Table 1), we employed Hidden Markov Models to explore how many states were required to describe transitions in ADL, mobility, and IADL disability among a group of older adults with knee pain. We studied this group across a 30-month period of time repeating assessments at baseline, 15-months, and 30-months. Six states were required to explain the transitions that took place over this period of time. The first state of disability was marked by difficulty in mobility-related tasks, with stair climbing and lifting representing the most challenging tasks that older adults face. Interestingly, this domain was followed by basic ADL disability and then by IADLs. Within the basic ADL domain, a considerable number of participants reported difficulty transferring into and out of a chair while most other ADLs remained intact. Finally, the loss of instrumental activities of daily living (IADLs) describes the most severe state of disability for these older adults. We then examined the role that BMI classification—<30 kg/m2, ≥30 but <35 kg/m2, and ≥35 kg/m2—had on transitional probabilities. Interestingly, older adults who had BMIs ≥35 kg/m2 had a 0.90 probability of remaining in this most severe state as compared to a probability of 0.76 for those with BMIs <35 kg/m2. Also, the probability of remaining in the healthiest functional state, state 1, declined with increasing BMI: 0.62 for those <30 kg/m2, 0.58 for those ≥30 but <35 kg/m2, and 0.52 for those with a BMI ≥35 kg/m2.
Key Findings from Randomized Clinical Trials
The increasing body of prospective evidence establishing a link between obesity and physical disability in older adults has given rise to several RCTs on this topic—see Table 3. Of the studies reviewed, the largest has been the Arthritis, Diet, and Activity Promotion Trial (ADAPT) (55); 3 of the 6 studies cited are associated with ADAPT. This 18 month RCT involved 316 older adults who had documented evidence of knee osteoarthritis (OA) randomized to one of four groups: exercise only (EO), diet only (DO), diet plus exercise (D+E), or a control group (C). The EO and D+E treatment groups experienced significant improvement in 6-min walk time, however, the D+E group had the greatest improvement in Western Ontario and McMaster Universities Osteoarthritis Index (WOMAC) scores and stair climbing performance (55). The D+E result for stair climbing support an earlier point made in regard to the prospective evidence and suggests that the benefits of weight loss on physical disability might be especially important on tasks that require raising the center of gravity.
Table 3.
Randomized Clinical Trials of Weight Loss and Physical Disability in Obese, Older Adults
| References 4 Unique Studies | Participants/ Study Duration | Interventions1 | Measures of Disability2 | Results |
|---|---|---|---|---|
| (55) Messier et al. (2004) ADAPT Trial |
• N=316 • BMI 34.5 ±5.6 • Age = 68 ±6.3 • Knee OA 18-Month RCT |
• Control (Health Education): C • Weight Loss (Diet Only): WL • Exercise (Aerobic & Low Int. RT): E Weight Loss + Exercise: WL+E |
SR: WOMAC(LD) P: 6 min Walk(HD) Stair Climb(HD) |
• The WL+E group had higher WOMAC scores, and improved 6-min walk time and stair climbing time relative to C. • E had improvement in 6-min walk time relative to C |
| (56) Rejeski et al. (2002) ADAPT Trial |
Same as #1 | Same as #1 | SR: Composite Physical Function Scale from SF-36(LD) | • The WL+E group had the most positive effect on SF-36 physical health index relative to C. • E and WL+E had higher body satisfaction than C. • WL, E, and WL+E had high appearance satisfaction than C. |
| (57) Focht et al. (2005) ADAPT Trial |
Same as #1 | Same as #1 | SR: Confidence in ability to walk (HD) and stair climb(HD) P: 6 min Walk(HD) Stair Climb(HD) |
• The WL+E group had improvement in self-efficacy (SE) for stair climbing and walking relative to C. • SE and pain partially mediated benefits in WL+E on stair climb time. |
| (58) Miller et al. (2006) | • N = 87 • BMI 34.3 ±3.9 • Age = 69.3 ±5.9 • Knee OA • 6-Month RCT |
• Control (Health Education): C • Weight Loss (Diet) + Exercise (Aerobic & Low Int. RT): WL+E |
SR: WOMAC(LD) P: GXT (HD) 6 min Walk(HD) Stair climb(HD) |
• WL+E had improved WOMAC scores, 6-min walk and stair climb time compared to C. • Amount of WL was related to gains in function. |
| (59)Villareal et al. (2006) | • N = 27 • BMI 38.5 ±5.3 for Treatment; 39.0 ±5.0 for Control • Age = 71.1 ±5.1 for Treatment; 69.4 ±4.6 for Control • Mild to Moderately Frail • 26-Week RCT |
• No Treatment Control: C • Weight Loss (Diet) + Exercise (30 min Aerobic + 30 min of RT + 15 min Balance training): WL + E |
SR: ADL difficulty via Functional Status Questionnaire: FSQ (LD), SF-36 (LD) P: PPT(LD) GXT for VO2 peak(HD) |
• In the WL+E group fat mass decreased with change in fat-free mass. • The WL+E group had improved PPT scores, >VO2 peak, >strength and higher FSQ scores than C. |
| (60)Bouchard et al. (2009) | • N = 48 • BMI 31.6 ±2.5 • Age = 62.6 ±3.9 • Postmenopausal Women • Healthy • 3-Month RCT |
•No Treatment Control: C • Weight Loss (diet only): WL • RT (high int.; 3X wk) • Weight Loss + RT |
P: A summary scores of both upper (3 tasks) and lower (8 tasks) extremity tests. | • The summary score for function improved in the RT group relative to C. • CR+RT was the only group to improve on 6-min walk time over 3-months. |
High Int. = High Intensity; RT = Resistance Training
SR= self-report; P = performance; HD = high demand; LD = low demand
Rejeski and colleagues also found that the D+E group in ADAPT produced the greatest change on the physical health index of the SF-36 (56), whereas Focht et al. (57) found that the D+E group experienced greater improvement in self-efficacy for stair climb and walking than any other group; moreover, both changes in self-efficacy and changes in pain were found to be partial mediators of changes in stair climb performance. Because participants who at baseline had higher self-efficacy and lower pain experienced the most improvement in stair climbing performance at follow-up, it would seem judicious to consider interventions that address both the enhancement of self-efficacy and pain management when promoting weight loss in older adults with knee OA.
Three other small RCTs have replicated the benefits of a weight loss plus exercise intervention (D+E) on the functional health of obese older adults (58,59). In the first study, the exercise involved a combination of aerobic and resistance training (RT). Miller et al. (58) conducted a 6-month study that was similar to ADAPT with the exception that the weight loss goal was much more ambitious—10% as opposed to ~5%. The second 6-month study by Villareal et al. (59) compared D+E to a control group, but employed physically frail, obese older adults and high intensity RT (see Table 3). These two investigations found that D+E produced significant improvements in both self-reported and performance based measures of physical disability. The third study by Bouchard and collaborators (60) examined the independent and combined effects of RT and caloric restriction on the physical capacity of older, healthy women; however, their findings are difficult to interpret due to an inadequately powered study design.
Finally, in this early phase of weight loss studies involving older adults, it is important to consider the findings reported from 2 studies that have examined impairments, rather than physical disability, as study outcomes. Both Dunstan et al. (61) and Frimel et al. (62) have conducted 6-month investigations of high intensity RT in combination with dietary therapy on the strength and lean body mass of older adults. The study by Dunstan and colleagues used patients with type-2 diabetes and a comparison group that involved flexibility training combined with dietary weight loss, whereas Frimel et al. employed older adults who had mild to moderate frailty and a weight loss only comparison group. Dunstan et al. found that those in RT had larger reductions in HbA1c and greater increases in strength than those in the flexibility plus weight loss arm. In addition, lean body mass increased in the RT plus weight loss arm, whereas it decreased in the comparison group. Frimel et al. also found that the addition of RT to dietary therapy resulted in increases in strength relative to the dietary only arm and that RT attenuated losses in fat free mass when compared to dietary weight loss only. Furthermore, they found a significant relationship between the volume of RT performed by participants and the amount of fat free mass in both the upper and lower extremities.
It is worth noting that of the above studies (58-61), the only one to report an increase of fat free mass with weight loss was the investigation by Dunstan and his colleagues. A factor that may account for this result is that their daily weight training regimen was the most intense and lengthy of all 4 studies; participants exercised with weights for 45 min each session and did so at an intensity of ~80% of each repetition maximum.
GENERAL SUMMARY
Physical disability is a key indicator of morbidity and central to quality of life in aging. A substantial body of evidence from prospective investigations has confirmed that elevated BMI is a risk factor for physical disability among older adults. However, when the range of BMI has been sufficiently broad, it is clear that the relationship between BMI and physical disability is not linear. That is to say, being underweight poses as great a risk for physical disability as being excessively obese. In addition, a growing body of literature suggests that being overweight—having a BMI from 25-29.9 kg/m2—is protective, while the risk for physical disability from class I obesity remains controversial. Clearly, this is an area of research that has important clinical relevance and warrants immediate attention. Moreover, from a public perspective, two subgroups of older adults that deserve special consideration are blacks and women.
Another issue that has evolved from prospective epidemiological research is the important role that physical activity appears to have on tempering the deleterious effects that obesity and short-term weight gain (<10 lbs) have on physical disability. Although it is well recognized that physical activity is an important element of weight loss due to energy expenditure, rarely do clinical scientists espouse the protective role that increased physical activity has in counteracting the negative effects that increasing BMI has on mobility, ADLs, and IADLs. In large part, this lack of recognition is most likely due to the fact that very little attention has been given to weight loss interventions to treat physical disability in older adults.
Finally, although there are a limited number of randomized clinical trials, it would seem to make little clinical sense to promote weight loss in older adults without the inclusion of physical activity. Having said this, it is also very clear that the combined effect of dieting and exercise for obese older adults on physical disability is better than exercise alone. In the future, far more attention should be given to the role of RT within the context of weight loss for older adults. Also, because joint pain is common in aging and physical activity in aging is often undermined by aging stereotypes, weight loss for older adults should be embedded within a conceptual model of behavior change that directly addresses these barriers.
ACKNOWLEDGMENTS
This paper was presented as part of a symposium at the Annual Meeting of The Obesity Society, Phoenix, AZ, 2008. The authors are indebted to Dr. Edward Gregg for his valuable critique and contributions to this paper. Support for this study was provided by a (a) National Heart, Lung, and Blood Institute grant HL076441-01A1, (c) National Institutes for Aging P30 AG021332, and (d) General Clinical Research Center grant, M01-RR00211.
Support for this study was provided by a (a) National Heart, Lung, and Blood Institute grant HL076441-01A1, (c) National Institutes for Aging P30 AG021332, and (d) General Clinical Research Center grant, M01-RR00211.
Footnotes
Disclosure: The authors declare no conflict of interest.
DISCLOSURE
The authors declare no conflict of interest.
Contributor Information
W. Jack Rejeski, Departments of Health and Exercise Science and Geriatric Medicine Wake Forest University.
Anthony P. Marsh, Department of Health and Exercise Science Wake Forest University
Elizabeth Chmelo, Department of Health and Exercise Science Wake Forest University.
Jared J. Rejeski, Wake Forest University School of Medicine Wake Forest University
REFERENCES
- 1.Visscher TL, Seidell JC. The public health impact of obesity. Annu Rev Public Health. 2001;22:355–375. doi: 10.1146/annurev.publhealth.22.1.355. [DOI] [PubMed] [Google Scholar]
- 2.Hajjar I, Kotchen JM, Kotchen TA. Hypertension: trends in prevalence, incidence, and control. Annu Rev Public Health. 2006;27:465–490. doi: 10.1146/annurev.publhealth.27.021405.102132. [DOI] [PubMed] [Google Scholar]
- 3.Centers for Disease Control and Prevention Crude and age-adjusted prevalence of diagnosed diabetes per 100 population, United States, 1980-2005. 2008.
- 4.Villareal DT, Apovian CM, Kushner RF, Klein S. Obesity in older adults: Technical review and position statement of the American Society for Nutrition and NAASO, The Obesity Society. Obes Res. 2005;13:1849–1863. doi: 10.1038/oby.2005.228. [DOI] [PubMed] [Google Scholar]
- 5.Sturm R, Ringel JS, Andreyeva T. Increasing obesity rates and disability trends. Health Aff (Millwood ) 2004;23:199–205. doi: 10.1377/hlthaff.23.2.199. [DOI] [PubMed] [Google Scholar]
- 6.Alley DE, Chang VW. The changing relationship of obesity and disability, 1988-2004. JAMA. 2007;298:2020–2027. doi: 10.1001/jama.298.17.2020. [DOI] [PubMed] [Google Scholar]
- 7.Gregg EW, Guralnik JM. Is disability obesity's price of longevity? JAMA. 2007;298:2066–2077. doi: 10.1001/jama.298.17.2066. [DOI] [PubMed] [Google Scholar]
- 8.Rejeski WJ, Lang W, Neiberg RH, Van Dorsten B, Foster GD, Maciejewski ML, Rubin R, Williamson DF. Correlates of health-related quality of life in overweight and obese adults with type 2 diabetes. Obesity. 2006;14:870–883. doi: 10.1038/oby.2006.101. [DOI] [PubMed] [Google Scholar]
- 9.Fries JF. Measuring and monitoring success in compressing morbidity. Ann Intern Med. 2003;139(5 Pt 2):455–459. doi: 10.7326/0003-4819-139-5_part_2-200309021-00015. [DOI] [PubMed] [Google Scholar]
- 10.Al Snih S, Ottenbacher KJ, Markides KS, Kuo YF, Eschbach K, Goodwin JS. The effect of obesity on disability vs mortality in older Americans. Arch Intern Med. 2007;167:774–780. doi: 10.1001/archinte.167.8.774. [DOI] [PubMed] [Google Scholar]
- 11.Pischon T, Boeing H, Hoffmann K, Bergmann M, Schulze MB, Overvad K, van der Schouw YT, Spencer E, Moons KG, Tjonneland A, Halkjaer J, Jensen MK, Stegger J, Clavel-Chapelon F, Boutron-Ruault MC, Chajes V, Linseisen J, Kaaks R, Trichopoulou A, Trichopoulos D, Bamia C, Sieri S, Palli D, Tumino R, Vineis P, Panico S, Peeters PH, May AM, Bueno-de-Mesquita HB, van Duijnhoven FJ, Hallmans G, Weinehall L, Manjer J, Hedblad B, Lund E, Agudo A, Arriola L, Barricarte A, Navarro C, Martinez C, Quiros JR, Key T, Bingham S, Khaw KT, Boffetta P, Jenab M, Ferrari P, Riboli E. General and abdominal adiposity and risk of death in Europe. N Engl J Med. 2008;359:2105–2120. doi: 10.1056/NEJMoa0801891. [DOI] [PubMed] [Google Scholar]
- 12.Diabetes Prevention Program Research Group Reduction in the incidence of type 2 diabetes with lifestyle intervention or metformin. N Engl J Med. 2002;346:393–403. doi: 10.1056/NEJMoa012512. [DOI] [PMC free article] [PubMed] [Google Scholar]
- 13.The Look AHEAD Research Group Look AHEAD (Action for Health in Diabetes): design and methods for a clinical trial of weight loss for the prevention of cardiovascular disease in type 2 diabetes. Controlled Clin Trials. 2003;24:610–628. doi: 10.1016/s0197-2456(03)00064-3. [DOI] [PubMed] [Google Scholar]
- 14.Nagi S. Sussman, M. B. Sociology and rehabilitation. American Sociological Association; Washington, D.C.: 1965. Some conceptual issues in disability and rehabilitation. pp. 100–113. [Google Scholar]
- 15.World Health Organization . The international classification of impairments, disabilities, and handicaps--a manual relating to the consequences of disease. World Health Organization; Geneva: 1980. [Google Scholar]
- 16.World Health Organization International classification of functioning, disability, and health (ICF) 2002. [DOI] [PubMed]
- 17.Sharkey JR, Branch LG, Giuliani C, Zohoori M, Haines PS. Nutrient intake and BMI as predictors of severity of ADL disability over 1 year in homebound elders. J Nutr Health Aging. 2004;8:131–139. [PubMed] [Google Scholar]
- 18.Houston DK, Stevens J, Cai J. Abdominal fat distribution and functional limitations and disability in a biracial cohort: the Atherosclerosis Risk in Communities Study. Int J Obes (Lond) 2005;29:1457–1463. doi: 10.1038/sj.ijo.0803043. [DOI] [PubMed] [Google Scholar]
- 19.Lang IA, Llewellyn DJ, Alexander K, Melzer D. Obesity, Physical Function, and Mortality in Older Adults. J Am Geriatr Soc. 2008;56:1474–1478. doi: 10.1111/j.1532-5415.2008.01813.x. [DOI] [PubMed] [Google Scholar]
- 20.Galanos AN, Pieper CF, Cornoni-Huntley JC, Bales CW, Fillenbaum GG. Nutrition and function: is there a relationship between body mass index and the functional capabilities of community-dwelling elderly? J Am Geriatr Soc. 1994;42:368–373. doi: 10.1111/j.1532-5415.1994.tb07483.x. [DOI] [PubMed] [Google Scholar]
- 21.Ferraro KF, Booth TL. Age, body mass index, and functional illness. J Gerontol B Psychol Sci Soc Sci. 1999;54:S339–S348. doi: 10.1093/geronb/54b.6.s339. [DOI] [PubMed] [Google Scholar]
- 22.Ferraro KF, Su YP, Gretebeck RJ, Black DR, Badylak SF. Body mass index and disability in adulthood: a 20-year panel study. Am J Public Health. 2002;92:834–840. doi: 10.2105/ajph.92.5.834. [DOI] [PMC free article] [PubMed] [Google Scholar]
- 23.Mendes de Leon CF, Hansberry MR, Bienias JL, Morris MC, Evans DA. Relative weight and mobility: a longitudinal study in a biracial population of older adults. Ann Epidemiol. 2006;16:770–766. doi: 10.1016/j.annepidem.2006.05.002. [DOI] [PubMed] [Google Scholar]
- 24.Ebrahim S, Wannamethee SG, Whincup P, Walker M, Shaper AG. Locomotor disability in a cohort of British men: the impact of lifestyle and disease. Int J Epidemiol. 2000;29:478–486. [PubMed] [Google Scholar]
- 25.Peeters A, Bonneux L, Nusselder WJ, De Laet C, Barendregt JJ. Adult obesity and the burden of disability throughout life. Obes Res. 2004;12:1145–1151. doi: 10.1038/oby.2004.143. [DOI] [PubMed] [Google Scholar]
- 26.Jensen GL, Friedmann JM. Obesity is associated with functional decline in community-dwelling rural older persons. J Am Geriatr Soc. 2002;50:918–923. doi: 10.1046/j.1532-5415.2002.50220.x. [DOI] [PubMed] [Google Scholar]
- 27.Jensen GL, Silver HJ, Roy MA, Callahan E, Still C, Dupont W. Obesity is a risk factor for reporting homebound status among community-dwelling older persons. Obesity (Silver Spring) 2006;14:509–517. doi: 10.1038/oby.2006.66. [DOI] [PubMed] [Google Scholar]
- 28.Al Snih S, Markides KS, Ostir GV, Ray L, Goodwin JS. Predictors of recovery in activities of daily living among disabled older Mexican Americans. Aging Clin Exp Res. 2003;15:315–320. doi: 10.1007/BF03324516. [DOI] [PubMed] [Google Scholar]
- 29.Bannerman E, Miller MD, Daniels LA, Cobiac L, Giles LC, Whitehead C, Andrews GR, Crotty M. Anthropometric indices predict physical function and mobility in older Australians: the Australian Longitudinal Study of Ageing. Public Health Nutr. 2002;5:655–662. doi: 10.1079/PHN2002336. [DOI] [PubMed] [Google Scholar]
- 30.McDermott MM, Criqui MH, Ferrucci L, Guralnik JM, Tian L, Liu K, Greenland P, Tan J, Schneider JR, Clark E, Pearce WH. Obesity, weight change, and functional decline in peripheral arterial disease. J Vasc Surg. 2006;43:1198–1204. doi: 10.1016/j.jvs.2006.02.036. [DOI] [PMC free article] [PubMed] [Google Scholar]
- 31.Koster A, Penninx BW, Newman AB, Visser M, van Gool CH, Harris TB, van Eijk JT, Kempen GI, Brach JS, Simonsick EM, Houston DK, Tylavsky FA, Rubin SM, Kritchevsky SB. Lifestyle factors and incident mobility limitation in obese and non-obese older adults. Obesity (Silver Spring) 2007;15:3122–3132. doi: 10.1038/oby.2007.372. [DOI] [PubMed] [Google Scholar]
- 32.Zoico E, Di Francesco V, Mazzali G, Zivelonghi A, Volpato S, Bortolani A, Dioli A, Coin A, Bosello O, Zamboni M. High baseline values of fat mass, independently of appendicular skeletal mass, predict 2-year onset of disability in elderly subjects at the high end of the functional spectrum. Aging Clin Exp Res. 2007;19:154–9. doi: 10.1007/BF03324682. [DOI] [PubMed] [Google Scholar]
- 33.Rejeski WJ, Ip EH, Marsh AP, Zhang Q, Miller ME. Obesity influences transitional states of disability in older adults with knee pain. Arch Phys Med Rehabil. 2008;89:2102–2107. doi: 10.1016/j.apmr.2008.05.013. [DOI] [PMC free article] [PubMed] [Google Scholar]
- 34.Wray LA, Blaum CS. Explaining the role of sex on disability: a population-based study. Gerontologist. 2001;41:499–510. doi: 10.1093/geront/41.4.499. [DOI] [PubMed] [Google Scholar]
- 35.Friedmann JM, Elasy T, Jensen GL. The relationship between body mass index and self-reported functional limitation among older adults: a gender difference. J Am Geriatr Soc. 2001;49:398–403. doi: 10.1046/j.1532-5415.2001.49082.x. [DOI] [PubMed] [Google Scholar]
- 36.Jenkins KR. Obesity's effects on the onset of functional impairment among older adults. Gerontologist. 2004;44(2):206–216. doi: 10.1093/geront/44.2.206. [DOI] [PubMed] [Google Scholar]
- 37.Reynolds SL, Saito Y, Crimmins EM. The impact of obesity on active life expectancy in older American men and women. Gerontologist. 2005;45:438–444. doi: 10.1093/geront/45.4.438. [DOI] [PubMed] [Google Scholar]
- 38.Clark DO. US trends in disability and institutionalization among older blacks and whites. Am J Pub Health. 1997;87:438–440. doi: 10.2105/ajph.87.3.438. [DOI] [PMC free article] [PubMed] [Google Scholar]
- 39.Kelley-Moore JA, Ferraro KF. The Black/White disability gap: Persistent inequality in later life? J Geontol B Psychol Sci Soc Sci. 2004;59:S34–S43. doi: 10.1093/geronb/59.1.s34. [DOI] [PubMed] [Google Scholar]
- 40.Mendes de Leon CF, Barnes LL, Bienias JL, Skarupski KA, Evans DA. Racial disparities in disability: recent evidence from self-reported and performance-based disability measures in a population-based study of older adults. J Gerontol B Psychol Sci Soc Sci. 2005;60:S263–S271. doi: 10.1093/geronb/60.5.s263. [DOI] [PubMed] [Google Scholar]
- 41.Janssen I. Morbidity and mortality risk associated with an overweight BMI in older men and women. Obesity (Silver Spring) 2007;15:1827–40. doi: 10.1038/oby.2007.217. [DOI] [PubMed] [Google Scholar]
- 42.Bales CW, Buhr G. Is obesity bad for older persons? A systematic review of the pros and cons of weight reduction in later life. J Am Med Dir Assoc. 2008;9:302–12. doi: 10.1016/j.jamda.2008.01.006. [DOI] [PubMed] [Google Scholar]
- 43.Fine JT, Colditz GA, Coakley EH, Moseley G, Manson JE, Willett WC, Kawachi I. A prospective study of weight change and health-related quality of life in women. JAMA. 1999;282:2136–42. doi: 10.1001/jama.282.22.2136. [DOI] [PubMed] [Google Scholar]
- 44.Launer LJ, Harris T, Rumpel C, Madans J. Body mass index, weight change, and risk of mobility disability in middle-aged and older women. The epidemiologic follow-up study of NHANES I. JAMA. 1994;271:1093–1098. [PubMed] [Google Scholar]
- 45.Brach JS, VanSwearingen JM, FitzGerald SJ, Storti KL, Kriska AM. The relationship among physical activity, obesity, and physical function in community-dwelling older women. Prev Med. 2004;39:74–80. doi: 10.1016/j.ypmed.2004.02.044. [DOI] [PubMed] [Google Scholar]
- 46.Ohmori K, Kuriyama S, Hozawa A, Ohkubo T, Tsubono Y, Tsuji I. Modifiable factors for the length of life with disability before death: mortality retrospective study in Japan. Gerontology. 2005;51:186–191. doi: 10.1159/000083992. [DOI] [PubMed] [Google Scholar]
- 47.Stenholm S, Sainio P, Rantanen T, Koskinen S, Jula A, Heliovaara M, Aromaa A. High body mass index and physical impairments as predictors of walking limitation 22 years later in adult Finns. Int J Obes. 2007;62:859–865. doi: 10.1093/gerona/62.8.859. [DOI] [PubMed] [Google Scholar]
- 48.Koster A, Patel KV, Visser M, van Eijk JTM, Kanaya AM, de Rekeneire N, Newman AB, Tylavsky FA, Kritchevsky SB, Harris TB. Joint effects of adiposity and physical activity on incident mobility limitation in older adults. J Am Geriatr Soc. 2008;56:636–643. doi: 10.1111/j.1532-5415.2007.01632.x. [DOI] [PubMed] [Google Scholar]
- 49.Lang IA, Guralnik JM, Melzer D. Physical activity in middle-aged adults reduces risks of functional impairment independent of its effect on weight. J Am Geriatr Soc. 2007;55:1836–1841. doi: 10.1111/j.1532-5415.2007.01426.x. [DOI] [PubMed] [Google Scholar]
- 50.Bruce B, Fries JF, Hubert H. Regular vigorous physical activity and disability development in healthy overweight and normal-weight seniors: a 13-year study. Am J Public Health. 2008;98:1294–1299. doi: 10.2105/AJPH.2007.119909. [DOI] [PMC free article] [PubMed] [Google Scholar]
- 51.Yates LB, Djousse L, Kurth T, Buring JE, Gaziano JM. Exceptional longevity in men: modifiable factors associated with survival and function to age 90 years. Arch Intern Med. 2008;168:284–290. doi: 10.1001/archinternmed.2007.77. [DOI] [PubMed] [Google Scholar]
- 52.Pahor M, Blair SN, Espeland M, Fielding R for the LIFE-P Investigators Effects of a physical activity intervention on measures of physical performance: Results of the lifestyle interventions and independence for Elders Pilot (LIFE-P) study. J Gerontol A Biol Sci Med Sci. 2006;61:1157–1165. doi: 10.1093/gerona/61.11.1157. [DOI] [PubMed] [Google Scholar]
- 53.Verbrugge LM, Reoma JM, Gruber-Baldini AL. Short-term dynamics of disability and well-being. J Health Soc Behav. 1994;35(2):97–117. [PubMed] [Google Scholar]
- 54.Gill TM, Gahbauer EA, Allore HG, Han L. Transitions between frailty states among community-living older persons. Arch Intern Med. 2006;166:418–423. doi: 10.1001/archinte.166.4.418. [DOI] [PubMed] [Google Scholar]
- 55.Messier SP, Williamson JD, Miller GD, Morgan T, Rejeski WJ, Sevick MA, Loeser RF, Ettinger W, Pahor M. Exercise and dietary weight loss in overweight and obese older adults with knee osteoarthritis: The arthritis, diet and activity promotion trial (ADAPT). Arthritis Rheum. 2004;50:1501–1510. doi: 10.1002/art.20256. [DOI] [PubMed] [Google Scholar]
- 56.Rejeski WJ, Focht BC, Messier SP, Morgan T, Pahor M, Penninx B. Obese, older adults with knee osteoarthritis: Weight loss, exercise, and quality of life. Health Psychol. 2002;21:419–426. doi: 10.1037//0278-6133.21.5.419. [DOI] [PubMed] [Google Scholar]
- 57.Focht BC, Rejeski WJ, Ambrosius WT, Katula JA, Messier SP. Exercise, self-efficacy, and mobility performance in overweight and obese older adults with knee osteoarthritis. Arthritis Care Res. 2005;53:659–665. doi: 10.1002/art.21466. [DOI] [PubMed] [Google Scholar]
- 58.Miller GD, Nicklas BJ, Davis C, Loeser RF, Lenchik L, Messier SP. Intensive weight loss program improves physical function in older obese adults with knee osteoarthritis. Obesity. 2006;14:1219–1230. doi: 10.1038/oby.2006.139. [DOI] [PubMed] [Google Scholar]
- 59.Villareal DT, Banks M, Sinacore DR, Siener C, Klein S. Effect of weight loss and exercise on frailty in obese older adults. Arch Intern Med. 2006;166:860–866. doi: 10.1001/archinte.166.8.860. [DOI] [PubMed] [Google Scholar]
- 60.Bouchard D, Soucy L, Senechal M, Dionne I, Brochu M. Impact of resistance training with or without caloric restriction on physical capacity in obese older women. J North Amer Menopause Soc. 2008;16:1–7. doi: 10.1097/gme.0b013e31817dacf7. [DOI] [PubMed] [Google Scholar]
- 61.Dunstan DW, Daly RM, Owen N, Jolley D, De Courten M, Shaw J, Zimmet P. High-intensity resistance training improves glycemic control in older patients with type 2 diabetes. Diabetes Care. 2002;25:1729–1736. doi: 10.2337/diacare.25.10.1729. [DOI] [PubMed] [Google Scholar]
- 62.Frimel TN, Sinacore DR, Villareal DT. Exercise attenuates the weight-loss-induced reduction in muscle mass in frail obese older adults. Med Sci Sports Exer. 2008;40:1213–1219. doi: 10.1249/MSS.0b013e31816a85ce. [DOI] [PMC free article] [PubMed] [Google Scholar]