

Abstract
The optofluidic microscope (OFM) is a lensless, low-cost and highly compact on-chip device that can enable high-resolution microscopy imaging. The OFM performs imaging by flowing/scanning the target objects across a slanted hole array; by measuring the time-varying light transmission changes through the holes, we can then render images of the target objects at a resolution that is comparable to the holes' size. This paper reports the adaptation of the OFM for imaging Giardia lamblia trophozoites and cysts, a disease-causing parasite species that is commonly found in poor-quality water sources. We also describe our study of the impact of pressure-based flow and DC electrokinetic-based flow in controlling the flow motion of Giardia cysts – rotation-free translation of the parasite is important for good OFM image acquisition. Finally, we report the successful microscopy imaging of both Giardia trophozoites and cysts with an OFM that has a focal plane resolution of 0.8 microns.
Keywords: Optofluidic microscopy, Microfluidics, On-chip imaging, Water quality monitoring, DC electrokinetics
1. Introduction
The optical microscope is an important analytical tool in biomedicine and bioscience. Optofluidic microscopy (OFM) [Heng et al. 2006a] is a new type of microscopy imaging method which integrates microfluidic technology and aperture-based optics technique to conduct high resolution, low cost microscopic imaging on a chip. This method does not require the use of bulk lenses and other optical elements, which are typically found in a conventional optical microscope, and instead perform imaging by translating/scanning the target biological specimen over an array of small holes that was patterned onto the metal-coated floor of a microfluidic channel.
We recently developed a complete on-chip OFM system that was tailored to image Caenorhabditis elegans. Using the acquired images, we further demonstrated that the OFM can be used to identify different C. elegans phenotypes autonomously. Additionally, we implemented a DC electrokinetic-driven OFM system that was suited for imaging spheroid objects, such as cells and pollen spores [Cui et al. 2008].
Giardia lamblia is a water-borne parasite present in untreated or improperly treated water sources. When contracted by humans, this flagellated protozoan can colonize and reproduce in the small intestine, causing giardiasis. Symptoms include diarrhea, bloating, nausea, abdominal cramping and malaise. Severe weight loss is often a consequence. Proper treatment requires an appropriate antibiotic for days to relieve the symptoms and cure the disease. Several microfluidic-based filtering techniques have been developed to effectively trap and concentrate microbial cells [Zhu et al. 2004; Lay et al. 2008]. We believe that the result of this initial demonstration study suggests that the OFM can potentially function as a secondary identification tool if the technology is integrated with filtering techniques. The OFM system can also be used as a point-of-care diagnostic tool for giardiasis.
In this paper, we report our recent adaptation of the OFM for Giardia lamblia trophozoites and cysts. This study provides us an opportunity to demonstrate that the optofluidic microscope's application range extends beyond potential bioscience and biomedical research, and that the technology can potentially be useful as an autonomous, low-cost and highly-compact method for environmental and food/water supply monitoring and diagnostics [Lay and Liu 2007; Zhang et al. 2006; Sakamoto et al. 2007; Yager et al. 2006; Chin et al. 2007].
This paper is divided into the following sections. In the next section, we briefly explain the OFM imaging principle and describe the design modifications required to adapt our OFM systems for Giardia lamblia imaging. The required changes are few and minor as the primary OFM design is sufficiently robust and flexible. In the third section, we report on our findings regarding the flow control of Giardia lamblia trophozoites and cysts under pressure-driven and DC electrokinetic driven flow. The extent of rotation under flow motion is of particular interest to us as it directly impacts on the OFM's ability to perform imaging. We report the results of a detailed sub-study into this issue. This sub-study is of broad relevance as it can inform us on our design choices regarding our future OFM systems that are tailored for other target types. Next, we present OFM images of Giardia lamblia trophozoites and cysts and discuss the features that we can discern in the images. Finally, we conclude by summarizing our findings.
2. Design and fabrication
2.1 On-chip optofluidic microscope design
One simple way to implement on-chip imaging is through the use of direct light projection imaging [Lange et al. 2005; Ozcan and Demirci 2008; Seo et al. 2009]. This strategy works by transmitting light through a target sample and detecting the resulting shadow with an underlying sensor grid. In this situation, the best raw image resolution achievable is limited by the size of the sensor pixels, which is typically larger than 2.2 μm. Aliasing artifact can also degrade the raw image quality. At present, this imaging approach has inferior resolution when compared with conventional microscopy methods. Current efforts in this research direction are generally focused on eliciting morphological information indirectly from the acquired images.
The OFM imaging approach circumvents the sensor-pixel based resolution limitation to perform on-chip microscopy imaging by employing an array of submicron apertures to scan the target sample. In brief, an OFM device consists of a sensor chip that is coated an opaque metal layer. The geometry of an OFM device is illustrated in Figure 1(a). An array of submicron apertures is patterned onto the metal layer in such a way that each aperture transmits light to a single sensor pixel – this implies that the aperture-to-aperture separation is equal to the sensor pixel length. A microfluidic channel is emplaced on top of the aperture array such that the array spans the channel width diagonally. The entire device is then illuminated from the top. As a target sample flows through the microfluidic channel, it interrupts light transmission through the apertures. As such, the time varying transmission through each aperture effectively represents a line scan across the target. By compiling the line scans collected by the entire array appropriately, we can then create a transmission microscopy image of the object in which the focal-plane resolution is approximately equal to the aperture size. The diagonal arrangement of the aperture array with respect to the channel is required to ensure full sampling of the target. We encourage interested readers to refer to [Heng et al. 2006a; Cui et al. 2008] for a more detailed and complete explanation of the OFM method.
Figure 1.
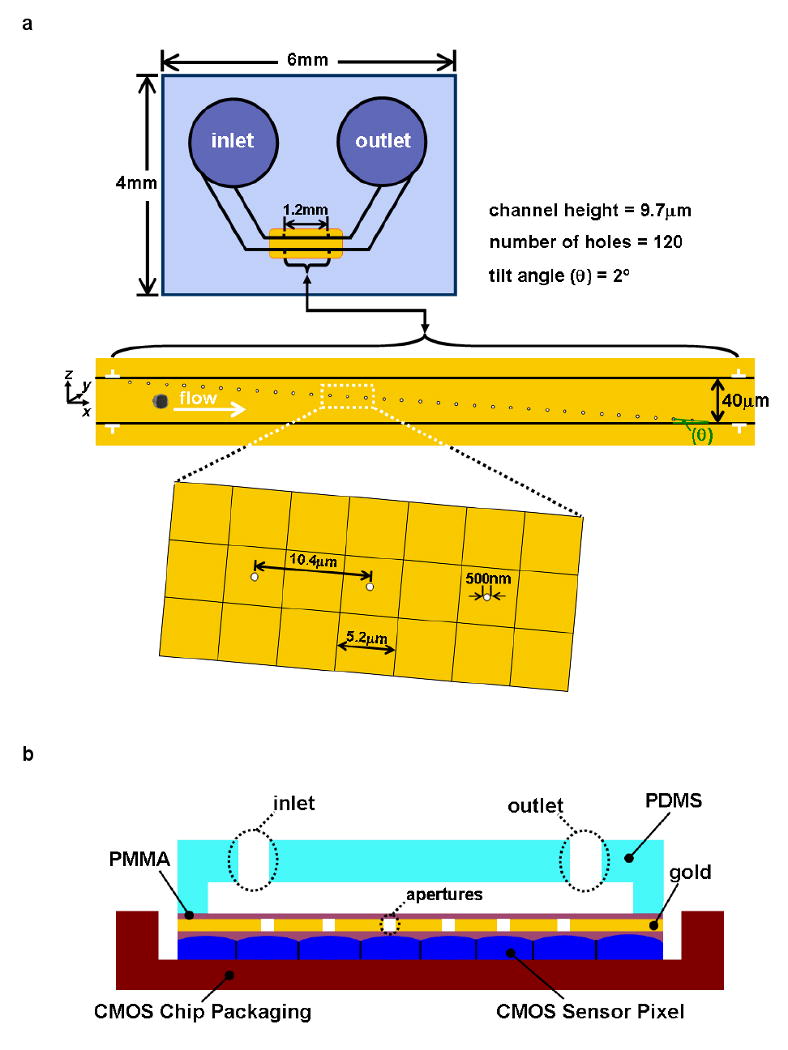
(a) The planar geometry and the aperture array arrangement of the on-chip OFM. (b) A cross-sectional scheme of the OFM device. (c) A photo of the fabricated on-chip OFM device. (A US dime is placed aside for size comparison and the red line represents the microfluidic channel)
For our current study, the array consists of 120 apertures and the microfluidic channel's dimensions are 40 μm in width, 9.7 μm in height and 2.5mm in length. The microfluidic substrate is poly(dimethylsiloxane) (PDMS). The apertures are 500nm in size and are fabricated at the center of every alternate square pixel (5.2 μm in length) underneath with a separation of 10.4 μm. The tilt angle θ of the array with respect to the channel's flow axis is 2°. The separation of the apertures in the direction perpendicular to the channel's flow axis is 330 nm. The channel height is chosen to be comparable to the size of the Giardia samples that we would be imaging. This ensures that the targets will flow across the aperture array with close proximity. The OFM aperture array is patterned in the middle segment of the microfluidic channel so that the target can flow across this rotation-free region steadily and free from entrance effect. The planar view of the OFM device is shown in Figure 1(a). The cross-sectional view of the OFM device is shown in Figure 1(b).
The flow speed of each target is calculated by dividing the channel length spanned by the aperture array by the transit time of the object across the entire array. The percentage error of the computed flow speed is found to be less than 4% for most of the biological samples we examined in this study.
The OFM device is effectively a fixed focal plane microscope where we can expect obtain the highest acuity at the floor of the flow channel (level of the aperture array). Based on our previous OFM resolution study [Heng et al. 2006b], the focal plane resolution of this OFM device is 800nm.
Finally, the achieved image resolution along the flow direction is set by the larger of the two: the focal plane resolution (related to the aperture size) or the image smear extent. This second parameter deserves more explanation. Our current system collects signal from each relevant sensor pixel at a rate of 2000 s-1. If the target translates across the apertures too quickly, the acquired image will appear smeared. We can define the threshold speed as the speed when smearing artifacts become significant. The threshold speed equals the product of aperture size and pixel readout rate. For our current system, this speed equals 1 mm/s. During our experiments, we typically operate with target flow speeds that are substantially lower than this speed to preserve good resolution in the flow direction.
2.2 OFM device fabrication
We use a combination of nanofabrication technology and standard soft lithography technique to fabricate our compact OFM devices. We use a monochrome CMOS imaging sensor (Micron Tech, MT9M001C12STM) as our starting substrate. This sensor chip contains a 2D array of 1280×1024 square pixels. We note that the fabricated OFM device will only make use of a couple of lines of pixels on this sensor chip for sensing and, as such, we could have used a linear array sensor chip in place of this particular chip type.
We prep this sensor chip by spin coating a 400 nm layer of poly(methyl methacrylate) (PMMA) layer onto the chip's surface to planarize it. Next, we coat a 15 nm chromium seed layer and a 300 nm thick gold layer onto the PMMA surface by thermal evaporation (AVC 1000, Veeco). We next use a focused ion beam machine (Nova200, FEI Company) to mill a line array of circular apertures into the metal layer. Then, we passivate the gold surface with a 400 nm thick PMMA layer. The choice of the layer thickness represents a compromise between passivation robustness and the need to optimize object and aperture array proximity for good image resolution.
We next emplace a transparent PDMS block containing a microfluidic channel onto the modified sensor chip. The PDMS microfluidic channel is formed by standard soft lithography which defines its planar geometry and the channel height. The emplacement is performed with the aid of a contact aligner (Karl Suss, MJB3). Finally, we solder the OFM device onto an evaluation board (SILICON VIDEO® 9M001 from Epix, Inc.), which allows us to interface the OFM device with a computer.
2.3 Surface treatment
To facilitate smooth flow of our biological samples in the device and to prevent debris adhesion to the microfluidic channel walls, we condition the channel walls through the following process. First, the microfluidic channel is filled up and flushed with a 10% poly(ethylene glycol) (PEG) solution, 0.5 mM NaIO4, and 0.5% (by weight) benzyl alcohol. The OFM device is then placed under a UV light source for 1 hour to promote PEG deposition onto the channel walls. This process is similar to the one developed by [Hu et al. 2002]. The PEG grafted surface prevents nonspecific adsorption with biological entities and lubricates the object flow. The device is then rinsed with deionized water, dried, and stored under ambient condition.
2.4 Sample preparation
The suspensions of G. lamblia cysts and trophozoites (H3 isolate) are purchased from WaterBorne, Inc., USA. They are fixed and preserved in 5% Formalin / PBS at pH 7.4 / 0.01% Tween 20. The G. lamblia cyst has an oval shape, about 7–10 μm in width and 8–13 μm in length [Zhu et al. 2004] while its trophozoite form has a particular pear shape and is approximately 10-20 μm in dimension. Before use, the suspensions were sonicated and filtered with a 40μm cell strainer (BD Falcon, USA). The number concentration of targets in the suspensions is approximately 106 per ml.
2.5 Image acquisition process
During testing and evaluations, we mount the on-chip OFM device on a conventional microscope (BX41, Olympus) and illuminated uniformly under a white light source (100W halogen lamp through a 5 × objective) from the top. The incident light intensity is 20 mW/cm2, which is comparable to the intensity of sunlight. The conventional microscope simply serves as a platform for cross-verifications and is not an integral part of the OFM device. We reprogram the associated data-readout software so that we can readout the relevant lines of the sensor pixels rather than the entire sensor grid. This modification allows us to achieve a line readout rate of 2000 lines per second. We choose an exposure time window of 0.5 ms between each readout.
We introduce the sample solution into the OFM device by injecting the solution into the input port (Figure 1(a)). The solution automatically fills the entire microfluidic channel by capillary force.
There are two ways by which we can actuate microfluidic flow and perform sample scanning – pressure-based flow and electrokinetic-based translation. We describe our implementation of both approaches in the next two sub-sections.
2.5.1 Pressure-based microfluidic flow
We generate a pressure differential in our microfluidic channel through the use of surface tension. We accomplish this by adding an additional drop of the sample solution onto the input port. As native PDMS is highly hydrophobic, this liquid drop beads up to form a hemispherical shape with a radius of about 0.5 mm. The associated surface tension then creates a Young–LaPlace pressure of up to several hundred Pa at the inlet [Walker and Beebe 2002]. This pressure difference between the two ports then generates a mean fluid flow velocity with a magnitude of a few hundred microns per second in our microfluidic channel configuration. This fluid velocity will drag the targets to flow inside the microfluidic channel and the translation speed of our targets is proportional to this flow speed and is measured by the method described in Section 2.1.
We find that the flow velocity as generated by this means is sufficiently constant for our application, as the OFM image acquisition time for each target is fairly short – typically less than 1.0 second. The flow speed may vary over time as fluid drains out of the beading drop and alters the surface tension. However, this change occurs over a much longer timescale. As long as we are able to measure the flow speed of each individual target independently, this variation is unimportant.
Experimentally, we find that the average flow speeds of G. lamblia cysts and trophozoites are both 600 μm/s for both species.
2.5.2 Electrokinetic-based microfluidic flow
We have found that the use of DC electrokinetics provides an alternate, simple and direct way to actuate microfluidic flow. This method involves imposing an electric field along the microfluidic flow channel axis to generate an electrosmotic flow, an electrophoretic force and an electro-orientation force on the biological sample. We will discuss our experimental findings regarding the effects of these forces on our G. lamblia cysts and trophozoites in Section 3.
To generate the requisite electric field in the channel, we insert a pair of external platinum electrodes into the inlet and outlet. Next, we connect the electrodes to a low voltage power supply (E3617A, HP). A multi-meter is also connected to the setup to measure the current level. A constant voltage of 30 V (electric field strength is E = 10 V/mm) is applied to the electrodes. No destruction and disruption of the PMMA protection layer is observed if the applied voltage is kept below this voltage.
Experimentally, we find that the average flow speeds of G. lamblia cysts and trophozoites are 400 μm/s and 150 μm/s, respectively, for this scheme.
2.5.3 Observations
We note the following experimental observations.
First, the cell flow speed is substantially lower than the threshold speed of 1 mm/s for both schemes. This assures that the OFM image quality along the flow direction is well-preserved.
Second, we observe that the OFM device can typically operate for about 30 minutes before debris accumulation begins to have an impact on the uniformity of the flow velocity. This relatively long operational lifetime is attributable to the PEG coating treatment of the microfluidic channel which reduces debris deposition. We are currently working on techniques to further prolong channel-use lifetime.
Third, the microfluidic channel can be flushed and rinse with DI water via a vacuum pump. The on-chip OFM device can then be stored under DI water and ready for repeated use.
3. Results and discussion
3.1. Study of pressure and electrokinetic-based flow control for G. lamblia cysts and trophozoites
During OFM image acquisition, the target has to translate across the aperture array with a uniform speed and maintain the same orientation. Any significant deviations will introduce distortions into the resulting image. In our previous work [Cui et al. 2008]; we briefly studied the impact of pressure-based and electrokinetic-based flow on Chlamydomonas and pollen spore imaging. In that study, we found that the non-uniform Poiseulle flow velocity profile created by pressure difference generates a significant torque on the targets and, thereby, causing the target to rotate. Electrokinetic-based flow allowed for better flow control for a number of reasons: 1) the electroosmotic flow has a plug-like profile and, as such, does not generate a significant torque on a target in the flow stream [Probstein 1992]. 2) The net electric charge on a biological target interacts with the imposed electric field to pull the target towards the oppositely charged pole (electrophoretic force). This interaction acts as a net body force on the cell and should not cause any rotation. 3) The non-uniform electric charge distribution (dipole moments) on a target interacts with the imposed electric field to reorient the target to achieve the lowest potential energy state. This electro-orientation effect effectively locks the target into a single orientation during the entire flow duration [Hughes 2003].
Our current study provides us an opportunity to examine a number of issues: 1) G. lamblia trophozoites are pear-shaped. How do they fare in pressure-based flow OFM imaging? 2) Do targets rotate under pressure-based flow with the same angular velocities or is the angular velocity broadly distributed? 3) What proportions of the G. lamblia cysts translating under pressure-based and electrokinetic-based flows have sufficiently well-controlled flow motions that they can be imaged with the OFM device. 4) How fast does a G. lamblia cyst lock into its steady-state orientation during electrokinetic-based flow?
For this sub-study, we fabricate a number of microfluidic devices based on the description given in Section 2. Glass slides are used in place of sensor chips as the substrate, as this allows us to examine the exact flow motions of targets in the channels under a conventional inverted microscope (IX71, Olympus). The region of interest is chosen to be 300 μm in length and located in the middle of the microfluidic channel. This distance is equivalent to the length of OFM array to image a G. lamblia cyst (10 μm in width).
Experimentally, we observe that G. lamblia trophozoites can flow without significant rotations under pressure-based flow (experimental parameters as described in section 2.5.1). Given its particular pear or relatively elongated shape, the trophozoite can either balance itself in the parabolic velocity profile flowing steadily along the microfluidic channel without rotation or it is dragged to the side wall and the side wall restricts them from rotation. We did not observe any significant rotation event for all of the Giardia trophozoites observed. This indicates that pressured-based flow is a viable flow strategy for G. lamblia trophozoite imaging.
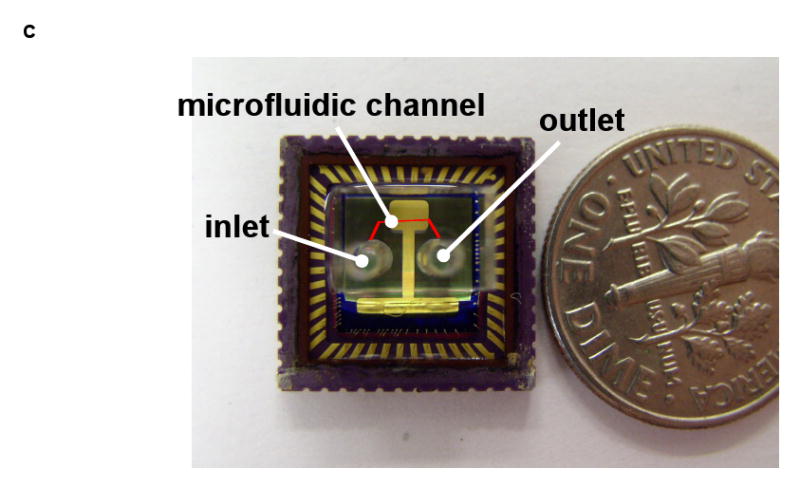
On the other hand, we find that the more spherical G. lamblia cysts rotate significantly under pressure-based flow. The cysts rotate with opposite orientations (clockwise versus counter-clockwise) when it is flowing along the upper and lower half of the microfluidic channel while driven by pressure as illustrated in Figure 3(a). In general, we observed that the typical Giardia cyst tends to rotate more and translate slower when it is flowing closer to a side wall.
Figure 3.

The microfluidic motion of a Giardia cyst when (a) driven by pressure and (b) driven by DC electrokinetics at 30V (E = 10 V/mm). (c) A graph showing the distribution of sample rotation under pressure-based and electrokinetic-based drive. The horizontal axis quantifies the magnitude of rotation after 300 μm of travel in the microfluidic channel.
To study the impact of electrokinetic-based microfluidic flow on G. lamblia cysts, we set up an experiment as per the description in section 2.5.2. Both the G. lamblia cysts [Erlandsen and Meyer 1984], and the microfluidic channel walls carry net negative charges at neutral pH values. This implies that the resulting electrophoretic and electroosmostic forces act in opposite directions. We observe that the net electrokinetic flow of the cysts is opposite to the direction of applied electric field; this indicates that the electrophoretic force is stronger than the electroosmotic flow in our experiment. In addition, we observe that most Giardia cysts settle into their final flow orientation by electro-orientation before flowing more than 200 μm in the microfluidic channel. The relatively small electric field strength (E = 10 V/mm) is sufficiently strong to create an electro-orientation force to hold most cells at a constant orientation during flow. This strength is much lower than the critical value that would cause cell lysis.
We study the statistical distribution of cell rotation events during flow by driving 100 lamblia cysts each in a microfluidic channel under pressure-based and electrokinetic-based flow. Figure 3(a) and (b) show a typical Giardia cyst flowing in the channel under these two conditions. Figure 3 (c) plots the number of cysts versus the extent of the rotation (over a flow distance of 300 μm). We can see from the plot that, under pressure-based flow, the cyst rotation is significant and broadly distributed. In comparison, the extent of cyst rotation under electrokinetic-based flow is small. In the context of this current OFM design, a rotation of 5° during the passage of the cyst across the aperture array does not create significant image distortions. Experimentally, we find that 70% of the cysts experienced rotations under pressure-based flow while only 5% of the cysts experienced significant rotations under electrokinetic-based flow. This indicates the DC electrokinetics is an effective way to suppress rotational motion of cells in OFM systems.
3.2. OFM imaging of G. lamblia cysts and trophozoites
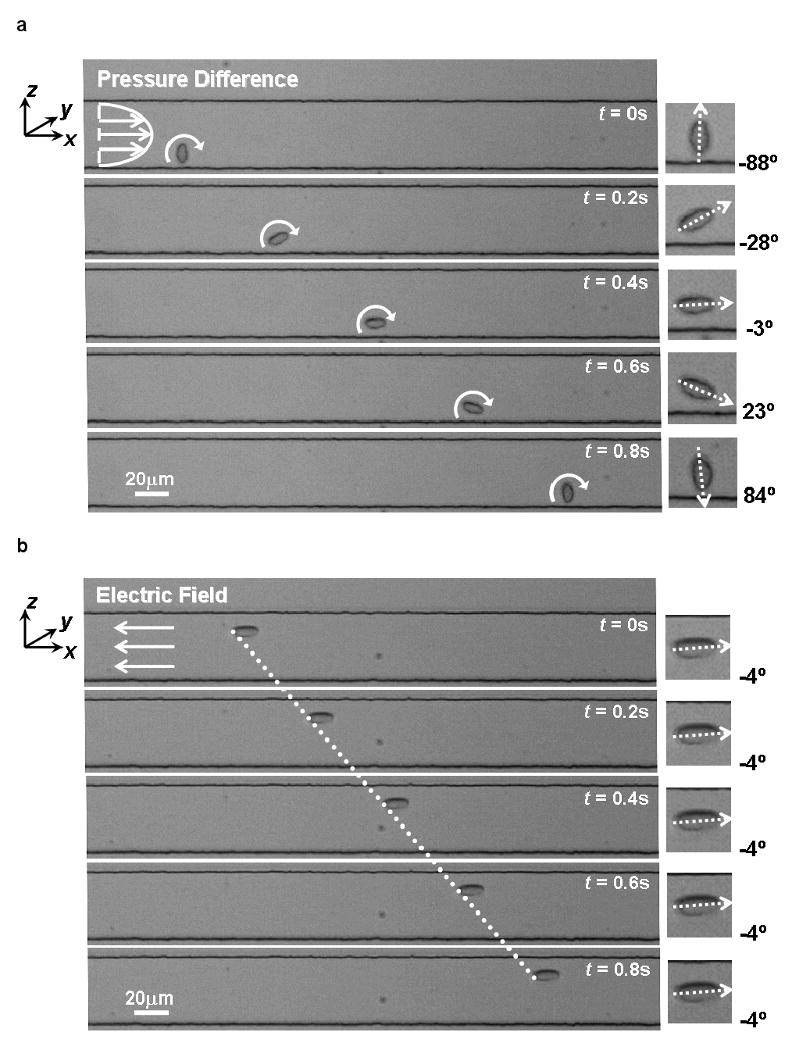
We image a number of G. lamblia cysts and trophozoites with our completed OFM device. Figure 2(a)-(d) and (h)-(k) are OFM images (focal plane resolution of 800 nm) of several G. lamblia cysts and trophozoites respectively. Fig. 2(e)-(f) and Fig. 2(l)-(m) are standard microscopy images of similar G. lamblia cysts and trophozoites acquired with an inverted light transmission microscope (Olympus IX-71) under a 40 × objective. We can see that the OFM images compare well with standard microscopy images. The subcellular content and the trophozoites's flagella are clearly discernable in the OFM images.
Figure 2.
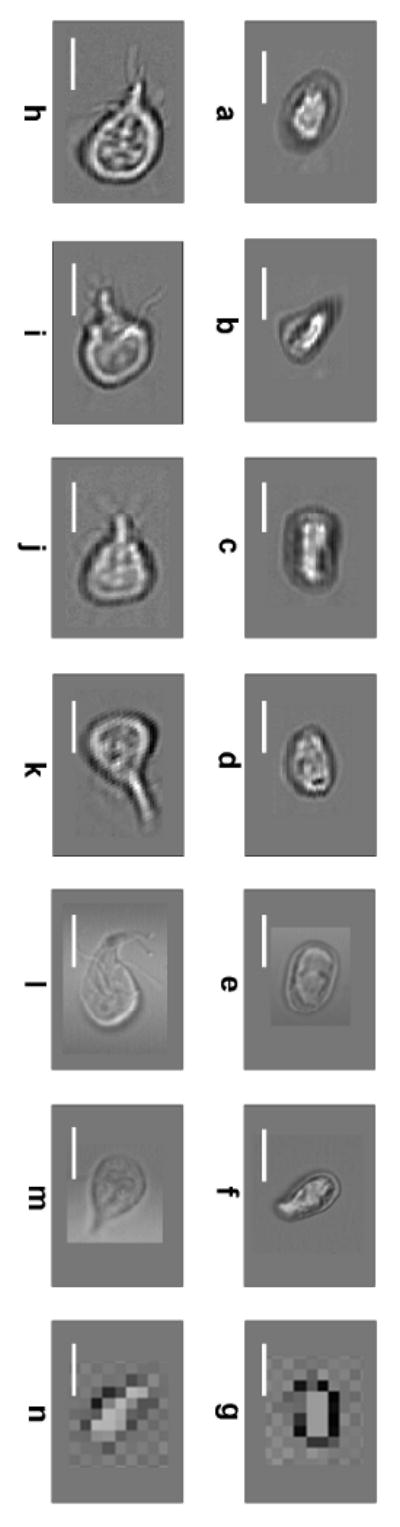
G. lamblia images. Images taken from the on-chip OFM device of cysts (a–d), trophozoites (h–k). Images taken from a conventional light transmission inverted microscope with a 40 × objective of cysts (e–f) and trophozoites (l–m). Direct projection images on a 2.2 μm CMOS imaging sensor chip of cyst (g) and trophozoite (n). (Scale bars: 10 μm)
We further compare the performance of our OFM device to the simple direct projection imaging scheme. In this experiment, we place some G. lamblia cysts and trophozoites directly onto a high density CMOS sensor chip (Micron Tech, MT9P001). With the sensor pixel size of 2.2 μm, this is the highest pixel density sensor chip that is currently commercially available. Representative images of the targets are shown in Figure 2(g) and 2(n). The relatively low quality of the images when compared with OFM images can be attributed to a number of reasons. First, due to the planar design of CMOS sensor chip and the fact that each sensor pixel's fill factor is necessarily less than unity, we expect these images to be sparsely sampled. In comparison, the OFM method actually allows us to oversample our targets by simply choosing a slower flow speed than the sensor frame rate and by ensuring that the line scans associated with the apertures overlap spatially. The latter can be accomplished by choosing a shallow tilt angle for the aperture array versus the microfluidic channel. Second, the transparent protective coating on the sensor deteriorates the achievable resolution. We estimate that this layer is 600 nm thick based on typical manufacturing practices. As the highest resolution is achieved in direct projection imaging by placing the targets as close to the sensor grid as possible, this relatively thick coating deteriorates the achievable resolution significantly [Heng et al. 2006b]. Finally, we note that while simple direct projection imaging, as implemented with currently available technology, fares worse than OFM imaging in the context of image resolution, promising direct projection methods based on in-line holography [Seo et al. 2009] can potentially achieve good resolution.
4. Conclusions
We demonstrate the use of an OFM device to perform microscopy imaging of G. lamblia cysts and trophozoites. We are able to clearly discern the subcellular content and the trophozoites's flagella in the OFM images. The achieved focal plane resolution of this OFM device is 800 nm. This study shows that the OFM technology can potentially be used to create autonomous, cheap and highly compact water analysis systems for monitoring water quality in rural environment and resource-poor countries.
Acknowledgments
The authors appreciate the generous help and discussions from Dr. Xin Heng, Guoan Zheng, Sean Pang and Dr. Jigang Wu. This work is supported by DARPA Center for Optofluidic Integration (California Institute of Technology), NIH R21EB008867-01, and Coulter Foundation Early Career Award. Lap Man Lee is thankful for the financial support from the Croucher Foundation Scholarship (Hong Kong).
References
- 1.Chin CD, Linder V, Sia SK. Lab-on-a-chip devices for global health: Past studies and future opportunities. Lab Chip. 2007;7:41–57. doi: 10.1039/b611455e. [DOI] [PubMed] [Google Scholar]
- 2.Cui XQ, Lee LM, Heng X, Zhong WW, Sternberg PW, Psaltis D, Yang CH. Lensless high-resolution on-chip optofluidic microscopes for Caenorhabditis elegans and cell imaging. PNAS. 2008;105:10670–10675. doi: 10.1073/pnas.0804612105. [DOI] [PMC free article] [PubMed] [Google Scholar]
- 3.Erlandsen SL, Meyer EA. Giardia and Giardiasis: Biology, Pathogenesis, and Epidemiology. Springer; 1984. [Google Scholar]
- 4.Heng X, Erickson D, Baugh LR, Yaqoob Z, Sternberg PW, Psaltis D, Yang C. Optofluidic microscopy- a method for implementing a high resolution optical microscope on a chip. Lab Chip. 2006a;6:1274–1276. doi: 10.1039/b604676b. [DOI] [PubMed] [Google Scholar]
- 5.Heng X, Cui X, Knapp D, Wu J, Yaqoob Z, McDowell EJ, Psaltis D, Yang C. Determining the resolution limit of nano aperture based optical imaging or sensing device. Optics Express. 2006b;14:10410–10425. doi: 10.1364/oe.14.010410. [DOI] [PubMed] [Google Scholar]
- 6.Hu S, Ren X, Bachman M, Sims CE, Li GP, Allbritton N. Surface modification of poly(dimethylsiloxane) microfluidic devices by ultraviolet polymer grafting. Analytical Chemistry. 2002;74:4117–4123. doi: 10.1021/ac025700w. [DOI] [PubMed] [Google Scholar]
- 7.Hughes MP. Nanoelectromechanics in Engineering and Biology. 1st. CRC Press; 2003. [Google Scholar]
- 8.Lange D, Storment CW, Conley CA, Kovacs GTA. A microfluidic shadow imaging system for the study of the nematode Caenorhabditis elegans in space. Sensor and Actuators, B. 2005;107:904–914. [Google Scholar]
- 9.Lay C, Teo CY, Zhu L, Peh XL, Ji HM, Chew BR, Murthy R, Han HF, Liu WT. Enhanced microfiltration devices configured with hydrodynamic trapping and a rain drop bypass filtering architecture for microbial cells detection. Lab Chip. 2008;8:830–833. doi: 10.1039/b800015h. [DOI] [PubMed] [Google Scholar]
- 10.Liu WT, Lay C. Lab-on-a-chip devices for microbial monitoring and detection in water. Water Science & Technology: Water Supply. 2007;7:165–172. [Google Scholar]
- 11.Oheim M. High-throughput microscopy must re-invent the microscope rather than speed up its functions. British Journal of Pharmacology. 2007;152:1–4. doi: 10.1038/sj.bjp.0707348. [DOI] [PMC free article] [PubMed] [Google Scholar]
- 12.Ozcan A, Demirci U. Ultra wide-field lens-free monitoring of cells on-chip. Lab Chip. 2008;8:98–106. doi: 10.1039/b713695a. [DOI] [PubMed] [Google Scholar]
- 13.Park JH, Hwang DK, Lee J, Im S, Kim E. Studies on poly(methyl methacrylate) dielectric layer for field effect transistor: Influence of polymer tacticity. Thin Solid Films. 2007;515:4041–4044. [Google Scholar]
- 14.Probstein RF. Physicochemical Hydrodynamics. 2nd. Wiley-Interscience; 1992. [Google Scholar]
- 15.Sakamoto C, Yamaguchi N, Yamada M, Nagase H, Seki M, Nasu M. Rapid quantification of bacterial cells in potable water using a simplified microfluidic device. Journal of Microbiological Methods. 2007;68:643–647. doi: 10.1016/j.mimet.2006.11.003. [DOI] [PubMed] [Google Scholar]
- 16.Seo S, Su TW, Tseng DK, Erlinger A, Ozcan A. Lensfree holographic imaging for on-chip cytometry and diagnostics. Lab Chip. 2009 doi: 10.1039/b813943a. to be appeared. [DOI] [PMC free article] [PubMed] [Google Scholar]
- 17.Simonnet C, Groisman A. Two-dimensional hydrodynamic focusing in a simple microfluidic device. Applied Physics Letters. 2005;87:114104–114107. [Google Scholar]
- 18.Walker GM, Beebe DJ. A passive pumping method for microfluidic devices. Lab Chip. 2002;2:131–134. doi: 10.1039/b204381e. [DOI] [PubMed] [Google Scholar]
- 19.Xuan X, Li D. Focused electrophoretic motion and selected electrokinetic dispensing of particles and cells in cross-microchannels. Electrophoresis. 2005;26:3552–3560. doi: 10.1002/elps.200500298. [DOI] [PubMed] [Google Scholar]
- 20.Yager P, Edwards T, Fu E, Helton K, Nelson K, Tam MR, Weigl BH. Microfluidic diagnostic technologies for global public health. Nature. 2006;442:412–418. doi: 10.1038/nature05064. [DOI] [PubMed] [Google Scholar]
- 21.Zhang Q, Zhu L, Feng H, Ang S, Chau FS, Liu WT. Microbial detection in microfluidic devices through dual staining of quantum dots-labeled immunoassay and RNA hybridization. Analytica Chimica Acta. 2006;556:171–177. doi: 10.1016/j.aca.2005.07.003. [DOI] [PubMed] [Google Scholar]
- 22.Zhu L, Zhang Q, Feng H, Ang S, Chau FS, Liu WT. Filter-based microfluidic device as a platform for immunofluorescent assay of microbial cells. Lab Chip. 2004;4:337–341. doi: 10.1039/b401834f. [DOI] [PubMed] [Google Scholar]