

Abstract
Impaired gating by hippocampal dentate granule cells may promote the development of limbic epilepsy by facilitating seizure spread through the hippocampal trisynaptic circuit. The second synapse in this circuit, the dentate granule cell≫CA3 pyramidal cell connection, may be of particular importance because pathological changes occurring within the dentate likely exert their principal effect on downstream CA3 pyramids. Here, we utilized GFP-expressing mice and immunolabeling for the zinc transporter ZnT-3 to reveal the pre- and postsynaptic components of granule cell≫CA3 pyramidal cell synapses following pilocarpine-epileptogenesis. Confocal analyses of these terminals revealed that while granule cell presynaptic giant boutons increased in size and complexity one month after status epilepticus, individual thorns making up the postsynaptic thorny excrescences of the CA3 pyramidal cells were reduced in number. This reduction, however, was transient, and three months after status, thorn density recovered. This recovery was accompanied by a significant change in the distribution of thorns along pyramidal cells dendrites. While thorns in control animals tended to be tightly clustered, thorns in epileptic animals were more evenly distributed. Computational modeling of thorn distributions predicted an increase in the number of boutons required to cover equivalent numbers of thorns in epileptic vs. control mice. Confirming this prediction, ZnT-3 labeling of presynaptic giant boutons apposed to GFP-expressing thorns revealed a near doubling in bouton density, while the number of individual thorns per bouton was reduced by half. Together, these data provide clear evidence of novel plastic changes occurring within the epileptic hippocampus.
Introduction
Dentate granule cells innervate CA3 pyramidal cells via presynaptic terminal expansions known as giant mossy fiber boutons. These terminals are among the largest and most potent in the entire brain (Henze et al., 2002; Lawrence and McBain, 2003), and the postsynaptic structures they innervate are also unique. Specifically, in contrast to the small head and short stalk typical of most dendritic spines, CA3 pyramidal spines are much larger, and most impressively, are frequently organized into elaborate compellations of spine heads or “thorns” all connected to the parent dendrite by a single stalk. These structures – termed thorny excrescences – are frequently enveloped by the apposed giant bouton, with the entire structure containing as many as 40 separate presynaptic release sites and corresponding postsynaptic densities (Chicurel and Harris, 1992). The efficacy of this structure in producing suprathreshold activation of targeted CA3 pyramidal cells has earned it the name “detonator synapse.”
In the normal brain, the dentate limits the flow of information through the hippocampal trisynaptic circuit. Aberrant plastic changes of granule cell axons and dendrites occurring during the development of epilepsy, however, are hypothesized to impair this normal gating function, effectively destabilizing the circuit and promoting seizures (for review see Hsu et al., 2007). An important prediction of this hypothesis is that granule cell inputs to their target CA3 pyramidal cells will be enhanced in the epileptic brain, and indeed, recent studies have demonstrated that granule cell presynaptic terminals exhibit plastic changes indicative of increased potency (Goussakov et al., 2000; Pierce and Milner, 2001; Danzer et al., 2009). The impact of these presynaptic changes, however, could be mitigated or exacerbated by changes among CA3 pyramidal cell postsynaptic thorny excrescences. Determining whether and how these structures are altered during the development of temporal lobe epilepsy will provide key insights into the significance of granule cell≫CA3 pyramidal cell transmission in epilepsy.
Here, we take advantage of recent advances in transgenic labeling technologies and confocal microscopy to examine both pre- and post-synaptic components of the granule cell≫CA3 pyramidal cell synapse in green fluorescent protein expressing mice, and develop and validate a novel immunostaining procedure for revealing mossy fiber terminals. These advances now make it possible to clearly resolve postsynaptic thorny excrescences and apposed presynaptic structures. Due to the complexity of these structures, it has been difficult to resolve thorny excrescences with light microscopy in the past, which has limited quantification. The present study, therefore, not only examines plasticity of these structures during epileptogenesis, but provides new insights into their organization and distribution under control conditions.
Methods
Pilocarpine Model of Epilepsy
Forty-two adult male Thy1-GFP-expressing mice (M line; Feng et al., 2000) on a C57BL/6 background were used for the present study. No female mice were used to avoid estrus cycle-induced changes in thorny excrescence density (Tsurugizawa et al., 2005). All procedures complied with institution and NIH guidelines for the care and use of animals. Two- to three-month-old mice were injected subcutaneously (s.c.) with 1mg/kg methyl scopolamine nitrate in sterile saline, followed 15 minutes later with 380 mg/kg pilocarpine in saline. Treatments were conducted between 10AM and noon to control for diurnal variations. Mice were observed following the injections for the development of continuous seizure activity (status epilepticus or SE), defined behaviorally by continuous tonic/clonic convulsions. Mice were given two doses of 10 mg/kg diazepam at 15 minute intervals three hours after the onset of SE to control seizure activity and improve survival. With this protocol, mice experience a minimum of three hours of continuous generalized seizure activity (unpublished observations based on EEG data). Control animals received all drugs and treatments, except they were given saline instead of pilocarpine.
Control and pilocarpine-treated mice were sacrificed either one or three months after treatment, producing a total of four groups for analyses of GFP-expressing cells (1M controls, N=7; 1M SE, N=9; 3M controls, N=7; 3M SE, N=7). A second group of mice sacrificed three months after control treatment (N=5) or pilocarpine-status epilepticus (N=7) was generated for GFP+zinc transporter 3 (ZnT-3) double-labeling experiments. Mice were overdosed with pentobarbital (100 mg/kg) and perfused with PBS+1U/ml heparin followed by 2.5% paraformaldehyde and 4% sucrose in PBS, pH 7.4. Brains were post-fixed for 12 hours, cryoprotected in sucrose (10, 20, 30%), snap-frozen in isopentane and cryosectioned in the coronal plane at 60 μm. Slide mounted sections were stored at −80°C until use (Superfrost Plus slides; Fisher Scientific).
Immunohistochemistry
As part of a separate study (Walter et al., 2007), mice used in the present study were injected with BrdU either eight weeks before or one week after pilocarpine treatment (100 mg/kg s.c. X 3). BrdU treatment is not expected to impact any parameters examined in the present study, and both control and pilocarpine-treated animals received identical treatments. Correspondingly, however, GFP immunohistochemistry was conducted using a combined BrdU/GFP immunostaining protocol, as described previously (Walter et al., 2007). Briefly, endogenous GFP expression was enhanced by incubating sections overnight at 4°C in 5 micrograms/ml rabbit polyclonal anti-GFP antibody (AB3080, Chemicon, Temecula, CA) in blocker followed by 1:750 Alexa Fluor 594 goat anti-rabbit antibodies (Molecular Probes, Eugene, OR). After rinsing in PBS, sections were dehydrated in alcohols, cleared in xylenes and mounted with Cytoseal.
ZnT-3 immunolabeling was conducted on slide mounted sections. Sections were thawed in PBS, blocked for one hour with 0.5% Igepal+5% normal goat serum in PBS and incubated overnight in 1:10,000 polyclonal rabbit anti-ZnT-3 (Synaptic Systems, Göttingen, Germany) in blocker at 4°C. Sections were then rinsed in blocker, incubated for two hours in 1:750 Alexa Fluor 594 goat anti-rabbit IgG in blocker, rinsed in PBS and mounted with Gel Mount (Biomeda, Foster City, CA).
Microscopy and data collection
GFP-expressing pyramidal cells were selected only from the CA3b or midportion region of CA3, being bounded by an imaginary line drawn between the tips of the blades of the dentate gyrus medially and the fimbria laterally (Lorente de Nó, 1934; Ishizuka et al., 1995). CA3 pyramidal cells exhibit considerable regional heterogeneity (Buckmaster and Amaral, 2001; Gonzales et al., 2001), so the present study focused on CA3b to increase the likelihood of detecting differences among groups. Further selection criteria included: 1) bright GFP-labeling, so that thorny excrescences could be accurately counted; 2) Cell body located in the pyramidal cell layer; 3) apical dendritic projection through stratum lucidum; 4) presence of dendritic spines on process projecting into stratum radiatum, to distinguish pyramidal cells from aspiny interneurons (no labeled interneurons were observed, suggesting that the Thy1-GFP line specifically labels pyramidal cells in this region). Neuron selection was conducted with the experimenter blinded to treatment group, and since CA3 pyramidal cell labeling is relatively sparse in the Thy1-GFP line, all CA3 pyramidal cells meeting these selection criteria were imaged for analyses.
Cell counts were conducted to determine whether pilocarpine-status epilepticus altered the number of GFP-expressing CA3 pyramidal cells. GFP-expressing pyramidal cells were counted in the CA3b region of hippocampus from randomly selected sections between the anterior-posterior coordinates Bregma −1.34 to −2.54. GFP-expressing cells were counted using a modified optical dissector method (Williams and Rakic, 1988; Peterson et al., 1999; Howell et al., 2002) and values expressed as the number of GFP-labeled CA3b pyramids per hippocampal section. Approximately eight 60 μm brain sections (two hippocampi/section) were scored for each animal.
Pyramidal cells selected for analysis were imaged using a Leica SP5 confocal system set up on a DMI 6000 inverted microscope. Cells were first imaged under 10X (NA 0.3) magnification so that neuronal position relative to the dentate granule cell layer could be determined. Cell position was measured using Leica quantification software (1.3.1 build 525) by first drawing a straight line connecting the tips of the upper and lower blades of the dentate gyrus. The distance between the midpoint of this first line and the pyramidal cell body was scored as distance from the dentate gyrus. CA3 pyramidal cell apical dendrites projecting through stratum lucidum were then imaged using a 63X oil immersion objective (NA 1.4). The position of stratum lucidum was determined by the presence of GFP-labeled granule cell mossy fiber axons (Fig. 1A, sl). Pyramidal cell body depth in the pyramidal cell layer was determined by measuring the distance between the top of the soma and stratum lucidum and dividing by the total width of the pyramidal cell layer. Apical dendrites were imaged using 5X optical zoom with a 0.2 μm step through the z-depth of the tissue, producing three-dimensional confocal image “stacks”. Fluorochromes were excited using the 543 nm laser line and emission wavelengths between 610–650 nm were collected. Only pyramidal cell dendritic segments bounded by mossy fiber axons (i.e. within stratum lucidum) were used for analysis.
Figure 1.

Confocal maximum projections from control animals showing branch order designations and thorny excrescence details for imaged pyramidal cells. A: CA3b pyramidal cell with first (1°), second (2°) and third (3°) order branches noted. The breadth of stratum lucidum (sl) is denoted by the bracket ({). For this particular cell, only second and third order branches would be quantified, as the first order dendritic segment is located outside of stratum lucidum. B: CA3b pyramidal cell apical dendrite with three simple thorny excrescences possessing only a single thorn (asterisks) and two complex thorny excrescences with multiple thorns (circled region). Blue arrows denote the necks of the two complex thorny excrescences, while blue arrowheads denote some of the individual thorns making up these structures. C: Pyramidal cell apical dendrite crossing the border between stratum lucidum (sl) and stratum radiatum (sr). Note the structural differences between thorns (blue arrowheads) in stratum lucidum and dendritic spines (filled arrowheads) in stratum radiatum. Scale bars = 20 μm (A); 5 μm (B); 3 μm (C).
The thorny excrescences of CA3 pyramidal cells possess a single, thin spine neck of variable length (Fig. 1B, blue arrows) which emerges from the parent dendrite and gives rise to one or more bulbous “thorns” (Fig. 1B, asterisks and blue arrowheads) (Blackstad and Kjaerheim, 1961; Amaral and Dent, 1981; Chicurel and Harris, 1992; Stewart et al., 2005; Lauer and Senitz, 2006; Rollenhagen et al., 2007). The complexity of these structures has challenged researchers attempting to quantify them, not only because a single excrescence can have multiple thorns, but because excrescences are frequently organized into groups (Fig. 1B, circled region). Until recently, limits in light level microscopy have hampered clearly resolving these structures. Because of these limitations, previous light level studies have taken a number of quantitative approaches, including measuring the length of entire groups (Buckmaster and Amaral, 2001; Gonzales et al., 2001) or attempting to identify individual thorny excrescences (Jiang et al., 1998). Fortunately, advances in confocal imaging now make it possible to resolve the individual thorns making up a thorny excrescence (Danzer and McNamara, 2004; Tsurugizawa et al., 2005), and for the present study we have used this variable to quantify these structures. With the improved resolution, we found group measurements to be impractical, as it was difficult to account for the three-dimensional arrangement of groups around a dendrite with simple length measurements. Moreover, measurements of thorn density may have the most biological significance, as they are the targets for synaptic innervation (Chicurel and Harris, 1992).
To quantify thorn density, three-dimensional confocal image stacks were imported into Neurolucida software for digital reconstruction (version 7.50.4; Microbrightfield Inc.). The branch order of dendritic segments contained within stratum lucidum was determined for each cell (see figure 1, A for an explanation of branch order) and the number of thorns along each segment was quantified. To be counted as a thorn, the structure had to possess a minimum diameter of 0.4μm and be located in stratum lucidum. Notably, thorns are structurally distinct from simple spines located in adjacent stratum radiatum (Fig. 1C). Simple thorny excrescences with a single thorn were counted as one (Fig. 1B, asterisks), while each individual thorn was counted for complex thorny excrescences (Fig. 1, B&C, arrowheads). All thorns meeting these criteria along segments of dendrite within stratum lucidum were counted. Thorn density was then defined as the number of thorns per micron of dendrite. Finally, while the larger size (relative to typical dendritic spines) and the use of three-dimensional confocal images stacks made the counting of thorns reliable and accurate, even in cases when the structure was located above or below the parent dendrite, the interconnecting branches making up a thorny excrescence were not consistently visible. Because of this limitation in light level resolution, and the frequent grouping of multiple thorny excrescences, we did not attempt to determine the average number of thorns making up individual thorny excrescences.
To quantify dentate granule cell giant mossy fiber bouton area and complexity, image stacks used to assess thorn density were reexamined for giant mossy fiber boutons using Neurolucida software. All brightly-labeled giant mossy fiber boutons contained within the image stack were identified. When five giant boutons or fewer were present, all were quantified. When more than five giant boutons were present, boutons were randomly selected for analysis. Additional selection criteria were used as described previously (Danzer et al., 2008, 2009). Analysis consisted of 1) determining the maximum cross sectional area of each giant bouton (excluding filopodia) and 2) determining whether the giant bouton possessed satellite boutons. Maximum cross sectional area was determined as if the structure had been flattened into two-dimensions and then outlined (although this was actually done using three dimensional images stacks as this is more accurate than using maximum projections). Granule cell mossy fiber axons contact CA3 pyramidal cell dendrites at roughly 100–250 μm intervals in CA3 (Claiborne et al., 1986). At each of these contact points, either a single giant bouton, or a core giant bouton with satellite giant boutons is found (Galimberti et al., 2006). Satellite boutons met the same criteria used for giant mossy fiber boutons except they were connected to a core giant bouton by thin axonal process rather than being directly connected to the main mossy fiber axon (as the core bouton was).
Thorn Cover Set Analysis
A set of 14 pyramidal cells was analyzed to determine the distribution of thorns along the length of each dendrite. Seven of these were from control animals and seven were from 3M SE mice. Dendrites were selected for analysis if thorn density over the entire region of dendrite examined exceeded 1.0 thorns/μm. This criterion was used to explore changes in thorn distribution among the subpopulation that accounted for the recovery in overall thorn density observed three months after status. Analyses were run on the entire portion of the dendritic tree reconstructed, rather than segments broken down by branch order, to insure that sufficient length was included for each cell so that values would be representative. All cells meeting the thorn density criterion for the two groups (control and 3M SE) were included in the set. Finally, we note that the thorn data set includes thousands of data points arranged three-dimensionally in space. Although the analytical approaches developed here are complex, we found this complexity to be necessary to appropriately characterize the results.
A program was written in Mathematica® 6.1 (Wolfram Research, Inc., Champaign, IL) to compute the mean distance between thorns by sampling the entire data set of almost 4000 intervals. The program was designed to oversample the data set so that low frequency events would be accurately represented. A second program was written to compute the minimum cover set for each dendrite, defined as the fewest number of spheres of a given radius r required to cover each thorn on the dendritic tree one time with no overlap. Analyses were run using the x-, y- and z-coordinates for each thorn generated from Neurolucida reconstructions. To calculate the minimum cover set, the program first determined the number of near-neighbors for each thorn. A thornk was defined to be a near-neighbor of thorni if thornk was within a sphere centered on thorni with a radius of r. The exclusion zone includes the surface of the sphere, thus the sets of near-neighbors are open sets. This process was then repeated until all the thorns in the set thorn j = 1 to N were assigned a value for number of near-neighbors, where N equals the total number of thorns. The program then scanned the near neighbor set to find the thorn with the largest number of near neighbors. This thorn and all of its near neighbors defined the first element of the minimum cover set. The thorns contained in this cover set element were removed from the parent data set. Next, the thorn with the largest number of near neighbors among thorns remaining in the parent data set was identified. This thorn and all its neighbors defined the second element of the minimum cover set. As before, the thorns in this second element of the minimum cover set were removed from the parent data set. This process was reiterated until all thorns along the dendrite were accounted for, with the final number of elements being equal to the minimum cover set, or, restated, the minimum number of hypothetical giant mossy fiber boutons (hMFB) of a radius r required to cover every thorn on a segment of dendrite once and only once. The minimum cover set was then divided by the total number of thorns along the dendrite to give the cover fraction. Cover fraction is the number of hMFB’s required to cover one thorn, and is also a measure of thorn tendency to cluster. The more dispersed thorns are along the dendrite, the greater number of spheres will be required to cover all thorns on a dendrite, and the cover fraction will approach 1.0 (1 sphere covers only one thorn). Conversely, dendrites with highly clustered thorns will require fewer spheres to reach full coverage (1 sphere covers many thorns), and cover fraction approaches 0. For these analyses, r was set at 1, 1.4, 1.6, 2.0 and 2.2 μm. Finally, near neighbor values for each dendrite were used to calculate the mean number of near neighbors. These values can be viewed as reflecting the mean number of thorns per hMFB.
Analysis of GFP+ZnT-3 double-labeling
Endogenous GFP expression was used to identify CA3 pyramidal cell apical dendritic segments by an investigator blinded to treatment group. Analysis focused on cells with high thorn densities (thorn density >1.0/micron). Cells meeting this criterion were randomly selected for further analysis. Endogenous GFP expression and ZnT-3 immunolabeling were imaged using confocal microscopy (63X magnification, 6X optical zoom, 0.2μm step). Image stacks were imported into Neurolucida software and the association between individual thorns and ZnT-3 immunoreactive puncta (putative mossy fiber terminals) was determined. Thorns were assumed to be interacting if they were surrounded by or directly apposed to a ZnT-3 immunoreactive puncta. Once a single thorn was scored as interacting with a puncta, the borders of that puncta were defined within the x-, y- and z-axis. Any additional thorns contacting this puncta were then counted as well. Thorns that were not in apposition to a ZnT-3 immunoreactive puncta were counted as “orphan” thorns, and ZnT-3 immunoreactive puncta that were adjacent to the dendritic shaft – but not apposed to a thorn – were not scored. ZnT-3 puncta density along the shaft was determined by dividing the number of puncta contacting at least one thorn by the length of dendrite examined, and the number of thorns per puncta was calculated by dividing the total number of thorns (excluding orphan thorns) by the number of interacting puncta. This value was used to derive the cover fraction (# puncta to cover 100 thorns).
Statistics
Statistical analyses were run using either Sigma Stat software (version 2.03) or STATA (version 10.1 for MAC, StataCorp, College Station, TX). Parametric tests were used for normally distributed data with equal variance and non-parametric tests were used for data that violated these assumptions. Individual tests used are noted in the text. P-values less than 0.05 were considered significant. In all cases, except for analyses of cells with thorn densities greater than 1.0<micron, values for individual neurons were averaged to provide a mean score for each animal and statistical analyses were conducted using these animal means.
Figure preparation
Images are confocal maximum projections and were prepared using Leica’s LAS-AF Confocal software (1.3.1 build 525) and Adobe Photoshop (version 7.0). Images were processed using an erosion filter run for one iteration with a three pixel radius (Leica software) to reduce background artifact. Contrast and brightness were adjusted identically for images meant for comparison. Neuronal reconstructions from confocal image stacks were generated as described previously (Walter et al., 2007). Briefly, pseudocolor three-dimensional image stacks were processed to remove all structures not belonging to the target cell. The processed image was then superimposed on the original maximum projection (in a contrasting color) to reveal the target cell in the context of its surroundings. This processing is necessary to effectively present three-dimensional data in a two-dimensional format, and although composed of original confocal images, they should be viewed as neuronal reconstructions with the associated limitations.
3D renderings for figure 8 were produced by importing confocal image stacks into Slidebook 4.2 software (Intelligent Imaging Innovations, Boulder, CO.). Z-series image stacks were cropped to contain just the dendrite of interest together with a narrow region of surrounding ZnT-3 staining. They were Gaussian filtered with a 1.5 pixel kernel to improve image smoothness, and then volume rendered using Slidebook’s High Quality Dynamic Lighting module, with 75% opacity.
Figure 8.

Three-dimensional renderings of portions of CA3 apical dendrites from control animals and animals examined three months after status (3M SE). GFP expression (green) reveals the apical dendrites and thorny excrescences, while ZnT-3 immunostaining (red) reveals mossy fiber terminals. Panels show 3D renderings of dendrites alone (left), followed by the same stretches of dendrite co-labeled with anti-ZnT-3 antibodies. These merged images show rotations around the Y axis at 45° intervals. Note the low density of ZnT-3 immunoreactive puncta associated with the control dendrite relative to dendrites from 3M SE animals. Also note the large thorny excrescence (>10 μm) in the middle series, and the multiple puncta associated with it. Grid sizes are 5 μm for the top and bottom series, and 1 μm for the middle series.
Note to Editors/Reviews: Quick-time VR movies of the reconstructions were made, and we would be happy to provide these as supplemental data to allow independent exploration of the 3D volume data if it would be helpful.
Results
Giant mossy fiber bouton area and complexity are increased one and three months after status epilepticus
Giant bouton area and complexity were assessed in one and three month control mice, and mice collected one (1M SE) and three (3M SE) months after pilocarpine-induced status epilepticus. Analysis of the one month and three month control groups revealed that they were statistically equivalent for all parameters examined in the present study (t-test), so the two groups were pooled, and from here on are referred to as controls. A total of 222 giant boutons from fourteen control mice, 209 giant boutons from eight 1M SE mice and 135 boutons from seven 3M SE mice were examined. Mossy fiber bouton area was significantly increased in both groups of epileptic animals relative to controls (Fig. 2; P<0.001, ANOVA with Tukey’s post test). The frequency of giant boutons connected to “satellite” boutons by short axonal processes was also increased at both post-status time points relative to controls (Fig. 2; P<0.001, Kruskal-Wallis rank sum test with Dunn’s post test).
Figure 2.

Dentate granule cell giant mossy fiber bouton (MFB) area is significantly increased both one and three months after status epilepticus (SE) relative to controls. The percentage of giant boutons with satellites was also increased at both time points after status relative to controls. Confocal maximum projections depict a simple giant bouton from a control animal, and core boutons (core) with satellites (S) from animals one and three months after status. ***, P<0.001. Scale bar = 5 μm.
Thorny excrescence labeling in Thy1-GFP-expressing mice
GFP-labeling of CA3b pyramidal cell thorny excrescences in the Thy1-GFP line was robust, allowing for easy quantification of their numbers and complexity. A total of 50 cells were imaged from control animals, 33 cells from 1M SE animals and 26 cells from 3M SE animals. All CA3 pyramidal cells examined conformed to the morphology of “classical” CA3 pyramidal cells (Lorente de No, 1934; Amaral, 1978; Frotscher et al., 1988; Ishizuka et al., 1990, 1995; Li et al., 1994; Seress and Ribak, 1995; Buckmaster and Amaral, 2001). Cell bodies were located in the pyramidal cell layer and possessed one to three prominent apical dendrites (although a single cell with four apical dendrites was observed in a control). Apical dendrites projected through stratum lucidum, stratum radiatum and on into stratum lacunosum-moleculare. Basal dendrites projected into stratum oriens. These findings suggest that pyramidal cells labeled in the Thy1-GFP line are representative of the entire population; a conclusion consistent with previous work demonstrating that labeled dentate granule cells in this line are indistinguishable from granule cells labeled with other approaches (Vuksic et al., 2008).
The present study focused on segments of CA3 pyramidal cell apical dendrites contained within stratum lucidum, the projection field of granule cell mossy fiber axons and the principal localization of pyramidal cell thorny excrescences. Stratum lucidum is relatively thin − 50 μm or so – and correspondingly, only a small portion of a CA3 pyramidal cells’ apical dendritic tree is localized to this region. Pyramidal cell apical dendritic branches within this region were typically first, second or third order (Fig. 1). Fourth and fifth order branches were occasionally observed, but were not further analyzed due to their low incidence. Total dendritic length examined, broken down by branch order, was 758 μm (1st order), 1775 μm (2nd order) and 1800 μm (3rd order) for control neurons. For animals examined one month after status, 616 μm, 1441 μm and 1143 μm were scored for first, second and third order branches, respectively. Finally, 512 μm, 1276 μm and 884 μm were scored from animals collected three months after status.
Thorny excrescence density varies by branch order
Intriguingly, although the localization of first, second and third order branches to stratum lucidum renders them as potential targets for mossy fiber innervation, thorns were not distributed equally among segments. Specifically, comparisons of thorn density among branch orders for control animals revealed that density increased significantly with higher branch order (1st order, 0.370±0.237 thorns/μm; 2nd order, 1.000±0.394; 3rd order, 0.778±0.167; P=0.005 for 2nd and 3rd vs. 1st, Kruskal-Wallis rank sum test with Dunn’s post test). In light of these findings, comparisons between control and epileptic animals were made among equivalent branch orders.
Thorny excrescence density is transiently reduced following status epilepticus
One month after pilocarpine-induced status epilepticus, the density of thorns along 3rd order CA3 pyramidal cell dendritic segments was significantly reduced relative to pyramidal cells from control animals (Fig. 3; P=0.043, ANOVA with Tukey’s post test). Similar trends towards reduced thorn density were observed for 1st and 2nd order dendritic segments, although the effect did not reach significance (Figs. 3&4). Notably, the reduction in density along 3rd order segments was transient, and three months after status epilepticus thorn densities were statistically indistinguishable from controls (Fig. 3).
Figure 3.
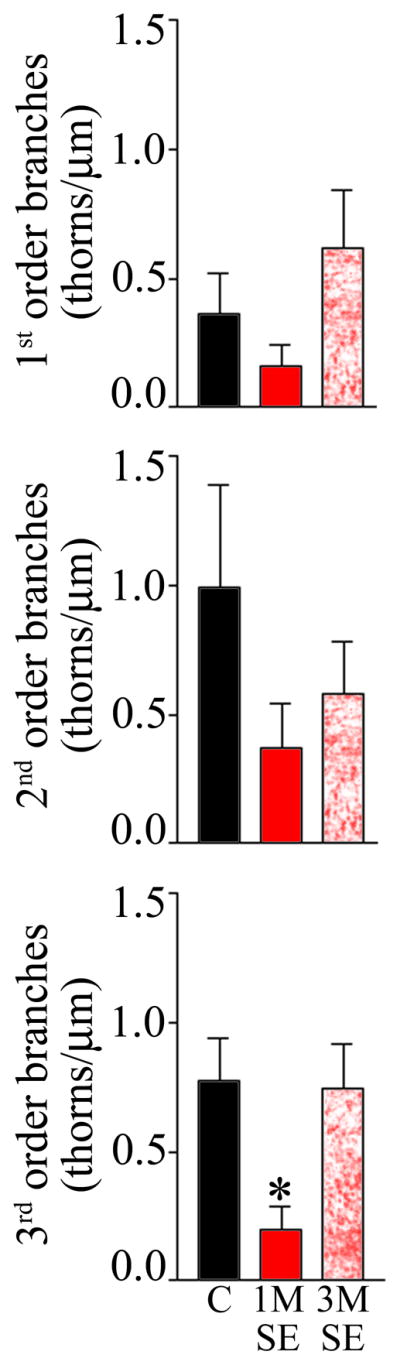
The density of thorns was significantly decreased along 3rd order dendritic segments one month after status epilepticus (SE) relative to control animals and animals examined three months after status. Similar reductions were observed for first and second order dendritic segments, although the effects did not reach significance.
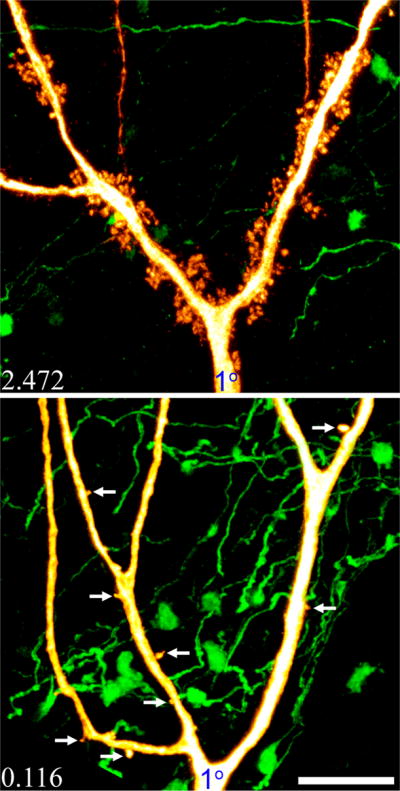
Figure 4.

Neuronal reconstructions showing apical dendritic segments from control animals and animals examined one (1M SE) and three (3M SE) months after status epilepticus (SE). Control animals, and animals examined three months after status occasionally exhibited dendrites with dramatic accumulations of thorny excrescences (B and F). In contrast, such large accumulations were rare one month after status, although occasional complex thorny excrescences were observed (D, arrow). Dendritic branch order (2° or 3°) is noted adjacent to the relevant dendritic segment. Thorn density for each neuron shown is noted in the lower right corner of each image (thorns/μm; values are for all branch orders combined). Scale bar = 10 μm.
Analysis of pyramidal cell variability in epileptic animals revealed that the reduction in thorn density evident one month after status epilepticus was due largely to the disappearance of pyramidal cells with high densities. While 23.7% (9 of 38) of pyramidal cells from control animals exhibited densities greater than 1 thorn/μm on 3rd order branches, none of the cells examined one month after status exhibited such high densities on 3rd order branches (0 of 20). Three months after status, cells with dense accumulations of thorns reappeared, making up 27.7% (5 of 18) of the cell population examined.
Altered thorn distribution three months after status epilepticus
Intriguingly, although thorn density was similar between control pyramidal cells and cells examined three months after status, casual observation suggested that the distribution of thorns was altered after status – particularly for cells with higher thorn densities. Specifically, while thorns along control dendrites tended to be highly clustered, thorns in animals examined three months after status were more evenly distributed (Fig. 5). Simple density measurements, however, failed to capture this phenomenon (e.g. ten clustered thorns produces the same overall density as ten evenly distributed thorns for a given length of dendrite), so two alternate strategies were developed to analyze the data. Analyses focused on pyramidal cells with thorn densities greater than 1.0/micron – seven from control animals and seven from 3M SE animals.
Figure 5.

A: Neurolucida reconstructions showing thorn distributions along pyramidal cells from control animals and animals examined three months after status epilepticus (3M SE). Note the tendency for individual thorns to form clusters along the dendrites of cells from control animals (several examples are circled), while cells from epileptic animals tend to exhibit a more even thorn distribution. B: Neurolucida reconstructions of representative giant mossy fiber boutons from control and 3M SE animals. Note that a single bouton is large enough to cover a cluster of thorns (red circles), but many boutons would be required to cover all of the thorns on a dendrite, particularly when individual thorns are separated by greater distances. Scale bar = 10 μm.
The first approach used to examine thorn distributions patterns involved calculating the mean distance between thorns along individual dendrites. The mean value for the distance between adjacent spines (nearest neighbors) was 0.806μm (95%CI 0.793 – 0.819) for cells from control animals and 0.880 μm (95%CI 0.860 – 0.900) for cells from animals examined three months after status epilepticus. The difference was significant (P<0.001), confirming qualitative impressions that thorn distributions differed.
To explore whether this difference might have biological significance, a second analytical approach was developed to predict that number of giant mossy fiber boutons that would be required to innervate the thorns in each data set. Briefly, the three-dimensional coordinates for each thorn were used to determine the minimum number of spheres with a radius r required to cover every thorn along a dendritic tree one time. This value is defined as the minimum cover set, and was developed as a new means for quantifying thorn distribution to better assess the unique innervation patterns of CA3 pyramidal cells by granule cell giant boutons. Basically, the minimum cover set can be viewed as a measure of the smallest number of hypothetical giant mossy fiber boutons (hMFB) of a given radius r that would be required to cover every thorn along a length of dendrite without overlap. Here, the cover set was normalized for each dendrite by dividing it by the total number of thorns to give the cover fraction; the number of hMFB’s required to cover one thorn. This analysis was also used to determine the mean number of thorns per hMFB of a given radius. Analyses were run with radii set to 1.0, 1.4, 1.6, 2.0 and 2.2. Middle values (1.4, 1.6 and 2.0) were selected to represent the range of giant bouton cross sectional areas observed in the present study (See table 1 for hMFB values; measured MFB values ranged from 4.47 μm2 to 13.56 μm2 for the present study). Low and high end r values correspond to giant bouton areas that would be outside the biological range observed here (too small or excessively large, respectively).
Table 1.
Thorn Cover Set Analysis
| hMFB Radius (μm) | hMFB Area (μm)2 | Mean number of thorns/hMFB ± standard deviation | Kruskal- Wallis rank sum test | Cover Fraction X 100 (# hMFB to cover 100 thorns) Median (range) | Mann- Whitney rank sum test | ||
|---|---|---|---|---|---|---|---|
| Control (N=7) | 3M SE (N=7) | p-value | Control (N=7) | 3M SE (N=7) | p-value | ||
| 1.0 | 3.14 | 2.95±0.48 | 2.65±0.42 | 0.159 | 43.2 (32–64) | 51.4 (45–72) | 0.073 |
| 1.4 | 6.15 | 5.11± 0.76 | 4.27± 0.64 | 0.025 | 28.4 (25–45) | 36.0 (31–53) | 0.038 |
| 1.6 | 8.04 | 6.29± 0.78 | 5.24± 0.80 | 0.029 | 24.1 (20–40) | 30.8 (25–43) | 0.038 |
| 2.0 | 12.57 | 8.95± 1.42 | 7.50± 1.20 | 0.047 | 17.2 (15–32) | 22.5 (18–35) | 0.026 |
| 2.2 | 15.21 | 10.40±1.69 | 8.66±1.48 | 0.064 | 16.1 (14–27) | 18.7 (14–31) | 0.073 |
Thorn cover set analysis for CA3 pyramidal cells with thorn densities > 1/μm. Radii used to generate cover sets are given in column 1. Corresponding hypothetical giant mossy fiber bouton (hMFB) areas are shown in column 2. Significant values are in bold. Note that while cover fraction and mean number thorns/hMFB are correlated they cannot be directly converted from one to the other.
Minimum cover set analysis revealed a significant difference between control and 3M SE animals when r was set to biologically relevant values (table 1; r=1.4, 1.6 or 2.0). Cover fraction was significantly higher in 3M SE animals relative to control animals, indicating that thorns were more dispersed, and suggesting that a greater number of giant boutons would be required to cover all thorns present. These differences were present even though overall thorn density was statistically identical between the two groups (control, 2.59±0.34; 3M SE, 2.50±0.41; P=0.867, t-test), leading to a second finding: The mean number of thorns per hMFB significantly decreased in 3M SE animals for r=1.4, 1.6 or 2.0 (if cover fraction rises while thorn density remains the same, thorns/hMFB must drop; table 1). By contrast, significant differences vanished when r was set at values that would reflect giant boutons either too large or too small to be biologically relevant (table 1), indicating that the findings are not arbitrary in nature.
Pyramidal cells from epileptic animals are innervated by greater numbers of giant boutons
To test the prediction that altered thorn distribution in animals exposed to status reflects input by larger numbers of giant mossy fiber boutons, a method for simultaneous labeling of pyramidal cell thorny excrescences and apposed granule cell giant boutons was needed. Unfortunately, the Timm stain – a reliable histochemical method used to label mossy fiber axons based on their high zinc content – is not readily adaptable to dual labeling approaches, and antibodies for brain-derived neurotrophic factor (BDNF) and neuropeptide Y, albeit promising (Scharfman et al., 2002), only labeled a subset of GFP-expressing giant boutons (Danzer et al., 2004; S.C. Danzer, unpublished observations). A novel approach for revealing giant boutons was therefore developed using antibodies targeted against the zinc transporter, ZnT-3. Grossly, Znt-3 immunostaining produced a pattern of labeling virtually identical to the Timm stain (Fig. 6, A). When the approach was tested by examining GFP-labeled giant boutons and ZnT-3 immunoreactive puncta, and almost perfect correspondence was observed (Fig. 6, B & C). Specifically, of 147 GFP-expressing giant boutons examined (63 control, 84 3M SE), 145 were ZnT-3 positive (98.6%). Moreover, ZnT-3 labeling roughly corresponded to the borders of the giant boutons, as revealed by the GFP label. These data confirmed that Znt-3 immunostaining can be used as a reliable marker of granule cells giant mossy fiber boutons.
Figure 6.

A: Confocal maximum projection showing GFP-expressing hippocampal granule cells and CA3 pyramidal cells (green) and ZnT-3 immunolabeling (blue). B: Confocal images of GFP-expressing giant mossy fiber boutons from control animals. Maximum projections throughout the z-depth of the GFP-expressing boutons are shown on the left, while single optical sections are shown in the middle and right columns. Note the pronounced colocalization of ZnT-3 immunoreactivity to the GFP-expressing boutons. C: Confocal maximum projection of a large giant bouton with satellites located in stratum oriens of a 3M SE animal (top). The core bouton (core) and satellites (S) are marked accordingly. ZnT-3 immunostaining alone and merged projections through the mid-region of this bouton are shown below. Scale bar for A= 300 μm; B & C= 5 μm.
Casual analysis of ZnT-3 immunolabeling in GFP expressing brain sections yielded several intriguing findings. Firstly, a tight correspondence between GFP-labeled thorns and ZnT-3 immunoreactive puncta was readily apparent (Figs. 7&8). This was particularly true for the elaborate thorny excrescences, which were invariably associated with ZnT-3 immunoreactive puncta. By contrast, although most isolated thorns were also associated with immunoreactive puncta (Fig. 7, middle row), this was not always the case (not shown), and 16.0±5.3% of thorns from controls, and 11.3±2.1% of thorns from 3M SE animals (P=0.368, t-test) were not apposed to immunoreactive puncta. Whether these thorns reflect silent synapses, input from cell populations other than granule cells, or other factors is not clear; however, given the nearly perfect correlation between ZnT-3 labeling and mossy fiber terminals, it seems unlikely that these thorns receive mossy fiber input.
Figure 7.

Pseudocolored maximum projections of GFP-expressing CA3 pyramidal cells (red) and passing granule cell mossy fiber axons (green) are shown in the left column. Middle and right columns show ZnT-3 immunolabeling and merged ZnT-3+GFP labeling. The z-depth represented by these images is 3.0, 2.0 and 1.2 μm from top to bottom, respectively. Arrows denote thorns colocalized with ZnT-3 immunoreactive puncta. Asterisk denotes a GFP-expressing, ZnT-3 immunoreactive giant bouton. Scale bar = 5 μm.
To estimate the number of giant boutons innervating segments of CA3 pyramidal cell dendrites with thorn densities greater than 1.0/micron, 12 GFP-expressing cells from control animals and 16 from 3M SE animals were imaged from brain sections stained with ZnT-3 antibodies. GFP-labeled thorns were identified, and the number of thorns per ZnT-3 immunoreactive puncta, and the number of puncta per dendrite was determined. While thorn density did not differ between groups (control, 2.45±0.21; 3M SE, 2.90±0.38; P=0.350, t-test), the number of ZnT-3 puncta/10 μm of dendrite was significantly increased three months after status (control, 2.64±0.38; 3M SE, 4.92±0.33; P<0.001, t-test). Correspondingly, with more puncta, but relatively similar numbers of thorns, the number of thorns per puncta was significantly reduced (control, 10.74±1.95; 3M SE, 5.09±0.38; P=0.039, Mann-Whitney RST). Finally, the cover fraction (# puncta to cover 100 thorns) increased significantly from 14.00±2.71 (control) to 21.28±1.52 (3M SE; P=0.02, t-test). Together, these data provide independent support for the conclusion that in epileptic animals, although overall thorn density is preserved, the pattern of innervation shifts towards larger numbers of giant boutons contacting fewer thorns.
Evidence for cell intrinsic rather than regional regulation of CA3 pyramidal cells thorn density
Finally, we sought to explore whether neuronal plasticity among cells with high thorn densities might be regulated by cell intrinsic or regional factors. To begin to address this issue, we first compared thorn density between different branches of the same cell. CA3 pyramidal cells frequently project several dendritic branches through stratum lucidum, and these branches are often separated by tens of microns. Apical dendritic branches from the same cell, therefore, may encounter different local environments. If local factors predominate in regulating the density of thorns, different branches belonging to the same neuron may vary considerably. Alternatively, if thorn density for a given neuron is regulated by intrinsic factors, different branches would be predicted to be similar despite physical separation. To explore these different scenarios, a subset of CA3 pyramidal cells for which multiple dendritic trees were present in stratum lucidum was analyzed. Despite striking variability among pyramidal cells present in the same tissue sections (Fig. 9), thorn densities on distinct dendritic trees belonging to the same cells were highly correlated (Fig. 10). Significant correlations were evident both for neurons from control animals (R=0.982, P<0.0001, Pearson Product Moment Correlation, N=30) and epileptic animals (1M SE, N=22, R=0.932, P<0.0001; 3M SE, N=9, R=0.988, P<0.0001). By contrast, regional factors were not predictive of thorn density. Density was not significantly correlated with a cell’s bregma coordinates (Paxinos and Franklin, 2001), medial-lateral position within CA3b (measured relative to the dentate granule cell layer) or soma depth within the pyramidal cell layer for either control (Supplemental Table 1) or epileptic groups (not shown). As a last note, no obvious associations between dendritic structure and thorn density were found (Supplemental Table 1). Taken together, these finding suggest that pyramidal cell thorn density is regulated on a cell-by-cell, rather than a regional basis. That said, the present study was deliberately designed to select cells from relatively restricted anterior-posterior positions and pyramidal cell layer subregions (to reduce variability and increase the likelihood of detecting differences between control and epileptic animals). Whether comparisons between more disparate regions (e.g. CA3a vs. CA3c) would produce different results is not known.
Figure 9.

Adjacent CA3b pyramidal cells can exhibit dramatically different thorn densities. A: Pseudocolored confocal maximum projection showing GFP-labeling in the hippocampus of a control Thy1-GFP-expressing mouse. Dentate granule cells (dg) and CA1 pyramidal cells (CA1) are labeled in addition to CA3 pyramidal cells in these animals. Blue coloring highlights stratum lucidum, the projection pathway of granule cell mossy fiber axons and the region where CA3 pyramidal cells exhibit thorny excrescences. Arrows denote two adjacent CA3b pyramidal cells, which are shown at high resolution in the reconstruction presented in B. B: Neuronal reconstructions of adjacent CA3b pyramidal cell apical dendrites with sparse (left) and dense (right) accumulations of thorns. Examples of simple thorny excrescences on both cells are denoted by arrowheads, while the bracket denotes a group of complex thorny excrescences (right). Scale bars: A= 300 μm; B=10 μm.
Figure 10.
The density of thorns along different branches of the same dendritic tree is highly correlated. Images show neuronal reconstructions of two different pyramidal cells, one with a high density of thorns (top, control) and one with low density (bottom, 3M SE). Arrows denote thorny excrescences with single thorns in the lower image. Note that even branches separated by 10’s of microns exhibit similar thorn densities. Average thorn density for each cell is given in the lower left corner of each image. Scale bar = 10 μm.
Status epilepticus does not alter the distribution of GFP expressing cells
In the present study, CA3 pyramidal cells were labeled using the Thy1-GFP mouse line. Previous studies of hippocampal granule cells suggest that seizures do not alter the pattern of GFP labeling in these animals (Danzer and McNamara, 2004; Walter et al., 2007; Danzer et al., 2009). To insure that this was also true for CA3 pyramidal cells, we examined the number and distribution of labeled cells in these animals. Counts of GFP-expressing CA3b pyramidal cells in dorsal hippocampus revealed a non-significant decrease in pilocarpine-treated animals relative to controls (control, 0.42±0.08 GFP-expressing pyramids/hippocampus; 1M SE, 0.34±0.13; 3M SE, 0.33±13; P=0.350, ANOVA on ranks), as would be expected given the well-established sensitivity of pyramidal cells to seizure-induced death (Shibley and Smith, 2002; Borges et al., 2003). The data suggests the perhaps as many as 20% of GFP expressing CA3 pyramidal cells are lost following pilocarpine treatment (note that due to the low density of GFP expressing pyramids – perhaps 1% – detecting such a small change would require a prohibitively large number of animals. Thus, the negative finding here should be interpreted cautiously). Most importantly for the present study, the predicted direction and small size of the change suggests that seizure activity is not dramatically altering GFP expression (e.g. a two-fold increase would be readily detectable with >80% statistical power).
As an additional measure to insure against the possibility of bias introduced by changes in GFP expression, the regional distribution of pyramidal cells used for thorn density counts was examined. Pyramidal cells were found at equivalent bregma coordinates (control, −2.39±0.04; 1M SE, −2.28±0.08; 3M SE, −2.34±0.07; P=0.43, ANOVA), equivalent distances from the granule cell layer (control, 544±31 μm; 1M SE, 506±38 μm; 3M SE, 549±47 μm; P=0.695, ANOVA) and equivalent depths with the pyramidal cell layer (control, 45.0±4.6%; 1M SE, 42.2±5.0%; 3M SE, 43.5±6.0%; P=0.898, Kruskal-Wallis rank sum test; values were normalized by dividing the distance of the soma from stratum lucidum by the total thickness of the pyramidal cell layer, and are expressed as percentages). In summary, although selective cell loss could contribute to the current findings; similar number and distribution of GFP labeled cells in control and treated animals supports the conclusion that Thy1 driven GFP expression is a reliable and consistent marker of CA3 pyramidal cells.
Discussion
For the present study, dentate granule cell giant mossy fiber bouton structure and CA3 pyramidal cell thorn density were assessed in control animals and animals examined one and three months after status epilepticus. Both the pre- and postsynaptic components of the granule cell≫pyramidal cell connection exhibited striking plastic changes after status. Granule cell presynaptic giant boutons were larger and possessed satellites with significantly greater frequency at both time points. CA3 pyramidal cell thorn density, on the other hand, was reduced one month after status and returned to control levels at three months. Further examination, however, revealed that while thorns tended to be highly clustered in control animals, three months after status thorns were more evenly distributed, possibly reflecting a shift towards greater numbers of giant boutons innervating a given pyramidal cell via fewer thorns at each contact point. Double-label analyses of GFP-expressing thorns and ZnT-3 immunoreactive giant boutons confirmed this prediction, demonstrating a persistent rearrangement of granule cell≫CA3 pyramidal cell connectivity in the epileptic brain.
Mechanisms of synaptic plasticity within stratum lucidum
Altered connectivity in the epileptic brain was demonstrated using two independent approaches (statistical modeling of thorn distribution patterns and direct observation of giant bouton-thorn relationships). The similar results produced by both approaches, and the de facto replication of the finding in separate study groups demonstrates the robust nature of these changes. The underlying cellular mechanisms, however, have yet to be fully elucidated, although several possibilities seem likely. Firstly, the increase in granule cell giant bouton satellite frequency almost certainly contributes to the rise in the density of boutons innervating CA3 pyramids. The percentage of giant boutons with satellites increased from around 2% in control animals, to nearly 20% in animals examined three months after status (Fig. 2). Extending 10’s of microns from the core giant bouton (see figure 6C), these satellites could easily innervate either the same pyramidal cell as the core bouton, or neighboring pyramidal cells. Moreover, since the spacing between giant boutons/bouton with satellites is similar in control and epileptic animals in CA3b (roughly every 100μm; Danzer et al., 2009); an increase in the interval between these structures would not appear to offset the increase in satellites at each point. Giant mossy fiber boutons stimulate the formation of thorny excrescences (Amaral and Dent, 1981; Nowakowski and Davis, 1985; Represa et al., 1991; Gaiarsa et al., 1992 ; Robain et al., 1994), so satellite formation would be predicted to lead to de novo formation of thorns. Indeed, it is tempting to speculate that this process contributes to the recovery in thorn density evident between one and three months after status. A second contributing process may be granule cell neurogenesis. Status epilepticus is a potent neurogeneic stimuli, leading to the production of large numbers of new granule cells (Parent et al., 2006; Parent, 2007). Many of these new granule cells survive and integrate into the hippocampus (van Praag et al., 2002; Espósito et al., 2005; Laplagne et al., 2006; Toni et al., 2008), forming giant boutons and innervating CA3 pyramids. Thirdly, thorn retraction (and formation) may be important (Drakew et al., 1996; Jiang et al., 1998; Swann et al., 2000). Altered thorn distribution but preserved thorn densities may reflect thorn loss in some regions of the dendritic tree and new thorn formation in other regions. Finally, a role for selective death of CA3 pyramids cannot be excluded. The pilocarpine-status epilepticus model results in some CA3 pyramidal cell death (Mello et al., 1993; Shibley and Smith, 2002; Borges et al., 2003; Danzer et al., 2009; Zhang et al., 2009), and it is conceivable that pyramidal cells with highly clustered thorns, for example, are more vulnerable to excitotoxic injury. Loss of cells with specific anatomical features could produce a shift in the observed properties of the surviving population.
Significance of altered patterns of pyramidal cell innervation by dentate granule cells
The present study demonstrates an increase in the density of giant boutons contacting pyramidal cells dendrites, and a corresponding decrease in the number of thorns contacted by each bouton. The resulting preservation of overall thorn density is intriguing, and raises the possibility that the shift reflects homeostatic mechanisms aimed at maintaining normal activity levels. Notably, however, the shift implies a reduction in thorny excrescence complexity in these animals, and this complexity may have functional significance. Indeed, Reid and colleagues (2001 Indeed, Reid and colleagues (2002) have suggested that the complexity of thorny excrescences gives the granule cell≫CA3 pyramidal cell synapse a broad dynamic range relative to simple spine synapses, and the reduction in the number of thorns contacted by each bouton – by about 50% here – would presumably reduce this range, perhaps limiting normal plasticity at this synapse. Consistent with this idea, slices from epileptic animals exhibit a loss of paired-pulse facilitation, augmentation and long-term potentiation (Goussakov et al., 2000).
Another question raised by the present findings is whether increased density of innervating giant boutons reflects novel inputs from previously unconnected granule cells, or additional inputs from granule cells that were already innervating the pyramid in question. In the former case, increasing the number of granule cells converging onto a given pyramidal cell might be expected to dramatically alter the gating and/or information processing capabilities of the hippocampus. A change of this nature could promote seizure spread through the hippocampus by creating high throughput pathways, or by recruiting pyramidal cells into an epileptic circuit. In the latter case, granule cells that form satellites would use these structures to innervate their target pyramidal cell at multiple points. This contrasts with the control situation, in which most granule cells innervate target CA3 pyramids one time, at one point (via their only giant bouton in the region; Acsàdy et al., 1998). Whether single inputs to large numbers of thorns are more or less effective than multiple inputs to fewer thorns is currently unknown.
Clearly, determining the functional impact of the plastic changes identified here, and whether they reflect homeostatic processes, pathological changes or some combination thereof will ultimately require direct physiological measurements. Nonetheless, it is worth pointing out that the epileptic brain is characterized by hyperexcitability and persistent deficits in hippocampal dependant learning tasks (Leite et al., 1990; Chauvière et al., 2009; Müller et al., 2009), which suggests that homeostatic processes, if operable, are only partially effective.
CA3 pyramidal cells exhibit striking variability in mossy fiber innervation
An unexpected finding of the present study was the profound variability in the density of thorns exhibited even by adjacent pyramidal cells (Fig. 9). This variability is remarkable given the relative homogeneity of spine densities exhibited by other neuronal types. Dentate granule cell spine densities, for example, vary by a factor of less than 10 from neuron to neuron (Pun, Murphy and Danzer, unpublished observations). In contrast, thorn density varied by more than a factor of 300 for control neurons (range 0.013 to 4.668 thorns/μm; all branch orders combined). This variability has not been previously appreciated, perhaps due to the difficulty with older approaches in quantifying excrescences. It is also possible that pyramidal cells with particularly low densities of excrescences observed here are specific to mouse. Studies in primates (Frotscher et al., 1988; Buckmaster and Amaral, 2001) suggest that thorny excrescences in these higher mammals are more complicated than those described in rat (Fitch et al., 1989), and rat excrescences may similarly exceed mouse excrescences in complexity. Finally, although we were unable to identify any morphological or regional features that might account for the variability in thorn density among neurons, it is notable that 1) adjacent pyramidal cells can exhibit widely varying excrescence densities and 2) adjacent branches of the same pyramidal cell exhibit highly correlated densities. These observations imply that mossy fibers preferentially innervate certain pyramidal cells, while avoiding even closely adjacent cells. A further implication of this observation is that there are significant functional differences among pyramidal cells, although physiological studies will be required to fully explore this idea.
Summary
The cellular bases of temporal lobe epilepsy, and the nature of the disruptions leading to co-morbid conditions in epilepsy, such as cognitive impairment, have not been fully elucidated. Although changes occurring within the dentate gyrus (e.g. mossy fiber sprouting) have been known for decades (Tauck and Nadler, 1985; Sutula et al., 1989; Nadler 2003), plasticity of granule cell≫CA3 pyramidal cell connections has been less intensely explored. Here, we demonstrate a remarkable restructuring of granule cell≫CA3 pyramidal cell contacts. Given that this is a pivotal synapse in the classic hippocampal “trisynaptic circuit” we predict that these changes may be indicative of important functional changes occurring within the hippocampus.
Supplementary Material
Acknowledgments
This work was supported by Cincinnati Children’s Hospital Medical Center, the Epilepsy Foundation of America and the National Institute of Neurological Disorders and Stroke (SCD; Award Numbers R01-NS-065020 and R01-NS-062806). The content is solely the responsibility of the authors and does not necessarily represent the official views of the National Institute of Neurological Disorders and Stroke or the National Institutes of Health. Thy1-GFP mice were generously provided by Dr. Guoping Feng (Duke University, Durham, North Carolina). We would also like to thank Keri Kaeding for useful comments on earlier versions of this manuscript.
References
- Acsády L, Kamondi A, Sík A, Freund T, Buzsáki G. GABAergic cells are the major postsynaptic targets of mossy fibers in the rat hippocampus. J Neurosci. 1998;18(9):3386–403. doi: 10.1523/JNEUROSCI.18-09-03386.1998. [DOI] [PMC free article] [PubMed] [Google Scholar]
- Amaral DG. A Golgi study of cell types in the hilar region of the hippocampus in the rat. J Comp Neurol. 1978;182(4 Pt 2):851–914. doi: 10.1002/cne.901820508. [DOI] [PubMed] [Google Scholar]
- Amaral DG, Dent JA. Development of the mossy fibers of the dentate gyrus: I. A light and electron microscopic study of the mossy fibers and their expansions. J Comp Neurol. 1981;195(1):51–86. doi: 10.1002/cne.901950106. [DOI] [PubMed] [Google Scholar]
- Blackstad TW, Kjaerheim A. Special axo-dendritic synapses in the hippocampal cortex: electron and light microscopic studies on the layer of mossy fibers. J Comp Neurol. 1961;117:133–59. doi: 10.1002/cne.901170202. [DOI] [PubMed] [Google Scholar]
- Borges K, Gearing M, McDermott DL, Smith AB, Almonte AG, Wainer BH, Dingledine R. Neuronal and glial pathological changes during epileptogenesis in the mouse pilocarpine model. Exp Neurol. 2003;182(1):21–34. doi: 10.1016/s0014-4886(03)00086-4. [DOI] [PubMed] [Google Scholar]
- Buckmaster PS, Amaral DG. Intracellular recording and labeling of mossy cells and proximal CA3 pyramidal cells in macaque monkeys. J Comp Neurol. 2001;430(2):264–81. doi: 10.1002/1096-9861(20010205)430:2<264::aid-cne1030>3.0.co;2-3. [DOI] [PubMed] [Google Scholar]
- Chauvière L, Rafrafi N, Thinus-Blanc C, Bartolomei F, Esclapez M, Bernard C. Early deficits in spatial memory and theta rhythm in experimental temporal lobe epilepsy. J Neurosci. 2009;29(17):5402–10. doi: 10.1523/JNEUROSCI.4699-08.2009. [DOI] [PMC free article] [PubMed] [Google Scholar]
- Chicurel ME, Harris KM. Three-dimensional analysis of the structure and composition of CA3 branched dendritic spines and their synaptic relationships with mossy fiber boutons in the rat hippocampus. J Comp Neurol. 1992;325(2):169–82. doi: 10.1002/cne.903250204. [DOI] [PubMed] [Google Scholar]
- Claiborne BJ, Amaral DG, Cowan WM. A light and electron microscopic analysis of the mossy fibers of the rat dentate gyrus. J Comp Neurol. 1986;246(4):435–58. doi: 10.1002/cne.902460403. [DOI] [PubMed] [Google Scholar]
- Danzer SC, McNamara JO. Localization of brain-derived neurotrophic factor to distinct terminals of mossy fiber axons implies regulation of both excitation and feedforward inhibition of CA3 pyramidal cells. J Neurosci. 2004;24(50):11346–55. doi: 10.1523/JNEUROSCI.3846-04.2004. [DOI] [PMC free article] [PubMed] [Google Scholar]
- Danzer SC, Kotloski RJ, Walter C, Hughes M, McNamara JO. Altered morphology of hippocampal dentate granule cell presynaptic and postsynaptic terminals following conditional deletion of TrkB. Hippocampus. 2008;18(7):668–78. doi: 10.1002/hipo.20426. [DOI] [PMC free article] [PubMed] [Google Scholar]
- Danzer SC, He XP, Loepke AW, McNamara JO. Structural plasticity of dentate granule cell presynaptic terminals during the development of limbic epilepsy. Hippocampus. 2009 doi: 10.1002/hipo.20589. in press. [DOI] [PMC free article] [PubMed] [Google Scholar]
- Drakew A, Müller M, Gähwiler BH, Thompson SM, Frotscher M. Spine loss in experimental epilepsy: quantitative light and electron microscopic analysis of intracellularly stained CA3 pyramidal cells in hippocampal slice cultures. Neuroscience. 1996;70(1):31–45. doi: 10.1016/0306-4522(95)00379-w. [DOI] [PubMed] [Google Scholar]
- Espósito MS, Piatti VC, Laplagne DA, Morgenstern NA, Ferrari CC, Pitossi FJ, Schinder AF. Neuronal differentiation in the adult hippocampus recapitulates embryonic development. J Neurosci. 2005;25(44):10074–86. doi: 10.1523/JNEUROSCI.3114-05.2005. [DOI] [PMC free article] [PubMed] [Google Scholar]
- Feng G, Mellor RH, Bernstein M, Keller-Peck C, Nguyen QT, Wallace M, Nerbonne JM, Lichtman JW, Sanes JR. Imaging neuronal subsets in transgenic mice expressing multiple spectral variants of GFP. Neuron. 2000;28(1):41–51. doi: 10.1016/s0896-6273(00)00084-2. [DOI] [PubMed] [Google Scholar]
- Fitch JM, Juraska JM, Washington LW. The dendritic morphology of pyramidal neurons in the rat hippocampal CA3 area. I. Cell types. Brain Res. 1989;479(1):105–14. doi: 10.1016/0006-8993(89)91340-1. [DOI] [PubMed] [Google Scholar]
- Frotscher M, Kraft J, Zorn U. Fine structure of identified neurons in the primate hippocampus: a combined Golgi/EM study in the baboon. J Comp Neurol. 1988;275(2):254–70. doi: 10.1002/cne.902750207. [DOI] [PubMed] [Google Scholar]
- Galimberti I, Gogolla N, Alberi S, Santos AF, Muller D, Caroni P. Long-term rearrangements of hippocampal mossy fiber terminal connectivity in the adult regulated by experience. Neuron. 2006;50(5):749–63. doi: 10.1016/j.neuron.2006.04.026. [DOI] [PubMed] [Google Scholar]
- Gaiarsa JL, Beaudoin M, Ben-Ari Y. Effect of neonatal degranulation on the morphological development of rat CA3 pyramidal neurons: inductive role of mossy fibers on the formation of thorny excrescences. J Comp Neurol. 1992;321(4):612–25. doi: 10.1002/cne.903210408. [DOI] [PubMed] [Google Scholar]
- Goussakov IV, Fink K, Elger CE, Beck H. Metaplasticity of mossy fiber synaptic transmission involves altered release probability. J Neurosci. 2000;20(9):3434–41. doi: 10.1523/JNEUROSCI.20-09-03434.2000. [DOI] [PMC free article] [PubMed] [Google Scholar]
- Gonzales RB, DeLeon Galvan CJ, Rangel YM, Claiborne BJ. Distribution of thorny excrescences on CA3 pyramidal neurons in the rat hippocampus. J Comp Neurol. 2001;430(3):357–68. doi: 10.1002/1096-9861(20010212)430:3<357::aid-cne1036>3.0.co;2-k. [DOI] [PubMed] [Google Scholar]
- Henze DA, Wittner L, Buzsáki G. Single granule cells reliably discharge targets in the hippocampal CA3 network in vivo. Nat Neurosci. 2002;5(8):790–5. doi: 10.1038/nn887. [DOI] [PubMed] [Google Scholar]
- Howell K, Hopkins N, Mcloughlin P. Combined confocal microscopy and stereology: a highly efficient and unbiased approach to quantitative structural measurement in tissues. Exp Physiol. 2002;87(6):747–56. doi: 10.1113/eph8702477. [DOI] [PubMed] [Google Scholar]
- Hsu The dentate gyrus as a filter or gate: a look back and a look ahead. Prog Brain Res. 2007;163:601–13. doi: 10.1016/S0079-6123(07)63032-5. [DOI] [PubMed] [Google Scholar]
- Ishizuka N, Weber J, Amaral DG. Organization of intrahippocampal projections originating from CA3 pyramidal cells in the rat. J Comp Neurol. 1990;295(4):580–623. doi: 10.1002/cne.902950407. [DOI] [PubMed] [Google Scholar]
- Ishizuka N, Cowan WM, Amaral DG. A quantitative analysis of the dendritic organization of pyramidal cells in the rat hippocampus. J Comp Neurol. 1995 Nov 6;362(1):17–45. doi: 10.1002/cne.903620103. [DOI] [PubMed] [Google Scholar]
- Jiang M, Lee CL, Smith KL, Swann JW. Spine loss and other persistent alterations of hippocampal pyramidal cell dendrites in a model of early-onset epilepsy. J Neurosci. 1998;18(20):8356–68. doi: 10.1523/JNEUROSCI.18-20-08356.1998. [DOI] [PMC free article] [PubMed] [Google Scholar]
- Laplagne DA, Espósito MS, Piatti VC, Morgenstern NA, Zhao C, van Praag H, Gage FH, Schinder AF. Functional convergence of neurons generated in the developing and adult hippocampus. PLoS Biol. 2006;4(12):e409. doi: 10.1371/journal.pbio.0040409. [DOI] [PMC free article] [PubMed] [Google Scholar]
- Lauer M, Senitz D. Dendritic excrescences seem to characterize hippocampal CA3 pyramidal neurons in humans. J Neural Transm. 2006;113(10):1469–75. doi: 10.1007/s00702-005-0428-8. [DOI] [PubMed] [Google Scholar]
- Lawrence JJ, McBain CJ. Interneuron diversity series: containing the detonation-- feedforward inhibition in the CA3 hippocampus. Trends Neurosci. 2003;26(11):631–40. doi: 10.1016/j.tins.2003.09.007. [DOI] [PubMed] [Google Scholar]
- Leite JP, Nakamura EM, Lemos T, Masur J, Cavalheiro EA. Learning impairment in chronic epileptic rats following pilocarpine-induced status epilepticus. Braz J Med Biol Res. 1990;23(8):681–3. [PubMed] [Google Scholar]
- Li XG, Somogyi P, Ylinen A, Buzsáki G. The hippocampal CA3 network: an in vivo intracellular labeling study. J Comp Neurol. 1994;339(2):181–208. doi: 10.1002/cne.903390204. [DOI] [PubMed] [Google Scholar]
- Lorente de Nó R. Studies on the structure of the cerebral cortex. II. Continuation of the study of the ammonic system. J Psychol Neurol (Lpz) 1934;46:113–177. [Google Scholar]
- Mello LE, Cavalheiro EA, Tan AM, Kupfer WR, Pretorius JK, Babb TL, Finch DM. Circuit mechanisms of seizures in the pilocarpine model of chronic epilepsy: cell loss and mossy fiber sprouting. Epilepsia. 1993;34(6):985–95. doi: 10.1111/j.1528-1157.1993.tb02123.x. [DOI] [PubMed] [Google Scholar]
- Müller CJ, Gröticke I, Bankstahl M, Löscher W. Behavioral and cognitive alterations, spontaneous seizures, and neuropathology developing after a pilocarpine-induced status epilepticus in C57BL/6 mice. Exp Neurol. 2009;219(1):284–97. doi: 10.1016/j.expneurol.2009.05.035. [DOI] [PubMed] [Google Scholar]
- Nadler JV. The recurrent mossy fiber pathway of the epileptic brain. Neurochem Res. 2003;28(11):1649–58. doi: 10.1023/a:1026004904199. [DOI] [PubMed] [Google Scholar]
- Nowakowski RS, Davis TL. Dendritic arbors and dendritic excrescences of abnormally positioned neurons in area CA3c of mice carrying the mutation “hippocampal lamination defect”. J Comp Neurol. 1985;239(3):267–75. doi: 10.1002/cne.902390303. [DOI] [PubMed] [Google Scholar]
- Parent JM, Elliott RC, Pleasure SJ, Barbaro NM, Lowenstein DH. Aberrant seizure-induced neurogenesis in experimental temporal lobe epilepsy. Ann Neurol. 2006;59(1):81–91. doi: 10.1002/ana.20699. [DOI] [PubMed] [Google Scholar]
- Parent JM. Adult neurogenesis in the intact and epileptic dentate gyrus. Prog Brain Res. 2007;163:529–40. doi: 10.1016/S0079-6123(07)63028-3. [DOI] [PubMed] [Google Scholar]
- Paxinos G, Franklin KB. The Mouse Brain in Stereotaxic Coordinates. Academic Press; London: 2001. [Google Scholar]
- Peterson DA. Quantitative histology using confocal microscopy: implementation of unbiased stereology procedures. Methods. 1999;18(4):493–507. doi: 10.1006/meth.1999.0818. [DOI] [PubMed] [Google Scholar]
- Pierce JP, Milner TA. Parallel increases in the synaptic and surface areas of mossy fiber terminals following seizure induction. Synapse. 2001;39(3):249–56. doi: 10.1002/1098-2396(20010301)39:3<249::AID-SYN1006>3.0.CO;2-5. [DOI] [PubMed] [Google Scholar]
- Reid CA. The role of dendritic spines: comparing the complex with the simple. Eur J Pharmacol. 2002;447(2–3):173–6. doi: 10.1016/s0014-2999(02)01841-1. [DOI] [PubMed] [Google Scholar]
- Reid CA, Fabian-Fine R, Fine A. Postsynaptic calcium transients evoked by activation of individual hippocampal mossy fiber synapses. J Neurosci. 2001;21(7):2206–14. doi: 10.1523/JNEUROSCI.21-07-02206.2001. [DOI] [PMC free article] [PubMed] [Google Scholar]
- Represa A, Dessi F, Beaudoin M, Ben-Ari Y. Effects of neonatal gamma-ray irradiation on rat hippocampus--I. Postnatal maturation of hippocampal cells. Neuroscience. 1991;42(1):137–50. doi: 10.1016/0306-4522(91)90154-g. [DOI] [PubMed] [Google Scholar]
- Robain O, Barbin G, Billette de Villemeur T, Jardin L, Jahchan T, Ben-Ari Y. Development of mossy fiber synapses in hippocampal slice culture. Brain Res Dev Brain Res. 1994;80(1–2):244–50. doi: 10.1016/0165-3806(94)90109-0. [DOI] [PubMed] [Google Scholar]
- Rollenhagen A, Sätzler K, Rodríguez EP, Jonas P, Frotscher M, Lübke JH. Structural determinants of transmission at large hippocampal mossy fiber synapses. J Neurosci. 2007;27(39):10434–44. doi: 10.1523/JNEUROSCI.1946-07.2007. [DOI] [PMC free article] [PubMed] [Google Scholar]
- Scharfman HE, Sollas AL, Smith KL, Jackson MB, Goodman JH. Structural and functional asymmetry in the normal and epileptic rat dentate gyrus. J Comp Neurol. 2002;454(4):424–39. doi: 10.1002/cne.10449. [DOI] [PMC free article] [PubMed] [Google Scholar]
- Seress L, Ribak CE. Postnatal development of CA3 pyramidal neurons and their afferents in the Ammon’s horn of rhesus monkeys. Hippocampus. 1995;5(3):217–31. doi: 10.1002/hipo.450050308. [DOI] [PubMed] [Google Scholar]
- Shibley H, Smith BN. Pilocarpine-induced status epilepticus results in mossy fiber sprouting and spontaneous seizures in C57BL/6 and CD-1 mice. Epilepsy Res. 2002;49(2):109–20. doi: 10.1016/s0920-1211(02)00012-8. [DOI] [PubMed] [Google Scholar]
- Stewart MG, Davies HA, Sandi C, Kraev IV, Rogachevsky VV, Peddie CJ, Rodriguez JJ, Cordero MI, Donohue HS, Gabbott PL, Popov VI. Stress suppresses and learning induces plasticity in CA3 of rat hippocampus: a three-dimensional ultrastructural study of thorny excrescences and their postsynaptic densities. Neuroscience. 2005;131(1):43–54. doi: 10.1016/j.neuroscience.2004.10.031. [DOI] [PubMed] [Google Scholar]
- Sutula T, Cascino G, Cavazos J, Parada I, Ramirez L. Mossy fiber synaptic reorganization in the epileptic human temporal lobe. Ann Neurol. 1989;26(3):321–30. doi: 10.1002/ana.410260303. [DOI] [PubMed] [Google Scholar]
- Swann JW, Al-Noori S, Jiang M, Lee CL. Spine loss and other dendritic abnormalities in epilepsy. Hippocampus. 2000;10(5):617–25. doi: 10.1002/1098-1063(2000)10:5<617::AID-HIPO13>3.0.CO;2-R. [DOI] [PubMed] [Google Scholar]
- Toni N, Laplagne DA, Zhao C, Lombardi G, Ribak CE, Gage FH, Schinder AF. Neurons born in the adult dentate gyrus form functional synapses with target cells. Nat Neurosci. 2008;11(8):901–7. doi: 10.1038/nn.2156. [DOI] [PMC free article] [PubMed] [Google Scholar]
- Tauck DL, Nadler JV. Evidence of functional mossy fiber sprouting in hippocampal formation of kainic acid-treated rats. J Neurosci. 1985;5(4):1016–22. doi: 10.1523/JNEUROSCI.05-04-01016.1985. [DOI] [PMC free article] [PubMed] [Google Scholar]
- Tsurugizawa T, Mukai H, Tanabe N, Murakami G, Hojo Y, Kominami S, Mitsuhashi K, Komatsuzaki Y, Morrison JH, Janssen WG, Kimoto T, Kawato S. Estrogen induces rapid decrease in dendritic thorns of CA3 pyramidal neurons in adult male rat hippocampus. Biochem Biophys Res Commun. 2005;337(4):1345–52. doi: 10.1016/j.bbrc.2005.09.188. [DOI] [PubMed] [Google Scholar]
- van Praag H, Schinder AF, Christie BR, Toni N, Palmer TD, Gage FH. Functional neurogenesis in the adult hippocampus. Nature. 2002;415(6875):1030–4. doi: 10.1038/4151030a. [DOI] [PMC free article] [PubMed] [Google Scholar]
- Vuksic M, Del Turco D, Bas Orth C, Burbach GJ, Feng G, Müller CM, Schwarzacher SW, Deller T. 3D-reconstruction and functional properties of GFP-positive and GFP-negative granule cells in the fascia dentata of the Thy1-GFP mouse. Hippocampus. 2008;18(4):364–75. doi: 10.1002/hipo.20398. [DOI] [PubMed] [Google Scholar]
- Walter C, Murphy BL, Pun RY, Spieles-Engemann AL, Danzer SC. Pilocarpine-induced seizures cause selective time-dependent changes to adult-generated hippocampal dentate granule cells. J Neurosci. 2007;27(28):7541–52. doi: 10.1523/JNEUROSCI.0431-07.2007. [DOI] [PMC free article] [PubMed] [Google Scholar]
- Williams RW, Rakic P. Three-dimensional counting: an accurate and direct method to estimate numbers of cells in sectioned material. J Comp Neurol. 1988;278(3):344–52. doi: 10.1002/cne.902780305. [DOI] [PubMed] [Google Scholar]
- Zhang S, Khanna S, Tang FR. Patterns of hippocampal neuronal loss and axon reorganization of the dentate gyrus in the mouse pilocarpine model of temporal lobe epilepsy. J Neurosci Res. 2009;87(5):1135–49. doi: 10.1002/jnr.21941. [DOI] [PubMed] [Google Scholar]
Associated Data
This section collects any data citations, data availability statements, or supplementary materials included in this article.