Abstract

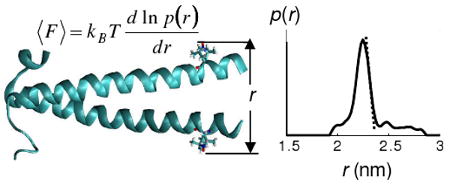
A new method for measuring forces between small protein domains based on double electron-electron resonance (DEER) spectroscopy is demonstrated using a model peptide derived from the α-helical coiled-coil leucine zipper of yeast transcriptional activator GCN4. The equilibrium distribution of distances between two nitroxide spin labels rigidly attached to the helices of the dimer was determined by DEER, and yielded a closing force of 100±10 pN between monomers, in excellent agreement with theoretical predictions.
Fabrication of multi-component nanostructures requires the assembly of molecular scale components into ordered arrays. Biology offers examples of self-assembling structures that form functional entities.1 Coiled-coil peptides are a particularly interesting class of biological models that naturally form robust multimers, and that can be tuned to yield dimers and trimers, as well as large fiber assemblies with predictable morphologies.2,3 In order for these structures to find applications as nanodevices new methods are being developed that predict and measure their mechanical properties at the nanoscale level.4,5
In this communication we demonstrate a new experimental method for measuring inter-coil forces that is based on electron spin-labeling and double electron-electron resonance (DEER) spectroscopy. The model system used for these measurements is derived from the α-helical coiled coil leucine zipper (LZ) portion (residues 243-281) of the yeast transcriptional activator GCN46 (PDB entry 1YSA), which has recently been characterized by single-site spin-labeling.7 The 4.5×3 nm leucine zipper subdomain consists of two identical polypeptides.
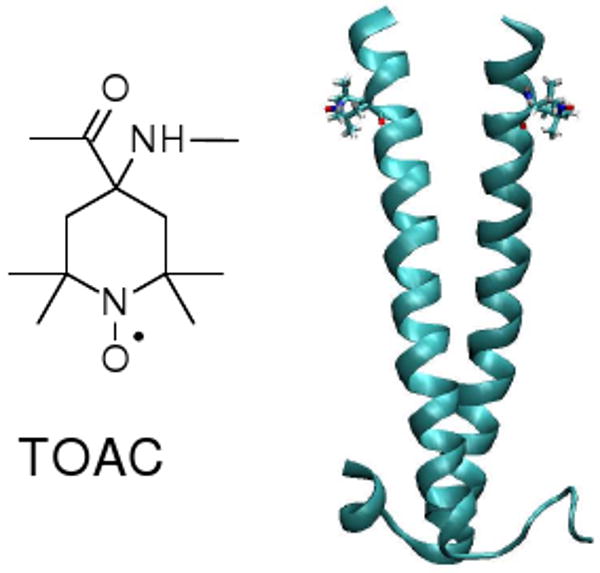
GCN4-LZ was prepared using solid phase Fmoc-protection chemistry with a TOAC spin label at residue 248 as shown in Figure 1. Details of the peptide synthesis are given in the Supporting Information. The Multicoil score8 for the GCN4-LZ sequence (neglecting TOAC) is 0.83, indicating a strong propensity to form a coiled-coil dimer that is reinforced by TOAC's tendency to adapt a helical backbone conformation.9
Figure 1.

Coiled-coil leucine zipper structure investigated in this work, indicating the structure and position of the TOAC spin label.
Distance measurements on nanoscale structures can be obtained by measuring the electron spin-spin dipolar interaction using double electron-electron resonance (DEER) spectroscopy, (see review in ref. 10 and original citations therein). DEER has recently been carried out on rigid bispeptide nanostructures with flexibly attached proxyl labels.11 For the present application, the TOAC spin label9,12,13 was selected because of its rigid fused ring structure (cf. Fig. 1), which eliminates motion of the nitroxide group relative to the peptide backbone, thus ensuring that spin-spin distance measurements directly reflect the inter-backbone distance.
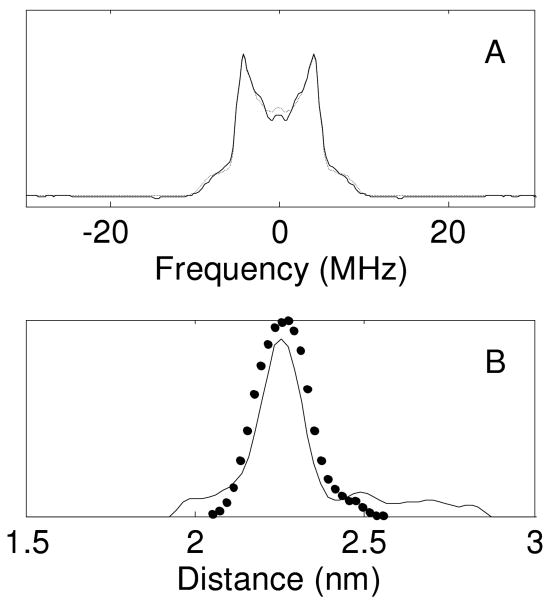
Four-pulse DEER was performed at 65 K as described in the Supporting Information and ref. 14, and the results are summarized in Figure 2. The distribution of interspin distances P(r) was obtained from the DEER Analysis 2006 program15 using model-independent Tikhonov regularization analysis.15,16 The nearly ideal shape of the Pake pattern in Fig. 2A confirms that orientational selection effects17 are negligible for the experimental conditions used. The resulting distribution (Fig. 2B) showed most of the population at a distance of 2.2 nm, close to the distance of 2.3 nm estimated from a molecular model of the TOAC-labeled dimer based on the GCN4 crystal structure (Fig. 1). A small fraction of spins with larger separation is also apparent, which may reflect a minor degree of interaction between coiled-coil units. The distribution of distances in the main fraction (>85%) is very narrow (about 0.14 nm), confirming a compact and well-defined coil structure.
Figure 2.
(A) Frequency domain DEER signal showing characteristic Pake pattern of an distributed pair of dipoles; (B) Solid line shows distribution of distances between spin labels obtained by model-independent Tikhonov analysis of the DEER spectrum. Symbols show distance distribution calculated by the MD-ABF method.
The distance distribution obtained from DEER may be used to calculate the mean force between the halves of the coiled coil. The method is based on the statistical thermodynamic relation between the potential of mean force (PMF) and the probability P(ξ) of finding the system at some particular “reaction coordinate”, ξ. The mean force free energy A(ξ) is given by18,19
| [1] |
where A0 is the standard state free energy. If one takes P(ξ) to be the spin label distance distribution measured by DEER, one may use this relation to find A(ξ), from which the derivative −dA(ξ)/dξ may be calculated to give the mean force along ξ.
Figure 2B compares the experimental P(ξ) with that calculated from a 4 ns MD trajectory at 298K using the adaptive biasing force (ABF) method in NAMD20 (round symbols). Details of the simulation are given in the Supporting Information. The forces obtained by taking the derivatives of each population distribution curve at 298K are 110±10 pN for the DEER data and 90±10 pN for the MD calculation. Given the excellent agreement between the shapes of the calculated and experimental distance distributions, the difference in force may reflect a difference in effective temperatures. That is, if cooling in the DEER sample is not instantaneous, the quenched state of the protein may be closer to the glass transition temperature of the solvent. An effective quenching temperature of 218K is required to bring the forces into agreement, which is quite close to the glass transition for 30% sucrose. The forces are nevertheless quite comparable to typical protein unfolding forces measured by single-molecule methods.21
The method presented here offers a useful complement to existing methods for measuring molecular scale forces. In contrast to single-molecule methods, it does not require the attachment of the molecule to a macroscopic object such as a bead or atomic force microscope tip. This feature avoids complications from non-specific binding, permits force measurements under a much wider range of ambient conditions, and also allows one to target significantly smaller structures than are generally accessible to single-molecule measurements. The availability of model-independent algorithms for obtaining distributions16 is another advantage of this method, since in principle it can resolve arbitrary distance distributions arising from multiple protein conformations.
On the other hand, the DEER method is inherently an ensemble measurement, and therefore cannot directly observe transient events or molecular processivity. It also assumes that the distribution observed under the conditions of DEER (i.e. in frozen solution) reflects the equilibrium distribution of conformations at room temperature. This is valid if the molecular energy surface is sufficiently smooth with a high density of closely spaced states separated by low barriers. In this case, the system is unlikely to be trapped in any particular state in a glassy medium, and the distance distribution obtained from frozen samples should accurately reflect the distribution present at room temperature. The rate of freezing may become important when there is a slow exchange process or global restructuring of the protein.
Accurate force measurements by DEER require a rigidly attached label such as TOAC. The flexible tether in more commonly used spin labels would lead to a broader distance distribution and systematic underestimation of the forces between the labeled protein domains. Although TOAC must generally be incorporated by chemical synthesis, the method described here may be generalized to naturally occurring proteins by taking advantage of other available strategies for immobilizing spin labels relative to the protein. 22,
These results add to our understanding of coiled coils motifs, which represent an important and common mode of protein-protein interaction. Furthermore, they establish DEER as the only spectroscopic method available for quantitatively measuring the mechanical properties of small peptide-based nanodevices. Such capabilities will be critical for the design of protein-based nanoscale active devices with targeted functions.
Supplementary Material
Acknowledgments
This work was supported by grants NSF CHE-0443616 and Army W81XWH-06-1-0551 (D.E.B), a NASA NIAC Phase II grant and NSF DMI-0422724 (C.M.), NIH GM60259-01, NSF. CHE-0645709 and MRI-0722403). (G.A.L.) and NIH NCRR P41RR16292 (J.H.F).
Footnotes
Supporting Information Available: Descriptions of the procedures for peptide synthesis, ESR and DEER, and the ABF MD simulation are given in the Supporting Information. This material is available free of charge via the Internet at http://pubs.acs.org.
References
- 1.Ulijn RV, Smith AM. Chemical Society Reviews. 2008;37:664–675. doi: 10.1039/b609047h. [DOI] [PubMed] [Google Scholar]
- 2.Zimenkov Y, Conticello VP, Guo L, Thiyagarajan P. Tetrahedron. 2004;60:7237–7246. [Google Scholar]
- 3.Ryadnov MG, Woolfson DN. Nature Materials. 2003;2:329–332. doi: 10.1038/nmat885. [DOI] [PubMed] [Google Scholar]
- 4.Apgar JR, Gutwin KN, Keating AE. Proteins-Structure Function and Bioinformatics. 2008;72:1048–1065. doi: 10.1002/prot.22118. [DOI] [PMC free article] [PubMed] [Google Scholar]
- 5.Grigoryan G, Keating AE. Journal of Molecular Biology. 2006;355:1125–1142. doi: 10.1016/j.jmb.2005.11.036. [DOI] [PubMed] [Google Scholar]
- 6.Ellenberger TE, Brandl CJ, Struhl K, Harrison SC. Cell. 1992;71:1223–1237. doi: 10.1016/s0092-8674(05)80070-4. [DOI] [PubMed] [Google Scholar]
- 7.Columbus L, Hubbell WL. Biochemistry. 2004;43:7273–87. doi: 10.1021/bi0497906. [DOI] [PubMed] [Google Scholar]
- 8.Wolf E, Kim PS, Berger B. Protein Science. 1997;6:1179–1189. doi: 10.1002/pro.5560060606. [DOI] [PMC free article] [PubMed] [Google Scholar]
- 9.Toniolo C, Valente E, Formaggio F, Crisma M, Pilloni G, Corvaja C, Toffoletti A, Martinez GV, Hanson MP, Millhauser GL, et al. J Pept Sci. 1995;1:45–57. doi: 10.1002/psc.310010107. [DOI] [PubMed] [Google Scholar]
- 10.Jeschke G, Pannier M, Spiess HW. In: Biological Magnetic Resonance: Distance Measurements in Biological Systems by EPR. Eaton SS, Eaton GR, Berliner LJ, editors. Vol. 19 Academic/Plenum Publishers; New York: 2000. [Google Scholar]
- 11.Pornsuwan S, Bird G, Schafmeister CE, Saxena S. J Am Chem Soc. 2006;128:3876–7. doi: 10.1021/ja058143e. [DOI] [PubMed] [Google Scholar]
- 12.Hanson MP, Martinez GV, Millhauser GL, Formaggio F, Crisma M, Toniolo C, Vita C. Pept: Chem, Struct Biol, Proc Am Pept Symp. 1996:533–534. 14th. [Google Scholar]
- 13.Hanson P, Anderson DJ, Martinez G, Millhauser G, Formaggio F, Crisma M, Toniolo C, Vita C. Mol Phys. 1998;95:957–966. [Google Scholar]
- 14.Upadhyay AK, Borbat PP, Wang J, Freed JH, Edmondson DE. Biochemistry. 2008;47:1554–66. doi: 10.1021/bi7021377. [DOI] [PubMed] [Google Scholar]
- 15.Jeschke G, Panek G, Godt A, Bender A, Paulsen H. Appl Magn Reson. 2004;26:223–244. [Google Scholar]
- 16.Chiang YW, Borbat PP, Freed JH. Journal of Magnetic Resonance. 2005;172:279–295. doi: 10.1016/j.jmr.2004.10.012. [DOI] [PubMed] [Google Scholar]
- 17.Margraf D, Bode D, Marko BE, Schiemann AO, Prisner TF. Mol Phys. 2007;105:2153–2160. [Google Scholar]
- 18.Darve E, Pohorille A. Journal of Chemical Physics. 2001;115:9169–9183. [Google Scholar]
- 19.Otter WKD, Briels WJ. Molecular Physics. 2000;98:773–781. [Google Scholar]
- 20.Phillips JC, Braun R, Wang W, Gumbart J, Tajkhorshid E, Villa E, Chipot C, Skeel RD, Kale L, Schulten K. Journal of Computational Chemistry. 2005;26:1781–1802. doi: 10.1002/jcc.20289. [DOI] [PMC free article] [PubMed] [Google Scholar]
- 21.Neuman KC, Nagy A. Nature Methods. 2008;5:491–505. doi: 10.1038/nmeth.1218. [DOI] [PMC free article] [PubMed] [Google Scholar]
- 22.Mchaourab HS, Kalai T, Hideg K, Hubbell WL. Biochemistry. 1999;38:2947–2955. doi: 10.1021/bi9826310. [DOI] [PubMed] [Google Scholar]
Associated Data
This section collects any data citations, data availability statements, or supplementary materials included in this article.


