

Abstract
Purpose
To investigate the use of advanced ultrasonic imaging to quantitatively evaluate normal-tissue toxicity in breast-cancer radiation treatment.
Methods and Materials
Eighteen breast cancer patients who received radiation treatment were enrolled in an IRB-approved clinical study. Radiotherapy involved a radiation dose of 50.0–50.4 Gy delivered to the entire breast, followed by an electron boost of 10.0–16.0 Gy delivered to the tumor bed. Patients were scanned with ultrasound during follow-up that ranged from 6 to 94 months (median 22 months) post radiotherapy. Conventional ultrasound images and radio-frequency (RF) echo signals were acquired from treated and untreated breasts. Three ultrasound parameters: skin thickness, Pearson coefficient, and spectral midband fit were computed from RF signals to measure radiation-induced changes in dermis, hypodermis and subcutaneous tissue, respectively. Ultrasound parameter values of the treated breast were compared to those of the untreated breast. Ultrasound findings were compared with clinical assessment using RTOG late-toxicity scores.
Results
Significant changes were observed in ultrasonic parameter values of the treated versus untreated breasts. Average skin thickness increased by 26.9%, from 2.05 ± 0.22 mm to 2.61 ± 0.52 mm, Pearson correlation coefficient decreased by 31.5%, from 0.41 ± 0.07 to 0.28 ± 0.05, midband fit increased by 91.6%, from −0.92 ± 7.35 dB to 0.87 ± 6.70 dB. Ultrasound evaluations were consistent with RTOG scores.
Conclusions
Quantitative ultrasound provides a noninvasive, objective means of assessing radiation-induced changes to the skin and subcutaneous tissue. This imaging tool will become increasingly valuable as we continue to improve radiation therapy technique.
Keywords: radiation toxicity, normal-tissue injury, ultrasound tissue characterization
INTRODUCTION
Radiation therapy following lumpectomy has improved breast conservation, local regional control and survival, and is firmly established in the management of early breast carcinoma (1–5). Advances in early detection and treatment technologies has improved breast cancer survival rates during the 1980s and early-1990s, and has maintained an approximate 90% 5-yr relative survival rate throughout the past decade (6). In light of the increasing number of breast cancer survivors as well as the increasing years of survival, greater focus has been placed on optimizing radiation treatment techniques to reduce normal-tissue effects (7, 8).
In current clinical practice, physicians use subjective grading systems to evaluate radiation effects on the breast tissue, such as those established by the Radiation Therapy Oncology Group (RTOG) and European Organization for Research and Treatment of Cancer (EORTC) (9–14). In the RTOG Late Radiation Morbidity Scoring Scheme, physicians assign a score of 0 (absent) to 4 (severe) for skin and subcutaneous tissue toxicity based on visual and tactile examinations (Table 1). Although simple and quantitative, such subjective measures are prone to inter-observer variability (15).
Table 1.
RTOG Late Radiation Morbidity Scoring Scheme
| Organ/Tissue | 0 | Grade 1 | Grade 2 | Grade 3 | Grade 4 |
|---|---|---|---|---|---|
| Skin | None | Slight atrophy, pigmentation change, some hair loss | Patchy atrophy, moderate telangiectasia, total hair loss | Marked atrophy, gross telangiectasia | Ulceration |
| Subcutaneous tissue | None | Slight induration (fibrosis) and loss of subcutaneous fat | Moderate fibrosis but asymptomatic/slight field contracture/< 10% linear reduction | Severe induration and loss of subcutaneous tissue, field contracture > 10% linear measurement | Necrosis |
Any toxicity which caused death is graded 5.
We have introduced a quantitative ultrasound technique as a complementary or alternative method for normal-tissue toxicity assessment. Ultrasound is safe, noninvasive, cost-effective and widely-accessible making it well-suited for clinical implementation. Our ultrasound technique combines conventional ultrasound with ultrasonic tissue characterization (UTC), which can measure changes in tissue microstructures, to objectively assess radiation-injury to the skin and subcutaneous tissues.
To quantify normal-tissue toxicity, we developed three parameters computed from the backscattered ultrasound radio-frequency (RF) signals: skin thickness, Pearson coefficient and midband fit. These parameters were selected based on clinical, radiological and pathological observations of skin and subcutaneous tissue toxicity characteristics. To assess the efficacy of this method, we have initiated a clinical study to investigate late toxicity in breast cancer radiotherapy. This study primarily compares quantitative ultrasound assessments of the normal-tissue injury to the observed RTOG late morbidity scores.
In particular, the aims of this study are to determine: (1) whether the quantitative ultrasound technique that we have developed is able to measure late toxicities in skin and subcutaneous tissues of the irradiated breast, as compared to the untreated contra-lateral breast; (2) if quantitative ultrasound measurements correlate with physician assessment using RTOG Late Radiation Morbidity Scoring Scheme; and (3) if quantitative documentation of normal-tissue toxicity is feasible in the clinic.
METHODS AND MATERIALS
Patients
Between February and October 2007, 18 breast cancer patients were recruited under an institutional review board (IRB) approved study at Columbia University Medical Center (Table 2). All patients had previously received breast conservation therapy for early-stage breast cancer. The time elapsed between the completion of radiotherapy and follow-up ranged from 6 to 92 months (median of 22 months). Radiation treatment consisted of a standard regimen: external beam radiation of 50.0–50.4 Gy to the whole breast using 6-MV tangential parallel opposed fields, followed by an electron boost to the tumor bed of 10.0–16.0 Gy, depending on the margin status.
Table 2.
Patient-related characteristics
| Characteristics | Number (%) |
|---|---|
| Age (year) | |
| Median | 56 |
| Range | 44 to 74 |
| Follow-Up Time (month) | |
| Median | 22 months |
| Range | 6 to 92 months |
| Race | |
| Asian | 1 (6%) |
| African American | 3 (17%) |
| Caucasians | 5 (28%) |
| Hispanics | 9 (50%) |
| Tumor Stage | |
| Stage 0 | 3 (17%) |
| Stage I | 11 (61%) |
| Stage II | 4 (22%) |
| Tumor Location | |
| Right breast | 10 (56%) |
| Left breast | 8 (44%) |
| Total dose | |
| 60.4 Gy | 11 (61%) |
| > 60.4 Gy | 7 (39%) |
Ultrasound Examination and Parameter Computation
All enrolled patients received ultrasound scans at routine follow-up visits. We used a clinical ultrasound scanner, Sonix RP (Ultrasonix Medical Corporation, BC, Canada), with a 12-MHz linear probe for patient data acquisition. In this study, ultrasound B-mode images and radio-frequency (RF) echo signals were acquired simultaneously from the treated and untreated breasts. Patients were scanned in a supine position. A thin layer of gel was applied to ensure good coupling between the skin and the ultrasound probe. The probe was held perpendicular to the breast surface without application of additional pressure, as shown in Fig. 1. Four ultrasound scans were obtained from each breast: left breast 12:00 (upper), 3:00 (lateral), 6:00 (lower), and 9:00 (medial); and right breast 12:00 (upper), 3:00 (medial), 6:00 (lower), and 9:00 (lateral). Scans from the untreated breast served as controls. Examinations were comfortable, easy, and fast—taking approximately 5 to 10 minutes.
Fig. 1.
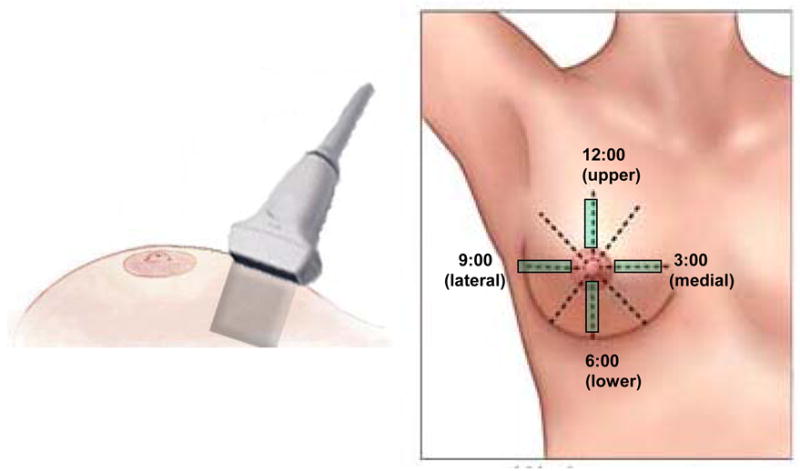
Diagram showing (a) the orientation and (b) the location of the breast ultrasound scanning.
Figure 2 shows a RF signal from the center of a conventional B-mode image. We developed a software routine in MatLab® to analyze the RF echo signals backscattered from the tissue of interest to measure radiation-induced skin and soft-tissue changes. The underlying physics concepts behind our quantitative ultrasound have been described in previous reports (16, 17), and are briefly explained in the appendix. Skin thickness was measured as the distance between backscattered signals from the epidermis and those of the hypodermis (Appendix eI). We analyzed radiation injury to the hypodermis by computing the average Pearson correlation coefficient between adjacent scan segments of RF signals within a 10 mm × 2 mm region-of-interest, located along the hypodermis (Appendix eII). To assess the damage to subcutaneous glandular tissue, the midband fit (that is, the average intensity of the linear regression of the 1D power spectrum of the subcutaneous tissue) was calculated from the RF signals within a 30 mm (width) × 4 mm (depth) region-of-interest located 8 mm below the skin (Appendix eIII).
Fig. 2.
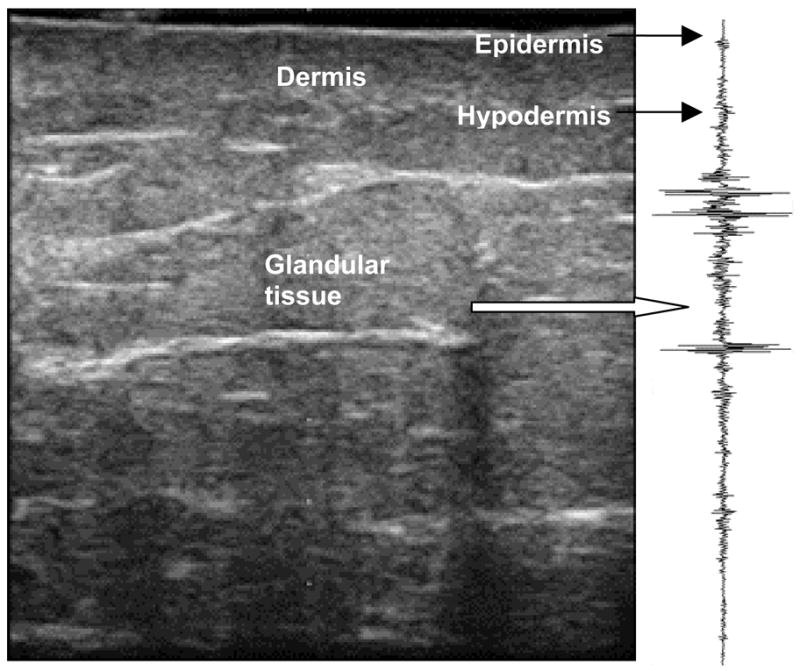
Ultrasound B-mode image of breast with the RF signals corresponding to the central line.
For each patient, we calculated these three parameters: skin thickness, Pearson correlation coefficient, and midband fit at all four scan locations on each breast. Measurements taken from the four locations of the treated breast were averaged for each parameter and compared against the average value of the untreated breast of the same patient. Although the radiation dose is not uniform across the entire breast, average values were investigated to validate the viability of our technique.
Clinical Assessment
Clinical assessments were performed after the ultrasound scan during follow-up by the same physician (with the exception of one patient). Physical examinations of radiation toxicity include visual inspection and systematic palpation of both breasts. RTOG Late Radiation Morbidity Scoring Scheme was used for assessment of skin and subcutaneous-tissue toxicity (Table 1) in the treated breast. The physicians were blinded to the ultrasound measurements and ultrasound data analyses were performed without the knowledge of RTOG scores. We evaluated the statistical distribution of our ultrasound parameter values with respect to RTOG scores. We compared average parameter values for patients with grade-0 toxicity to average parameter values for patients with grade-1 or higher toxicity.
Statistical Analysis
A paired t-test was used to examine the significance of the difference between treated and untreated breast measurements. Pearson correlation coefficient was used to identify whether correlation existed among any two of the three ultrasound parameters.
RESULTS
Case Study
A 55 year-old breast cancer patient, with Stage I invasive ductal carcinoma, was treated with external beam RT from December 2005 to February 2006. She received 50.4 Gy to the whole breast followed by an electron boost of 10.0 Gy to the lumpectomy site. At 1-year follow-up, the treated breast had retracted roughly 4 cm, measured at the nipple (Fig. 3). The patient developed Grade-1 late skin toxicity and Grade-1 late subcutaneous-tissue toxicity according to physician assessment based on RTOG Late Morbidity Scoring Scheme.
Fig. 3.
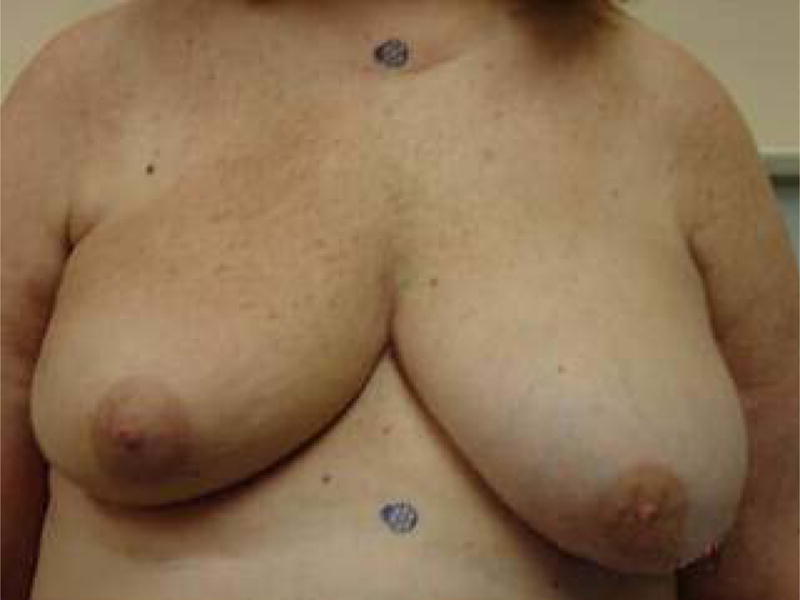
Post-radiotherapy photograph of the treated breast (right) and untreated breast (left) at 1 year follow-up visit. The vertical distance between the blue markers is 25 cm. The treated breast had retracted roughly 4 cm, measured at the nipple.
Figure 4(a) is the ultrasound B-mode image of the untreated left breast at the medial position. In this image, the skin is well-defined with a thickness of 2.48 mm. By comparison, Fig. 4(b) is a B-mode image of the treated breast at the corresponding medial position. Here, the dose received was 50.4 Gy and the skin is markedly thicker at 3.13 mm. The untreated hypodermis has a consistent pattern, while the treated hypodermis is obscured. The Pearson correlation coefficient of the RF intensity along the untreated hypodermis was 0.39, compared to 0.21 for the treated hypodermis. Midband fit of the calibrated spectral intensity was −8.44 dB for the untreated glandular tissue and −2.36 dB for the treated glandular tissue. This increase in intensity for the treated breast is related to the increase in collagen concentration caused by fibrosis.
Fig 4.

Ultrasound B-mode images of the untreated (a) and treated (b) breasts scanned at the medial location.
Ultrasound parameters from the four measurement locations (upper, medial, lower and lateral) were averaged for each parameter to provide an overall perspective of post-radiation changes to the breast (Table 3). Ratios of the averaged treated to untreated measurements were taken to control for patient-to-patient variability. Dermal, hypodermal, and subcutaneous injury was suggested by skin thickening of 38.1%, decrease in Pearson correlation coefficient of 45.2%, increase in midband fit of 7.0 dB. These findings are consistent with the patient’s clinical assessment of grade-1 late toxicity.
Table 3.
Quantitative ultrasound parameter measurements for patient 7.
| Untreated Breast | Treated Breast | |||||
|---|---|---|---|---|---|---|
| Skin Thickness (mm) | Pearson Coefficient | Midband fit (dB) | Skin Thickness (mm) | Pearson Coefficient | Midband fit (dB) | |
| Upper | 2.21 | 0.36 | −10.34 | 2.87 | 0.28 | −2.16 |
| Medial | 2.48 | 0.39 | −8.44 | 3.13 | 0.21 | −2.36 |
| Lower | 2.21 | 0.44 | −9.37 | 3.13 | 0.15 | −2.92 |
| Lateral | 1.69 | 0.48 | −8.35 | 2.74 | 0.30 | −1.06 |
| Average | 2.15 | 0.42 | −9.13 | 2.97 | 0.23 | −2.13 |
Cohort analysis
Average parameter values for all patients were plotted in a 3D scattergram (Fig. 5), which shows an overall trend of post-radiation increase in skin thickness and midband fit values, coupled with a decrease in the Pearson coefficient. The segregation of ultrasound parameter values for the treated and untreated breasts demonstrates that our quantitative ultrasound is capable of capturing radiation-induced normal-tissue injury.
Fig. 5.
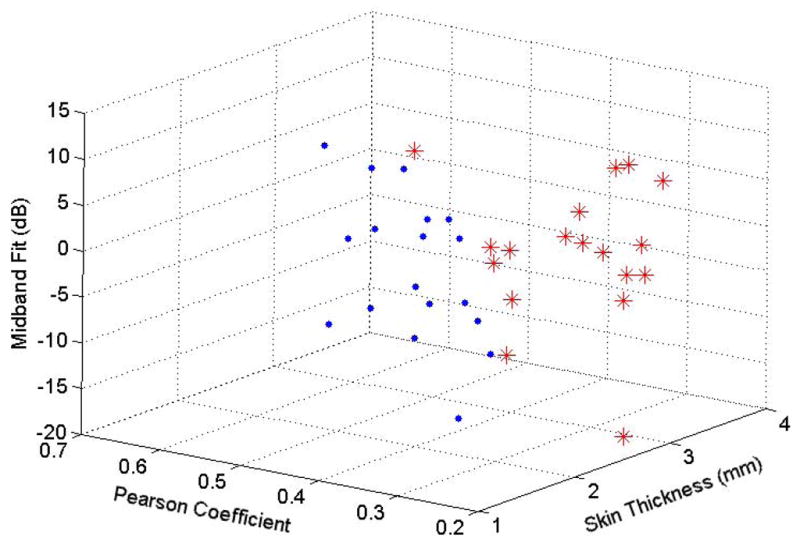
3D scattergram of ultrasound parameter values for the treated (red asterisks) and untreated (blue dots) breasts.
Figure 6–8 show treated versus untreated ultrasound parameter values for each patient. Skin thickness of the untreated breasts ranged from 1.66 to 2.41 mm, while that of the treated breasts ranged from 1.53 to 3.65 mm (Fig. 6). For this group of 18 patients, an average skin thickness increase of 26.9% was measured in the treated breasts with respect to the untreated breasts. Pearson coefficient ranged from 0.03 to 0.52 for the untreated hypodermis, and ranged from 0.21 to 0.41 for the treated hypodermis (Fig. 7). Overall, an average decrease of 31.5% in the Pearson coefficient was observed in the treated breasts compared to the untreated breasts. Figure 8 shows the spectral midband fit values ranged from −17.61 to 10.82 dB for the untreated breasts, yet ranged from −18.45 to 11.85 dB for the treated breasts. An average increase of 91.6% in midband fit value was observed in the treated breasts.
Fig. 6.

Skin thickness of the treated breast (dark grey) vs. the untreated breast (light grey).
Fig. 8.

Spectral midband fit of the treated breast (dark grey) vs. the untreated breast (light grey).
Fig. 7.

Pearson coefficient of the treated breast (dark grey) vs. the untreated breast (light grey).
Statistical analysis confirms significant differences between treated and untreated breast tissue in all three parameters: skin thickness (p < 0.001), midband fit (p = 0.008), and Pearson correlation coefficient of the hypodermis (p < 0.001), as shown in Table 4. No statistical correlation exists between any two of the three parameters suggesting that all three are necessary to adequately evaluate toxicity.
Table 4.
Average ultrasound parameter values and the difference of the treated and untreated breast.
| Mean (Standard Deviation) | Difference | p-value | ||
|---|---|---|---|---|
| Untreated Breast | Treated Breast | |||
| Skin thickness (mm) | 2.05 (± 0.22) | 2.61 (± 0.52) | 0.56 | <0.001 |
| Pearson coefficient | 0.41 (± 0.07) | 0.28 (± 0.05) | −0.14 | <0.001 |
| Midband fit (dB) | −0.92 (± 7.35) | 0.87 (± 6.70) | 1.79 | 0.008 |
Comparison of ultrasound evaluation to clinical assessments
To account for patient-to-patient variability, we examined the ratios of treated to untreated ultrasound parameter values. We compared the ratios of three ultrasound parameters for each patient (treated divided by untreated) with their RTOG late-toxicity scores. Clinical assessment revealed 6 (33%) patients with grade-0, 10 (56%) with grade-1, and 2 (11%) with grade-2 skin toxicity. For subcutaneous toxicity, 10 (56%) patients had grade-0, 7 (39%) had grade-1, and 1 (6%) had grade-2. Strong correlation was found between skin thickness and RTOG subcutaneous toxicity, Pearson coefficient and RTOG skin toxicity, and midband fit and RTOG subcutaneous toxicity.
Figure 9 is a box plot comparison of the treated to untreated skin thickness ratio versus RTOG subcutaneous late-toxicity score. The average increase in skin thickness was 17% among patients with grade-0 subcutaneous toxicity, and 39% among patients with grade-1 or grade-2 subcutaneous toxicity. The increasing trend in mean values with respect to RTOG subcutaneous toxicity score represents good correlation between skin thickness measurements and clinical assessment, suggesting this parameter’s ability to measure dermal injury.
Fig. 9.
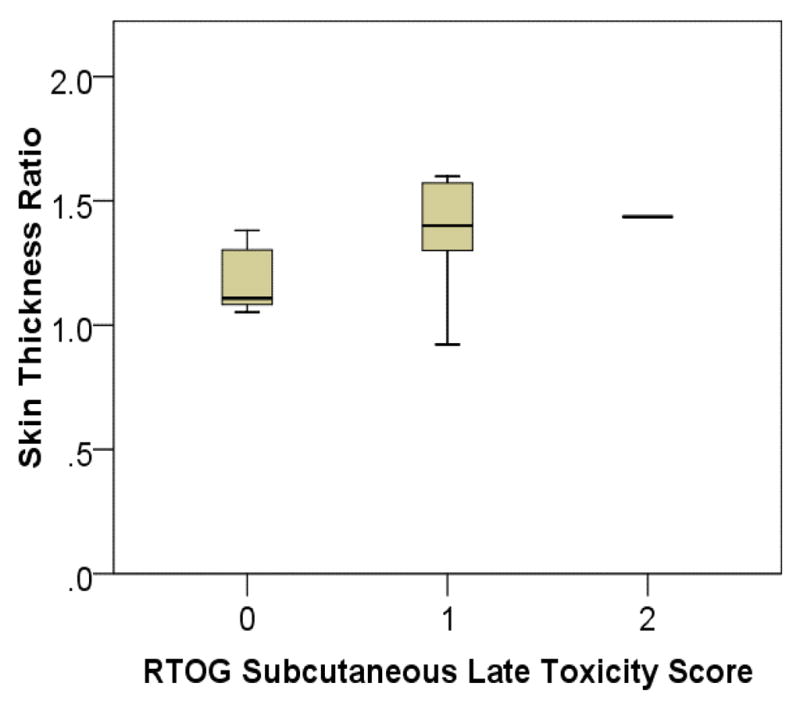
Box plot of treated to untreated breast skin thickness ratio vs. RTOG subcutaneous late-toxicity score.
Figure 10 shows treated to untreated Pearson coefficient ratio versus RTOG skin late-toxicity scores. An average decrease of 18% in Pearson coefficient value was found among patients with grade-0 skin toxicity, whereas a decrease of 38% was found among patients with grade-1 or grade-2 toxicity. A decreasing trend is visible in Fig. 10 and demonstrates the feasibility of this parameter to measure toxicity of the hypodermis.
Fig. 10.

Box plot of treated to untreated breast Pearson correlation coefficient ratio vs. RTOG skin late-toxicity score.
Figure 11 compares the midband fit difference to RTOG subcutaneous-tissue late-toxicity score. Since the midband fit is expressed in the logarithmic units of decibel (dB), a difference (subtraction) represents the intensity ratio of the backscattered signals from treated to untreated breasts. An average increase in midband fit value of 6% (0.25 dB) was observed among patients with grade-0 subcutaneous toxicity, while an average increase of 136% (3.72 dB) was observed among patients with grade-1 or grade-2 toxicity. The increasing trend of midband fit values with respect to RTOG score, suggests this parameter is able to measure toxicity of the subcutaneous glandular tissue.
Fig. 11.
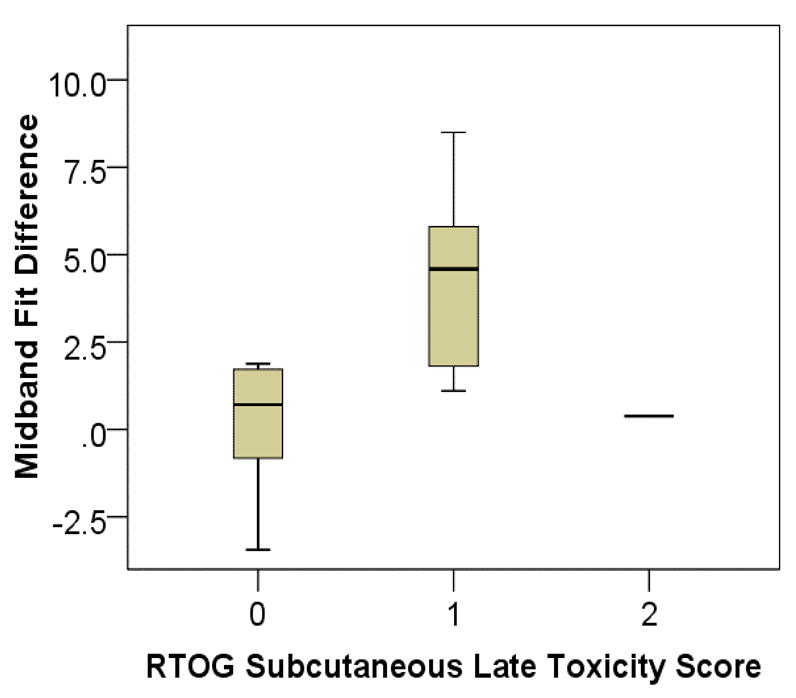
Box plot of treated to untreated breast midband fit ratio vs. RTOG skin late-toxicity score.
DISCUSSION
Radiation’s effects on normal tissues are complex processes (14). The histopathologic changes evolve through phases and often result in a loss of architectural integrity of tissue microstructures at the treatment site. Ultrasound backscattered signals carry information about the structural features of the insonified (imaged) skin and subcutaneous tissues. Through our quantitative ultrasound technique, we are able to measure radiation-induced structural changes, and can therefore, quantify normal-tissue toxicity. We investigated three ultrasound measured parameters including skin thickness, Pearson coefficient and midband fit to address normal-tissue injury of the dermal, hypodermal, and subcutaneous tissues, respectively.
The first parameter we utilized is skin thickness. Skin thickening is a well-known post-radiation effect (15) and has been investigated by several groups using high-frequency ultrasound (18–20). Our skin thickness is measured from the RF signals backscattered from the epidermis and hypodermis. Through the measurement of skin thickness, we may be able to gauge the severity of skin fibrosis or edema. The second parameter we introduced is the Pearson coefficient, a new parameter in quantitative ultrasound imaging. The Pearson coefficient measures the average correlation between adjacent scan segments of RF signals along the hypodermis and evaluates the hypodermal integrity. Radiation-induced hypodermis damage often results in extensive cellular fibrosis, characterized by the loss of consistent pattern in extracellular structures (16), causing a decrease in the Pearson coefficient. The third parameter that we adapted is the midband fit of the 1D power spectrum of the backscattered RF signals of the deeper glandular tissues. Ultrasonic tissue characterization using 1D power spectrum has been widely investigated for cancer detections in a broad variety of organs such as the breast (21), prostate (22), kidney (23), liver (24) and eye (25) in the past two decades. The midband fit parameter is capable of capturing cell density and collagen-content changes within the tissue of interest (26). Radiation-induced fibrosis is characterized by increased collagen content, and will result in an increase in the midband fit value.
In this pilot study, we have demonstrated the clinical feasibility of our quantitative ultrasound technique to noninvasively measure radiation-associated late effects on skin and subcutaneous tissues. Comparing the treated breast with the untreated breasts of 18 post-radiation patients, we observed a 26.9% increase in skin thickness, a 31.5% decrease in Pearson coefficient, and a 91.6% increase in midband fit of the treated breasts. We have also demonstrated a correlation between normal-tissue toxicity measured by RTOG and that measured by our quantitative ultrasound. Comparing the subset of patients without clinical toxicity (RTOG grade-0) to those with late toxicity (RTOG grade-1 or higher), we observed significant ultrasound parameter changes: skin thickness increased from 17% to 39%, Pearson coefficient decreased from 18% to 38%, and midband fit increased from 6% to 136%. Such a correlation between clinical endpoints and ultrasound parameter values reflects the accuracy of our method.
Two limitations of the study are the small sample size and short follow-up time. Nevertheless, the initial results are encouraging and a future study is warranted to confirm that this ultrasound technique can provide a reliably quantitative assessment of the severity of normal-tissue toxicity. In this pilot study, the average parameter values of four quadrants were used to represent the overall breast-tissue change post radiation. Another limitation is that these average values do not reflect the dose distribution to the breast, nor the distribution of radiation damage. We are conducting a population-based breast-cancer study in which specific locations, such as the boost regions, will be separately examined. Moreover, we will extend our investigation to other treatment techniques, such as hypo-fractionation, MammoSite® and partial breast irradiation. We will also consider the applicability of the technique to other treatment sites, such as head and neck.
Our ultrasonic method of qualifying radiation-induced normal-tissue toxicity offers several distinct advantages over the current clinical assessments. First, the ultrasonic measurements are noninvasive, operator-independent and objective. Second, this technique may provide early detections of normal-tissue injuries that are difficult to detect thorough clinical examinations such as visual observation and palpation. Third, this ultrasound technique may be useful for systematic and longitudinal evaluations of temporal evolution of normal-tissue injury during and after radiation therapy. Forth, its clinical implementation is relatively straightforward and could offer a flexible alternative or adjunct for the subjective clinical assessments. As we seek to improve treatment efficacy with new radiotherapy approaches, this objective, quantitative ultrasound technique of normal-tissue toxicity assessment could emerge as a valuable tool for clinical studies, especially for multi-institutional clinical trials.
CONCLUSION
Normal-tissue toxicity is a limiting factor in radiation therapy that has yet to be objectively measured. We have developed a safe, quantitative ultrasound technique to measure the radiation-induced changes of the skin and subcutaneous tissue. Our ultrasound technique utilizes a conventional ultrasound scanner and analyzes the raw RF signal backscattered from the tissue of interest. Ultrasonic B-mode images document the visible features of the irradiated tissue, while ultrasonic parameters provide quantitative measures of the architectural properties of the irradiated tissue. This tool will be increasingly valuable as we continue to increase the therapeutic ratio in breast cancer radiation therapy. Improvements in detecting and treating toxicity will ensue once radiation-associated tissue changes are accurately and objectively assessed.
Supplementary Material
Fig. e1. Ultrasound B-mode breast images with hypodermis ROI demarked. (a) untreated breast, and (b) treated breast.
Fig. e2. Ultrasound B-mode image of the breast with the skin surface (arrow) and the subcutaneous tissue ROI demarked. The image dimensions are 38 mm (width) × 40 mm (depth).
Fig. e3. Calibrated tissue spectrum (black solid curve) with linear regression (red dotted line). The midband fit value is the spectrum intensity of the linear regression at the center frequency.
Acknowledgments
This research was supported in part by National Cancer Institute Grant CA114313, Columbia University Women at Risk, Sindab pilot award and Varian Medical Systems.
Appendix: Quantitative Ultrasound Parameters
eI. Skin thickness estimation
Skin thickness can be measured directly from the B-mode images. In our study, the skin thickness (D) is computed using the speed of sound v and the time interval of the RF echo from the anterior (epidermis) and posterior skin layer (hypodermis). The speed of sound specific for breast skin is 1640 m/s (27) and the time interval is calculated by dividing the sample points M by the sample frequency fs. Therefore, skin thickness is represented by the expression D = v M/2 fs, in which 2 compensates for two-way travel.
eII. Hypodermis damage assessment
The conventional B-mode images displayed anatomical structures of the breast and were used to identify the hypodermis region-of-interest (ROI), as shown in Fig. e1. We manually placed each ROI (10 mm by 2 mm) for the analysis. All of the computations were performed on the raw RF data within the ROI. Each ROI consists of m sample points and n scan lines. A Hilbert transform was applied to the RF scan lines. The absolute value of the transformed data for each scan line, si, was then used as a basis for the Pearson correlation coefficient (Equation 1).
The Pearson correlation coefficient between scan lines i and j is defined by:
| (1) |
where s̄i and s̄j are the sample means, σi and σj are the sample standard deviations and the sum is over m sample points. The average correlation coefficient over n scan lines, ξ = <ξi,j>, reflects the variability in the acoustic impedance. Mathematically, the correlation coefficient ξ ranges from 0 to 1, where 0 represents no correlation and 1 represents perfect correlation. For a planar reflector, the correlation coefficient is close to 1. Healthy skin has well-defined layers of epidermis, dermis, and hypodermis. Therefore, we anticipate a higher ξ for normal skin. As cellular fibrosis develops post radiation, the hypodermis layer becomes blurred or irregular. This will result in a decrease in the correlation coefficient along the hypodermis.
eIII. UTC midband fit for subcutaneous tissue assessment
UTC using 1D spectrum analysis has been widely used in cancer detection (26, 28–30). We adapted a parameter, the midband fit, which is the midpoint of the linear regression of 1D power spectrum of the backscattered RF signals to evaluate subcutaneous tissue. 1D spectrum analysis starts with the display of a conventional B-mode image. Physicians use this image to choose the ROI for analysis (Fig. e2). In this pilot study, a ROI of 30 × 4mm window of RF signals is analyzed. These RF signals are composed of a range of frequencies (bandwidth). A Fourier transform is performed to separate the signal into various frequency components.
1D power spectrum is computed by taking a fast-Fourier transform along the RF data lines within the ROI:
| (2) |
| (3) |
where vn(t) is the RF data for line n (n from 1 to N, where N is the total number of lines in the ROI) and * represents the complex-conjugate operation. The resultant spectrum of each line was averaged to obtain an ensemble power spectrum S(f) of the ROI and was then converted to units of decibels (dB).
| (4) |
The averaged 1D power spectrum of the tissue segment is further calibrated using a reference phantom to remove system factors, such as the beam transfer function. Within the usable bandwidth, a linear regression is applied to the calibrated power spectrum, S(f) = β · f + I, where f is the frequency (MHz), β is the spectral slope (dB/MHz) and I is the spectral intercept (dB) (Fig. e3). The midband fit is the intensity value at the center of the frequency of linear regression and is related to the acoustic (physical) properties of the tissue microstructures.
Footnotes
Conflict of interest: None
Publisher's Disclaimer: This is a PDF file of an unedited manuscript that has been accepted for publication. As a service to our customers we are providing this early version of the manuscript. The manuscript will undergo copyediting, typesetting, and review of the resulting proof before it is published in its final citable form. Please note that during the production process errors may be discovered which could affect the content, and all legal disclaimers that apply to the journal pertain.
References
- 1.Arriagada R, Le MG, Rochard F, et al. Conservative treatment versus mastectomy in early breast cancer: patterns of failure with 15 years of follow-up data. Institut Gustave-Roussy Breast Cancer Group. J Clin Oncol. 1996;14:1558–1564. doi: 10.1200/JCO.1996.14.5.1558. [DOI] [PubMed] [Google Scholar]
- 2.Blichert-Toft M, Rose C, Andersen JA, et al. Danish randomized trial comparing breast conservation therapy with mastectomy: six years of life-table analysis. Danish Breast Cancer Cooperative Group. J Natl Cancer Inst Monogr. 1992:19–25. [PubMed] [Google Scholar]
- 3.Fisher B, Anderson S, Bryant J, et al. Twenty-year follow-up of a randomized trial comparing total mastectomy, lumpectomy, and lumpectomy plus irradiation for the treatment of invasive breast cancer. N Engl J Med. 2002;347:1233–1241. doi: 10.1056/NEJMoa022152. [DOI] [PubMed] [Google Scholar]
- 4.van Dongen JA, Voogd AC, Fentiman IS, et al. Long-term results of a randomized trial comparing breast-conserving therapy with mastectomy: European Organization for Research and Treatment of Cancer 10801 trial. J Natl Cancer Inst. 2000;92:1143–1150. doi: 10.1093/jnci/92.14.1143. [DOI] [PubMed] [Google Scholar]
- 5.Veronesi U, Cascinelli N, Mariani L, et al. Twenty-year follow-up of a randomized study comparing breast-conserving surgery with radical mastectomy for early breast cancer. N Engl J Med. 2002;347:1227–1232. doi: 10.1056/NEJMoa020989. [DOI] [PubMed] [Google Scholar]
- 6.Seer.cancer.gov. Surveillance Epidemiology and End Results Fast Stats. Vol. 2009. Bethesda: National Cancer Institute Cancer Statistics Branch; 2009. [Google Scholar]
- 7.Bentzen SM. Preventing or reducing late side effects of radiation therapy: radiobiology meets molecular pathology. Nat Rev Cancer. 2006;6:702–713. doi: 10.1038/nrc1950. [DOI] [PubMed] [Google Scholar]
- 8.Bentzen SM, Dorr W, Anscher MS, et al. Normal tissue effects: reporting and analysis. Semin Radiat Oncol. 2003;13:189–202. doi: 10.1016/S1053-4296(03)00036-5. [DOI] [PubMed] [Google Scholar]
- 9.Cox JD, Stetz J, Pajak TF. Toxicity criteria of the Radiation Therapy Oncology Group (RTOG) and the European Organization for Research and Treatment of Cancer (EORTC) Int J Radiat Oncol Biol Phys. 1995;31:1341–1346. doi: 10.1016/0360-3016(95)00060-C. [DOI] [PubMed] [Google Scholar]
- 10.Vrieling C, Collette L, Bartelink E, et al. Validation of the methods of cosmetic assessment after breast-conserving therapy in the EORTC “boost versus no boost” trial. EORTC Radiotherapy and Breast Cancer Cooperative Groups. European Organization for Research and Treatment of Cancer. Int J Radiat Oncol Biol Phys. 1999;45:667–676. doi: 10.1016/s0360-3016(99)00215-1. [DOI] [PubMed] [Google Scholar]
- 11.Vrieling C, Collette L, Fourquet A, et al. The influence of the boost in breast-conserving therapy on cosmetic outcome in the EORTC “boost versus no boost” trial. EORTC Radiotherapy and Breast Cancer Cooperative Groups. European Organization for Research and Treatment of Cancer. Int J Radiat Oncol Biol Phys. 1999;45:677–685. doi: 10.1016/s0360-3016(99)00211-4. [DOI] [PubMed] [Google Scholar]
- 12.Collette S, Collette L, Budiharto T, et al. Predictors of the risk of fibrosis at 10 years after breast conserving therapy for early breast cancer: a study based on the EORTC Trial 22881-10882 ‘boost versus no boost’. Eur J Cancer. 2008;44:2587–2599. doi: 10.1016/j.ejca.2008.07.032. [DOI] [PubMed] [Google Scholar]
- 13.Khan AJ, Vicini F, Beitsch P, et al. Local control, toxicity, and cosmesis in women younger than 50 enrolled onto the American Society of Breast Surgeons MammoSite Radiation Therapy System registry trial. Ann Surg Oncol. 2009;16:1612–1618. doi: 10.1245/s10434-009-0406-8. [DOI] [PubMed] [Google Scholar]
- 14.Chen PY, Wallace M, Mitchell C, et al. Four-Year Efficacy, Cosmesis, and Toxicity Using Three-Dimensional Conformal External Beam Radiation Therapy to Deliver Accelerated Partial Breast Irradiation. Int J Radiat Oncol Biol Phys. 2009 doi: 10.1016/j.ijrobp.2009.03.012. [DOI] [PubMed] [Google Scholar]
- 15.Dische S, Warburton MF, Jones D, et al. The recording of morbidity related to radiotherapy. Radiother Oncol. 1989;16:103–108. doi: 10.1016/0167-8140(89)90026-1. [DOI] [PubMed] [Google Scholar]
- 16.Liu T, Zhou J, Osterman KS, et al. Measurements of Radiation-Induced Skin Changes in Breast-Cancer Radiation Therapy Using Ultrasonic Imaging. Proceedings of the 2008 International Conference on BioMedical Engineering and Informatics - Volume 02: IEEE Computer Society; 2008. [DOI] [PMC free article] [PubMed] [Google Scholar]
- 17.Zhou J, Zhang P, Osterman KS, et al. Implementation and validation of an ultrasonic tissue characterization technique for quantitative assessment of normal-tissue toxicity in radiation therapy. Medical Physics. 2009;36:1643–1650. doi: 10.1118/1.3103935. [DOI] [PMC free article] [PubMed] [Google Scholar]
- 18.Warszawski A, Rottinger EM, Vogel R, et al. 20 MHz ultrasonic imaging for quantitative assessment and documentation of early and late postradiation skin reactions in breast cancer patients. Radiother Oncol. 1998;47:241–247. doi: 10.1016/s0167-8140(97)00201-6. [DOI] [PubMed] [Google Scholar]
- 19.Huang YP, Zheng YP, Leung SF, et al. High frequency ultrasound assessment of skin fibrosis: clinical results. Ultrasound Med Biol. 2007;33:1191–1198. doi: 10.1016/j.ultrasmedbio.2007.02.009. [DOI] [PubMed] [Google Scholar]
- 20.Huang YP, Zheng YP, Leung SF, et al. Reliability of measurement of skin ultrasonic properties in vivo: a potential technique for assessing irradiated skin. Skin Res Technol. 2007;13:55–61. doi: 10.1111/j.1600-0846.2006.00191.x. [DOI] [PubMed] [Google Scholar]
- 21.Alam SK, Lizzi FL, Feleppa EJ, et al. Multi-feature analysis for automated breast lesion classification from ultrasonic data. Bioengineering Conference, 2002. Proceedings of the IEEE 28th Annual Northeast; 2002. pp. 287–288. [Google Scholar]
- 22.Feleppa EJ, Fair WR, Liu T, et al. Three-dimensional ultrasound analyses of the prostate. Mol Urol. 2000;4:133–139. discussion 141. [PubMed] [Google Scholar]
- 23.Insana MF. Modeling acoustic backscatter from kidney microstructure using an anisotropic correlation function. J Acoust Soc Am. 1995;97:649–655. doi: 10.1121/1.412287. [DOI] [PubMed] [Google Scholar]
- 24.Zagzebski JA, Lu ZF, Yao LX. Quantitative ultrasound imaging: in vivo results in normal liver. Ultrason Imaging. 1993;15:335–351. doi: 10.1177/016173469301500405. [DOI] [PubMed] [Google Scholar]
- 25.Feleppa EJ, Lizzi FL, Coleman DJ, et al. Diagnostic spectrum analysis in ophthalmology: a physical perspective. Ultrasound Med Biol. 1986;12:623–631. doi: 10.1016/0301-5629(86)90183-3. [DOI] [PubMed] [Google Scholar]
- 26.Lizzi FL, Feleppa EJ, Kaisar Alam S, et al. Ultrasonic spectrum analysis for tissue evaluation. Pattern Recognition Letters. 2003;24:637–658. [Google Scholar]
- 27.Moran CM, Bush NL, Bamber JC. Ultrasonic propagation properties of excised human skin. Ultrasound Med Biol. 1995;21:1177–1190. doi: 10.1016/0301-5629(95)00049-6. [DOI] [PubMed] [Google Scholar]
- 28.Lizzi FL, Greenebaum M, Feleppa EJ, et al. Theoretical framework for spectrum analysis in ultrasonic tissue characterization. J Acoust Soc Am. 1983;73:1366–1373. doi: 10.1121/1.389241. [DOI] [PubMed] [Google Scholar]
- 29.Lu ZF, Zagzebski JA, Lee FT. Ultrasound backscatter and attenuation in human liver with diffuse disease. Ultrasound Med Biol. 1999;25:1047–1054. doi: 10.1016/s0301-5629(99)00055-1. [DOI] [PubMed] [Google Scholar]
- 30.Feleppa EJ. Ultrasonic tissue-type imaging of the prostate: implications for biopsy and treatment guidance. Cancer Biomark. 2008;4:201–212. doi: 10.3233/cbm-2008-44-504. [DOI] [PubMed] [Google Scholar]
Associated Data
This section collects any data citations, data availability statements, or supplementary materials included in this article.
Supplementary Materials
Fig. e1. Ultrasound B-mode breast images with hypodermis ROI demarked. (a) untreated breast, and (b) treated breast.
Fig. e2. Ultrasound B-mode image of the breast with the skin surface (arrow) and the subcutaneous tissue ROI demarked. The image dimensions are 38 mm (width) × 40 mm (depth).
Fig. e3. Calibrated tissue spectrum (black solid curve) with linear regression (red dotted line). The midband fit value is the spectrum intensity of the linear regression at the center frequency.