

Abstract
Children with congenital left hemisphere damage due to perinatal stroke are capable of acquiring relatively normal language functions despite experiencing a cortical insult that in adults often leads to devastating lifetime disabilities. Although this observed phenomenon accepted, its neurobiological mechanisms are not well characterized. In this paper we examined the functional neuroanatomy of lexical processing in 13 children/adolescents with perinatal left hemispheric damage. In contrast to many previous perinatal infarct fMRI studies, we use an event-related design, which allowed us to isolate trial related activity and examine correct and error trials separately. Using both group and single subject analysis techniques we attempt to address several methodological factors that may contribute to some discrepancies in the perinatal lesion literature. These methodological factors include making direct statistical comparisons, using common stereotactic space, using both single-subject and group analyses, and accounting for performance differences. Our group analysis, investigating correct trial related activity (separately from error trials), showed very few statistical differences in the non-involved right hemisphere between patients and performance matched controls. The single subject analysis revealed atypical regional activation patterns in several patients; however, the location of these regions identified in individual patients often varied across subjects. These results are consistent with the idea that alternative functional organization of trial-related activity after left hemisphere lesions is in large part unique to the individual. In addition, reported differences between results obtained with event-related designs and blocked designs may suggest diverging organizing principles for sustained and trial-related activity after early childhood brain injuries.
Introduction
Children with congenital left hemisphere damage due to perinatal stroke are capable of acquiring relatively normal cognitive function, such as language, despite experiencing a cortical insult that in adults often leads to devastating lifetime disabilities (Bates, 1999). Beginning with Jules Cotard in the mid-19th century (Cotard, 1868; Schiller, 1979), several investigators have documented the capacity of the developing brain to produce normal behavior following both experimental (Kolb & Wishaw, 2000) and naturally occurring lesions (Bates et al., 2001; Freud, 1968; Goldman, 1971). Although this observed phenomenon is well accepted, its neurobiological mechanisms are not well characterized.
Sigmund Freud (Freud, 1968) wrote that “even where aphasia occurs as a direct focal symptom because the lesion has destroyed the left-sided speech tract, a compensation can take place since the right cerebral half can take over the speech function…” This mechanistic concept of a compensatory shift of language to the right hemisphere is the earliest and currently most prominent view by which delayed, but normal, language development emerges after perinatal stroke.
The fact that persistent language deficits do not necessarily ensue in children with extensive congenital left hemisphere lesions (Hecaen, 1976; Vargha-Khadem, O'Gorman, & Watters, 1985) or, in the most extreme case, left hemispherectomies (Liegeois, Connelly, Baldeweg, & Vargha-Khadem; Strauss & Verity, 1983; Vargha-Khadem & Polkey, 1992), strongly supports the notion that the right hemisphere attains language functions when left hemisphere damage has occurred. Indeed, many investigators using functional imaging, such as PET and fMRI, have supported this notion by describing right hemispheric activation that essentially mirrors the normal left hemispheric activation pattern in healthy controls (Booth et al., 1999; Guzzetta et al., 2008; Hertz-Pannier et al., 1997; Muller, Rothermel et al., 1999; Muller, Rothermel, Behen, Muzik, Mangner, Chakraborty et al., 1998; Muller, Rothermel, Behen, Muzik, Mangner, & Chugani, 1998; Staudt et al., 2002; Staudt et al., 2001; Tillema et al., 2008).
However, despite this accumulating evidence, several other reports have shown that intrahemispheric reorganization supports the development of normal language after perinatal stroke. Investigators using techniques such as probe-evoked potentials (Papanicolaou, DiScenna, Gillespie, & Aram, 1990), intracarotid amobarbital (ICA) (Rasmussen & Milner, 1977), and neuroimaging methods (Liegeois et al., 2004) have described several instances in which organization of language following left hemispheric injury occurs in the ipsilateral hemisphere.
In some cases it is thought that the degree of left or right hemispheric lateralization after injury relates to the size of the lesion and/or depends on whether the lesion encroaches on language specific territories (Rasmussen & Milner, 1977). While there are certainly reports that support this notion, lesions outside of the classically referred language areas can also lead to right hemispheric lateralization (Liegeois et al., 2004; Staudt et al., 2001). These findings fit with an ‘interactive’ view of normal language development (Johnson, 2001), which suggests that normal developmental mechanisms interact with early onset pathology to yield alternative developmental trajectories. In this view, the alternative developmental trajectory and eventual adult functional neuroanatomy after early left hemisphere damage varies across subjects depending on the location, size and timing of the lesion (Fair, Brown, Petersen, & Schlaggar, 2006; Moses & Stiles, 2002; Webster, Bachevalier, & Ungerleider, 1995; Webster, Ungerleider, & Bachevalier, 1995).
Some of the discrepancies in the literature regarding this phenomenon are likely due to the techniques employed and the type of neural signals each technique is able to detect. For example, the probe-evoked potentials employed by Papanicolaou et al (Papanicolaou et al., 1990) have a low spatial resolution but typically examine neural signals on a very short temporal scale. On the contrary, the PET imaging employed by Muller et al (Muller, Behen et al., 1999) has a relatively finer spatial resolution but the temporal scale is much larger. It is possible that neural signals at different temporal scales organize (or reorganize) differently after perinatal injury. Even in typical adult populations neural signals on different temporal scales have varying functional neuroanatomy (Dosenbach, Fair, Cohen, Schlaggar, & Petersen, 2008; Dosenbach et al., 2006). Future discussion related to the alternate functional organization after perinatal stroke warrant such considerations.
Examining perinatal stroke with fMRI
Because of its non-invasive nature, seemingly easy application, and widespread availability, fMRI has become the major focus of studies examining the neurobiology of language development after early left hemispheric lesions (Fair et al., 2006; Guzzetta et al., 2008; Staudt et al., 2002; Tillema et al., 2008). However, while the application of fMRI to this patient population seems conceptually straightforward, there are several methodological issues that should be considered when interpreting results. These considerations, among others, include both the types and the temporal scales of the neural signals being extracted from the design strategy.
Event-related vs Blocked Designs
The two most frequently used experimental paradigms in fMRI are blocked and event-related (i.e., single trial) designs. In a blocked design, two experimental conditions alternate in a blocked fashion, such that participants perform one type of task repeatedly for a period of time and then switch to a different task. Functional activation is then assessed by comparing activity between the two conditions. In an event-related design, trials are presented in a ‘jittered’ fashion across an entire run, which allows for brain activity related to each trial type to be extracted separately.
There are several advantages and disadvantages of each design type, a full discussion of which is beyond the scope of this paper (but see Palmer et al 2004). However, there are some notable differences in these designs that are directly related to the interpretation of fMRI results related to childhood lesions. For example, the nature of blocked designs allows for a rapid presentation of trials, which adds to the power of detecting brain activations (Palmer, Brown, Petersen, & Schlaggar, 2004). Because large groups of patients with homogeneous lesions due to perinatal stroke are hard to come by, this optimization of power to detect is a notable benefit of blocked paradigms. On the other hand, the variable spacing between trials required by event-related designs reduces power, but allows for the differentiation of specific trial types. This differentiation is important because it is the only way to adequately separate trials on which the subject makes an incorrect response (i.e., error trial) from correct response trials. As noted above, this caveat is important when studying two groups that may perform differently in the scanner.
Another important difference between blocked and event-related designs concerns the types of signals they are able to detect. There is evidence to suggest that neural activity related to any particular task can be divided into specific subtypes. For example, the signal derived from typical blocked designs contains both sustained and trial-related transient signals. Event-related designs allow the investigation of trial related signals, but not sustained signals (Buckner et al., 1996, 1997; Buckner & Braver, 1999; Dale & Buckner, 1997).
Importantly, nearly all studies previously examining the functional neuroanatomy of left hemispheric childhood lesions with fMRI have used a blocked design strategy (Booth et al., 1999; Guzzetta et al., 2008; Liegeois et al., 2004; Staudt et al., 2002; Staudt et al., 2001; Tillema et al., 2008). To the best of our knowledge, only one case report has used an event-related design to examine organization after left hemisphere lesions specific to the trial-related activity (Fair et al., 2006). To advance our understanding regarding the neurobiological underpinnings of language development in the setting of early childhood insults, event-related designs will also need to be employed in order to isolate specific trial-related signals and to account for the effect of error trials (see below).
Importance of direct statistical comparisons and using common stereotactic space
One of the important methodological and conceptual shifts with regard to the use of fMRI in developmental cognitive neuroscience that has occurred over the last decade is the implementation of direct statistical comparisons between groups. Such a criterion has long been required for behavioral research, but only recently has this requirement permeated the developmental fMRI literature. For example, while examining statistical maps of brain activity separately for two different participant groups in a side-by-side fashion may provide a reasonable starting point for examining differences, such purely qualitative comparisons provide no probabilistic measure of the reliability of similarities and differences in regional activation patterns between groups (Palmer et al., 2004). Direct statistical comparison has not consistently been implemented in studies that compare perinatal stroke populations with control populations.
One of the reasons why direct statistical comparisons were slow to evolve in the developmental fMRI literature was the general notion that children and adults could not be adequately aligned into the same stereotactic space. However, this issue has now been addressed empirically with data demonstrating adequate alignment down to age 7 years (Burgund et al., 2002; Kang, Burgund, Lugar, Petersen, & Schlaggar, 2003; Muzik, Chugani, Juhasz, Shen, & Chugani, 2000). However, adequate alignment into a common space of a brain that has suffered a large perinatal infarction or lesion is not a trivial endeavor. Not only does the lesioned hemisphere cause difficulties with appropriate transformation, the non-uniform, atypical hemispheric structure in the contralesional hemisphere can also add significant complexity to this issue. This issue is especially difficult with perinatal stroke because the deformation of non-involved tissue appears to be more substantial than when the lesion occurs in a mature brain. As the field moves forward with studies examining the consequences of congenital lesions, adequate transformation into common stereotactic space, or some other method allowing comparison of similar cortical regions (e.g. (Cohen et al., 2008)) will be key to support the ability to perform direct comparisons between groups.
Accounting for performance differences
The importance of assessing in-scanner task performance differences between groups in developmental functional neuroimaging has been recognized (Brown et al., 2005; Casey, Galvan, & Hare, 2005; W. D. Gaillard, Grandin, & Xu, 2001; Schlaggar et al., 2002). Consider the comparison of two groups with differing levels of in-scanner task performance. Demonstrations of group differences in functional neuroanatomy of the task at hand are potentially confounded by the performance confound. Any functional differences identified may be driven, in this case, by performance differences per se, or by fundamental differences in task processing between the groups, or both. It is now generally accepted that results from studies that do not account for performance differences between groups need to be interpreted with greater caution. For these reasons, a study that compares children with congenital lesions to typically developing children should consider performance differences between the groups.
It is important to note that while performance effects in functional imaging studies can be, and are often identified in the absence of error trials (see (Brown et al., 2005; Schlaggar et al., 2002)), the functional neuroanatomy of errors are not identical to that of a correct trials (Dosenbach et al., 2006). Thus the inclusion of errors in an fMRI analysis will significantly impact activation patterns (see (Murphy & Garavan, 2004)). Even if accuracy is the same between groups (i.e., the same number of errors), assessment of any results collapsing across correct and error trials would have to assume that the functional neuroanatomy of error processing is the same between the groups. As investigations of childhood lesions advance, it will be important to differentiate errors and performance differences.
Overview
In this paper we examine the functional neuroanatomy of controlled and simple lexical processing tasks (for which we have well-described cross-sectional developmental fMRI data (Brown et al., 2005; Church, Coalson, Lugar, Petersen, & Schlaggar, 2008; Schlaggar et al., 2002)) in a group of patients with early childhood lesions. In contrast to previous fMRI studies, we use an event-related design, which makes this study unique in two ways. First, the event-related design allowed us to assess the functional neuroanatomy in patients specific to trial related activity. Second, the design allowed us to examine correct trials and error trials in isolation to assess the effect of error trials in the overall image. We use both group and single subject analysis techniques to observe functional differences with controls that are common across the group and also unique to the individual patient. Data from all patients and controls are aligned in the same stereotactic space to allow for direct comparisons, with a supplementary analysis that examines the quality of the transformation.
Methods
Subjects
All patients were under the age of 13 (n=13, mean = 9.73y; range 7.34-12.27y; n = 6 males), were native English speaking, and had congenital right hemiparesis due to perinatal left hemispheric damage. Control subjects consisted of 111, right-handed, native English speaking subjects (mostly recruited from Washington University and the surrounding area) 7-32 years old. All subjects were remunerated for participation. Minor control subjects were examined by a pediatric neurologist (B.L.S), and completed a detailed health questionnaire to assess typical development. Most patients were also administered neuropsychological tests to document intellectual level (see Table 1). Because of an inability to schedule a second visit for many of the control subjects, a complete set of neuropsychological measures was not obtained, and is thus not presented here for controls. For the subgroup of control subjects whose psychometric data were obtained, full scale IQ was typically in the High Average range (see (Brown et al., 2005)).
Table 1. Subject Demographics.
| Age | Verbal IQ | Performance IQ | Full Scale IQ | Range | |
|---|---|---|---|---|---|
| S1 | 9.25 | 103 | 107 | 106 | Average |
| S2 | 10.54 | - | - | - | - |
| S3 | 8.25 | - | - | - | - |
| S4 | 11.22 | - | - | - | - |
| S5 | 7.65 | 95 | 76 | 84 | Low Average |
| S6 | 12.46 | 120 | 106 | 115 | High Average |
| S7 | 10.48 | 119 | 107 | 115 | High Average |
| S8 | 11.03 | 117 | 93 | 106 | Average |
| S9 | 7.34 | 106 | 100 | 104 | Average |
| S10 | 8.92 | 85 | 93 | 87 | Low Average |
| S11 | 7.53 | 116 | 84 | 99 | Average |
| S12 | 9.65 | 86 | 98 | 90 | Extremely low |
| S13 | 12.27 | 114 | 119 | 118 | High Average |
Patients and controls were acclimated to the MRI environment in a “mock” scanner several days before the actual scanning sessions. Informed consent was obtained from adult subjects. Subjects under the age of 18 years gave assent with parental informed consent. The Washington University Human Studies Committee approved the study.
Word Generation Tasks
For this report, all subjects performed 8-17 runs (see SI Table 4) of event-related functional magnetic resonance imaging (fMRI) studies on a set of controlled and simple lexical processing tasks for which we have well-described cross-sectional developmental fMRI data (Brown et al., 2005; Church et al., 2008; Schlaggar et al., 2002). These tasks included: verb-, rhyme-, opposite generation (to both auditory- and visual-presented words), reading, and repeating. As previously described (Brown et al., 2005; Church et al., 2008; Schlaggar et al., 2002), single word stimuli were presented serially and subjects were asked to say aloud a single word response for each. For example, for verb generation a correct response after being presented with the word ‘CAR’ would be to say “drive”. These tasks were initially designed to identify developmental semantic and phonological processing differences. However, the absence of robust functional neuroimaging differences between tasks has resulted in a strategy of collapsing across tasks. These data have afforded us a well-described developmental trajectory (Schlaggar et al 2002, Brown et al 2005) and an enriched source of defined ROIs for application to the study of individual patients (Fair et al 2006). More detailed descriptions of the task paradigm are available elsewhere (Brown et al., 2005; Church et al., 2008; Schlaggar et al., 2002).
MRI data acquisition
fMRI data were acquired on a Siemens 1.5 Tesla MAGNETOM Vision system (Erlangen, Germany). Subjects' heads were stabilized using pillows and a thermoplastic mask. Structural images were obtained using a sagittal magnetization-prepared rapid gradient echo (MP-RAGE) three-dimensional T1-weighted sequence (TR = 9.7 ms, TE = 4 ms, flip angle = 12°, TI = 300 ms, voxel size = 1.25 × 1 × 1 mm, slices = 128). Functional images were obtained using an asymmetric spin echo echo-planar sequence sensitive to blood oxygenation level-dependent (BOLD) contrast (TR = 3.08 s, T2* evolution time = 50 ms, flip angle = 90°, voxel size = 3.75 × 3.75 mm in-plane resolution, slices = 128). During each scan, 73 frames of 16 contiguous interleaved 8 mm axial slices were acquired parallel to the plane transecting the anterior and posterior commissures (AC-PC plane), allowing complete brain coverage. Steady state was assumed after three frames (∼ 9 s). Thus, acquisition of functional imaging data began with the fourth frame of each run.
Data preprocessing
Functional images were preprocessed to remove noise and artifacts (Miezin, Maccotta, Ollinger, Petersen, & Buckner, 2000). This preprocessing included removal of a single pixel spike caused by signal offset, whole-brain normalization of signal intensity across MR frames, correction for subject movement within and across runs, and slice-by-slice normalization to correct for changes in signal intensity introduced by the acquisition of interleaved slices.
During scans, to encourage minimal movement, subjects were positioned in the scanner using a thermoplastic mask individually fitted to the face and attached to the head coil. Subject motion was corrected and quantified using an analysis of head position based on rigid body translation and rotation. The data derived from the adjustments needed to realign head movement on a frame-by-frame basis were calculated as root mean square (RMS) values for translation and rotation in the x, y and z planes in millimeters. Total RMS values were calculated on a run-by-run basis for each subject derived from deviations from the initial position for each run. For each subject, a median RMS was calculated for all runs. Bold runs with movement greater than 1.7mm were removed from the analysis (see SI Table 4).
Prior to statistical analysis, BOLD data were registered to the structural (MP-RAGE) data for a given subject. Data from all subjects were transformed into the same stereotaxic space (Talairach & Tournoux, 1988) allowing for direct voxel-wise statistical comparisons. The feasibility of this approach for comparing school-age children and young adults has been established in prior investigations (Burgund et al., 2002; Kang et al., 2003). Because of the effect of lesions on atlas transformations, similar to Connor et al, and Fair et al (Connor et al., 2005; Fair et al., 2006), we minimized errors by a second iteration for the patients whereby we either masked out the lesion or the entire lesioned hemisphere for a supplementary computation. To ensure the quality of our transformation a subsequent analysis was performed based on techniques outlined by Burgund et al (Burgund et al., 2002) (see SI Analysis). Briefly, this procedure entails tracing 10 selected sulci, as well as the brain's outer boundaries on single image slices with fixed coordinates. The coordinates of these sulci and boundaries are then compared between the stroke group and a control population (For details see SI Analysis). Importantly, transformation procedures were maximized for alignment of the contralesional (i.e. right) hemisphere. Large lesions, and structural abnormalities present in the left hemisphere of many subjects did not allow for appropriate alignment. Thus, while analyses included the left hemisphere (and left hemisphere data are presented in some cases for completeness), reliable comparisons were limited to the right hemisphere.
Imaging data Analysis
Statistical analyses of preprocessed data were analyzed on a voxel-by-voxel basis based on the general linear model (GLM) (Brown et al., 2005; Fair et al., 2006; Miezin et al., 2000; Schlaggar et al., 2002) as implemented by in-house software programmed in the Interactive Data Language (IDL; Research Systems, Inc., Boulder, CO).
The GLM design included time as a seven level factor, made up of the seven MR frames following presentation of the stimulus. This method does not assume a response shape. The HRF was modeled over a period of ∼ 21 s (7 frames, 3.08 s per frame). As previously reported (Brown et al., 2005), outlier timecourses - defined as those regions showing any time point greater than 2% signal change - were removed from the following analysis. For visualization, volumetric regions described below were plotted on the surface anatomy of the PALS (population – averaged landmark and surface – based) atlas (Van Essen, 2005).
Group comparisons
Voxel-wise analysis
To identify group differences, we identified 13 control subjects (from our total sample of 111) matched for age (∼9.28years) and performance to the 13 patients (see Table 1). To test for overall group differences, we included group membership as a between-participants factor in the GLM. An ANOVA model was used with Group membership (2 levels: stroke group and controls) and Time (7 levels: 7 time points) as factors. Using these groups, we created a main effect of time (MET) image, thresholded at a relatively high significance level, which likely constitute brain regions that are statistically similar between the two groups. Difference in activation patterns of (correct trials) between patients and controls was expressed as a significant Group × Time interaction, on a voxel-wise basis (see Figure 2). For both images, a voxel-wise correction based on Monte Carlo simulation was implemented to guard against false positives that may result from conducting a large number of statistical comparisons over many images (Forman et al., 1995). To achieve a significance level of .05 corrected for voxel clusters, we used a threshold of 45 contiguous voxels with a z value no less than 3. An uncorrected image for this comparison is also provided in SI material (see SI Figure 2).
Figure 2. Main effect of time and the group × time interaction images for correct trials in patients and controls.
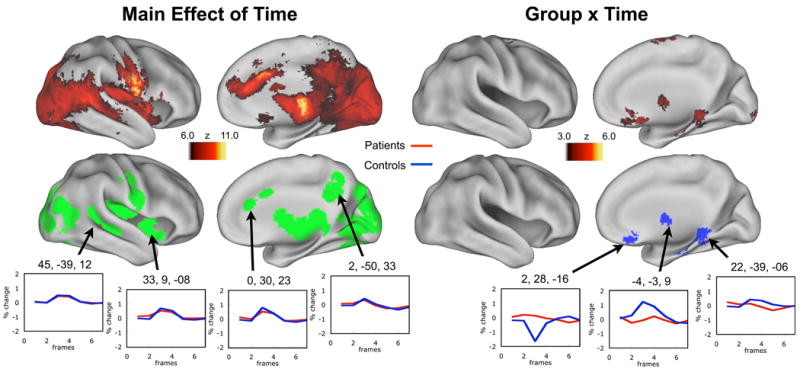
The highly significant main effect of time timecourses represent activations for correct trials that are likely similar between patients and controls (see example timecourses). Significant differences between the groups are demonstrated in the group × time interaction image maps. This group level analysis revealed a pattern of activation in the right hemisphere across both groups similar to what has been previously observed with these tasks, but few differences existed between the groups. Both images are corrected for multiple comparisons. Regions of interest established from the main effect of time image are plotted in green. Regions of interest established from the group × time interaction are plotted in blue. Qualitative side-by-side comparisons of each group are also presented in SI Figure 1. An uncorrected group × time image with timecourses is also presented in SI Figure 2.
A similar qualitative analysis was done to show the potential effects of errors and movement on activation profiles of the stroke subjects. In this analysis a 7 level (7 levels: 7 time points) main effect of time (MET) analysis was done on 3 separate trial type iterations of the stroke subjects (correct trials only, correct trials + error trials, error trials only). Bold runs with movement greater than 1.7mm were also included for this subsequent analysis.
Analysis using a priori regions of interest
Two a priori region sets were also examined in this group analysis. These regions were derived from a previous study examining functional development of these tasks in a typical developing population. One region set was “Age/Performance independent” regions, where activity does not change with age or performance. The other region set was “Age-Related” regions, where activity does change with age independent of performance for these tasks (Brown et al., 2005). A region-wise ANOVA was employed with Group membership (2 levels: stroke group and controls) and Time (7 levels: 7 time points) as factors.
Single-subject vs cohort comparisons
To test for activation patterns that may not be common to the group, but unique to the individual, a single subject approach was used to identify significant differences within individual patients. This approach accounts for the variability in the control population and is outlined in Fair et al (Fair et al., 2006) and Turkeltaub et al (Turkeltaub et al., 2004). This approach is summarized below.
Phase 1: Determining regions of interest
For the single subject analysis three regions sets were examined for each subject: 1) MET regions of interest (ROIs) acquired from each individual patient, 2) Age/Performance independent regions (see above), and 3) Age-related regions (see above).
To characterize regions from patients the GLM paradigm described above was implemented for each individual task run to allow for a single subject analysis. Timecourse values for each task run were then entered into an ANOVA using a random effects model. The statistical image created was a main effect of time (1 factor: time; 7 levels: 7 time points) that showed voxels whose timecourses had a statistically significant deviation from zero for the individual scans. From this image, peaks were identified and regions were defined using an algorithm to obtain the center of mass and cluster coordinates for statistically significant voxels. Peaks were identified using a 4 mm hard sphere pre-blur and a statistical threshold of z > 2.0. Regions were then defined beginning with a radius of 10mm and by consolidating regions with peaks closer than 10mm. To account for variability and potential differences in statistical power for each single subject, the statistically strongest 35 regions in the aligned right hemisphere for each subject were used for the following analyses.
Phase 2: Identifying a normally distributed control population for each patient
The second phase of the analysis required identifying a normally distributed control population or cohort for each patient, as described in Fair et al (Fair et al., 2006). Using our dataset of 111 healthy, typically developing children and adults we were able to make a reasonably large cohort for each patient. These cohort subjects were required to be within 1.5 years of the patient's age at time of scanning.
Phase 3: Comparing peak activity in each patient to the normally distributed control population
In the third step, for each ROI, the activity magnitude from an individual patient was compared to the normally distributed peak activity for his/her age-matched controls and presented as an absolute z-score [| (meansubject - meancontrols)/stan.dev.controls |]; hereinafter |z|. Due to the variability of peaks per individual between time points 3 and 4, we defined peak activity as being an average of these two time points.
Results
Subject characteristics
To document intellectual level, patients were administered the Wechsler Abbreviated Scale of Intelligence (WASI) (Wechsler, 1999) (the WASI for 3 subjects was not obtained). These behavioral measures are summarized in Table 1. Most, but not all, patients' intellectual functioning was in the average range.
For the group analysis described below patients and control subjects were matched for performance and age, and thus showed no significant differences between these factors (see Table 2). For the single subject analysis subjects were examined in relation to their cohorts. The majority of the subjects did not significantly deviate with regard to reaction times and accuracy compared to their cohorts (see Table 3). Two subjects had |z| scores greater than 2 with regard to reaction times, and 3 subjects had |z| scores greater that 2 with regard to accuracy (see Table 3).
Table 2. Group Behavior.
| Mean Age | %C | RT | |
|---|---|---|---|
| Patients | 9.74 | 57.79 | 1640.11 |
| Controls | 9.28 | 66.11 | 1614.77 |
| P-value | 0.46 | 0.47 | 0.50 |
Table 3. Single Subject versus Control Cohort Behavior.
| % correct | Reaction Time | |||||||
|---|---|---|---|---|---|---|---|---|
| Subject | Stroke Subject | Controls AVG | Controls SD | Z-Score | Stroke Subject | Controls AVG | Controls SD | Z-Score |
| S1 | 75.00 | 71.23 | 9.88 | 0.38 | 2683.06 | 1414.83 | 360.85 | 3.51 |
| S2 | 63.33 | 80.36 | 9.05 | -1.88 | 1506.7 | 1579.61 | 353.24 | -0.21 |
| S3 | 59.52 | 70.27 | 13.23 | -0.81 | 1719.97 | 1794.78 | 422.16 | -0.18 |
| S4 | 53.17 | 81.90 | 12.89 | -2.23 | 2512.60 | 1447.83 | 258.19 | 4.12 |
| S5 | 42.86 | 64.59 | 18.99 | -1.14 | 1289.50 | 1713.18 | 437.14 | -0.97 |
| S6 | 59.52 | 70.27 | 13.23 | -0.81 | 1719.97 | 1794.78 | 422.16 | -0.18 |
| S7 | 86.90 | 83.78 | 11.91 | 0.26 | 1637.30 | 1494.03 | 449.14 | 0.32 |
| S8 | 75.60 | 83.34 | 10.07 | -0.77 | 1090.38 | 1418.18 | 394.20 | -0.83 |
| S9 | 71.53 | 77.27 | 12.52 | -0.46 | 2459.99 | 1661.83 | 429.48 | 1.86 |
| S10 | 35.71 | 76.79 | 14.15 | -2.90 | 1815.27 | 1613.10 | 498.15 | 0.41 |
| S11 | 50.79 | 75.27 | 13.21 | -1.85 | 1230.12 | 1531.39 | 476.40 | -0.63 |
| S12 | 46.26 | 82.96 | 8.23 | -4.46 | 2109.89 | 1550.04 | 450.92 | 1.24 |
| S13 | 83.93 | 87.76 | 8.82 | -0.44 | 1042.89 | 1322.68 | 296.96 | -0.94 |
Alignment Results
To validate the quality of our transformation process we employed an analysis procedure previously used to examine the transformation between children and adults (Burgund et al., 2002). Our direct comparison of post-transformation anatomical landmarks between patients with early left hemispheric injury and age-matched controls suggests that the spatial transformation methods applied here do not significantly distort the anatomy of the non-lesioned hemispheres. The full statistical analysis of this result can be found in SI Analysis. Figure 1 provides a qualitative illustration demonstrating the quality of the transformation. We note here that while we were successful in accurately aligning the non-lesioned hemisphere into talaraich space, doing so in the lesioned hemisphere proved much more difficult and we were unable to do so for all patients. Subject 2 provides a salient example of where such transformation proved unattainable with the current rigid affine transformation techniques employed in this manuscript.
Figure 1. Structural MRI images of patient lesions.
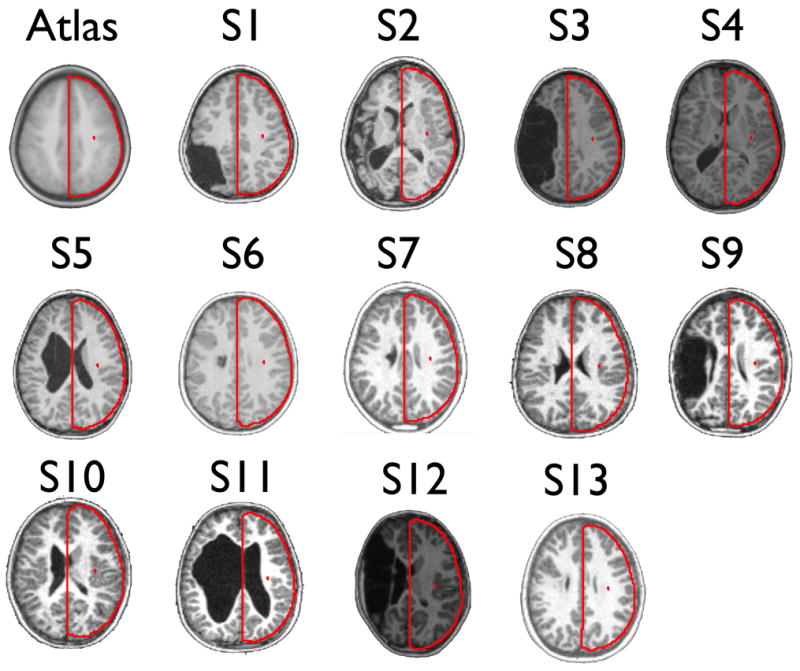
Representative T1-weighted transverse images of 13 patients. Red outlines of the target atlas (upper left) are displayed on each structural image to demonstrate qualitatively the grade of our atlas transformation technique. A quantitative analysis of the quality of the transformation procedure is provided in SI analysis.
Group Comparison
Correct trials
The group level analysis revealed a pattern of activation in the right hemisphere across both controls and patients similar to what has been previously observed with these tasks (Brown et al., 2005) (Figure 2) (Of note at this young age, ∼9.73 years, these lexical control tasks examined with an event-related design do not produce qualitatively asymmetric activation patterns (see SI Figure 1 and also (Brown et al., 2005)). The main effect of time image across both groups identified a total of 41 regions, whose coordinates overlapped nicely with previously published reports of the described lexical tasks at this young age group (see SI Table 1). The magnitude of activation for these regions was largely the same for both groups (see timecourses in Figure 2).
Interestingly, the direct comparison between the two groups revealed very few differences. After multiple comparisons correction only 4 regions were identified as being significantly different between the two groups. These statistical differences are shown in Figure 2 (also see SI Table 1). Because of the limited power due to relatively small numbers of subjects we also examined differences between the groups that did not survive multiple comparisons correction (See SI Figure 2). Regions of this type, which appeared in the right hemisphere were often, but not always, the result of greater activity in the controls relative to patients (See SI Figure 2).
Of note, for Figure 2 we only present the right (unlesioned) hemisphere because we were unable to attain appropriate alignment of the injured left hemisphere across all subjects (see section ‘Alignment results’ above and SI Analysis). With this said, the results for the left hemisphere activations are presented in SI Figure 1 and SI Figure 2. However, while we present the results in SI material for completeness, the results are potentially misleading and should be interpreted cautiously.
Potential effects of error trials and excessive movement
In a qualitative analysis we present the potential effects of errors and movement on side-by-side activation maps in stroke patients. Sample MET images for correct trials (only), correct and error trials, and error trials (only) are shown in Figure 3 for the stroke patients in which BOLD runs with movement greater than 1.7mm root mean square were not removed (for presentation purposes here we show the activation patterns of the left hemisphere in the stroke patients despite inadequate alignment). We note the pattern of activation for the selected slices is not identical for error and correct trials. Qualitatively there are instances of activation showing greater significance for errors than correct trials, and others where activations show greater significance for correct trials than error trials. The combination of a misaligned lesioned hemisphere, excessive movement, and the inclusion of error trials can lead to the perception of lateralized activation. Importantly, even if runs with excessive movement are removed, potentially misleading activation patterns due to the inclusion of errors can persist (see SI Figure 3).
Figure 3. Potential effect of errors and movement on qualitative visualization of patient data.

Main effect of time images are presented for correct trials (only), correct and error trials, and error trials (only) across all 13 patients in which BOLD runs with movement greater than 1.7mm root mean square were not removed. Activation patterns are not identical across these image classes. Blue arrows highlight instances where activity showed greater significance for errors than correct trials and vice versa. The combination of a misaligned lesioned hemisphere, excessive movement, and the inclusion of error trials can lead to the perception of lateralized activity. Even when runs with excessive movement are removed, potentially misleading activation patterns owing to the inclusion of errors can persist (see SI Figure 3).
Single Subject
As previously reported (Fair et al., 2006), for our single subject analysis, the |z| values for most ROIs identified in the individual patients were relatively low (i.e., <2). Of the 455 single subject MET regions (35 right hemisphere regions per subject), 62 had an |z| > 2 (see SI Table 2). Of the 286 comparisons of the previously defined Age-Related ROIs (22 regions examined separately in 13 subjects), 28 were identified with an |z| > 2 (see SI Table 2). Of the 260 comparisons of the previously defined Age/Performance Independent ROIs (20 regions examined separately in 13 subjects), 32 were identified with a |z| > 2 (see SI Table 2). Patients were heterogeneous with regard to how many ROIs were identified where activity significantly deviated from that in their cohorts (i.e., some subjects showed more differences than others) (see SI Table 2).
As with the group analysis above, the data suggest that most regions in the right hemisphere exhibit ‘normal’ levels of activation; however, most subjects did have regions in the right hemisphere that significantly deviated from their age-matched cohorts. For examples see Figure 4 for the patient's MET regions and Figure 5 for the previously defined Age-related and Age/Performance Independent ROIs. Interestingly, there was little consistency across the stroke subjects with regards to which regions differed. This inconsistency is highlighted in the conjunction image in SI Figure 4, which combines regions deemed significantly different (in the single subject analysis) across the entire stroke population. Here, no more than 3 subjects showed overlap in any voxel for activated regions that significantly differed from their respective cohorts. The lack of overlap is also highlighted in the fixed effects analysis of the pre-defined Age and Age/Performance independent regions (see SI Figure 5). Only 3 regions had a fixed effects |z| > 2 (see SI Table 3). Both of these figures suggest that there was very little overlap across subjects in the location of regions that significantly deviated from their respective cohorts. These data suggest that atypical trial-related activation in the right hemisphere of the patients is quite variable.
Figure 4. Examples of single subject/patient analysis.
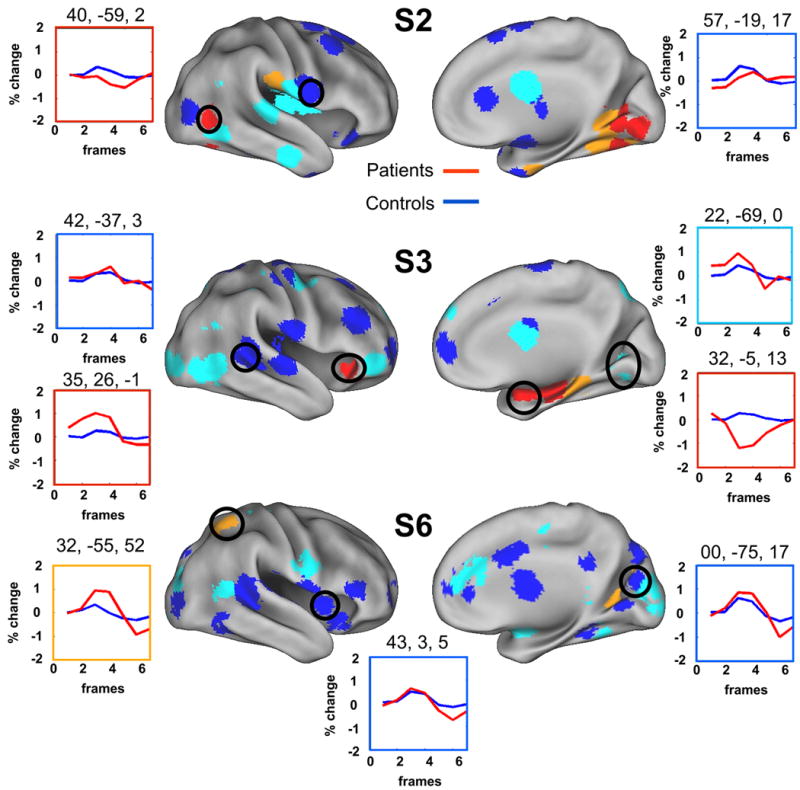
Each patient MET region is color coded by absolute z score values (blue: |z| < 1; light blue: 1 < z < 2; orange: 2 < z < 3; red: _z > 3). Example time courses for patient (red line) and control cohorts (blue line) are also presented. As previously reported (Fair et al., 2006), the |z| values for most ROIs identified in the single subjects were relatively low (i.e., <2) (for complete list see SI Table 2). The number and location of regions that significantly differed from the individual cohorts varied across subjects (see SI Table 2). Black circles correspond to the regions of interest for which timecourses are plotted.
Figure 5. Examples of single subject/patient analysis for pre-defined regions of interest.
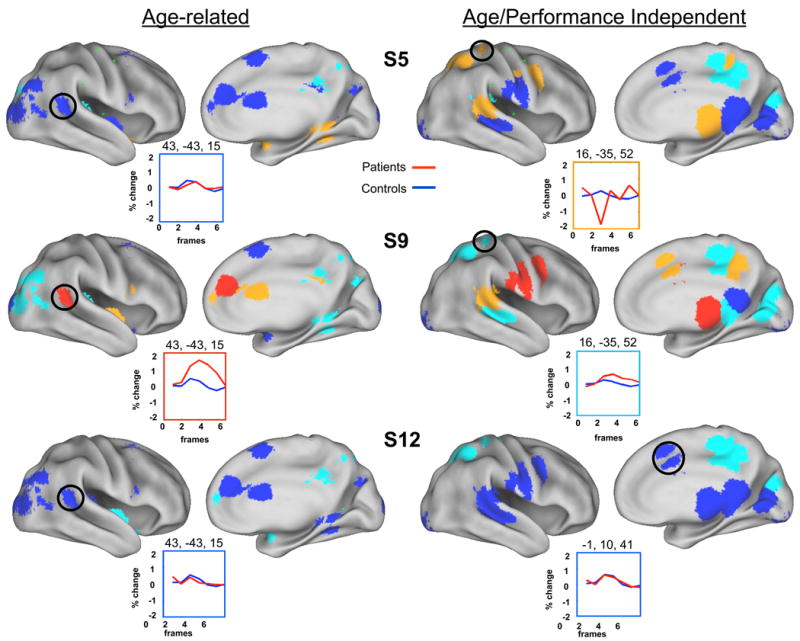
Predefined ROIs from Brown et al (Brown et al., 2005) were examined with the single subject analysis. Each region is color coded by |z| values (blue: |z| < 1; light blue: 1 < z < 2; orange: 2 < z < 3; red: _z > 3). Example time courses for patient (red line) and control cohorts (blue line) are also presented. As with the single subject MET regions examined in Figure 4, the |z| values for most ROIs were relatively low (i.e., <2), and the types of differences with regard to location and number varied across subjects.
Discussion
In this paper we examined the functional neuroanatomy of lexical processing in 13 patients with perinatal left hemispheric damage who were all under the age of 13 years. In contrast to nearly all previous fMRI studies examining the functional neuroanatomy of perinatal left hemispheric lesions, we use an event-related design, which allowed us to isolate trial related activity and examine correct trials and error trials separately. Using both group and single subject analysis techniques we also attempt to address several methodological factors that may be contributing to some of the discrepancies in the perinatal lesion fMRI literature. These methodological factors include making direct statistical comparisons, using common stereotactic space, using single-subject and group analysis techniques, and accounting for performance differences.
Despite our efforts to consider these methodological concerns, there were other aspects of our study that we hope to improve in future work. For example our patient population did not have homogenous lesion size or location. In addition, while our alignment procedure produced fairly consistent results and allowed for direct comparisons between the intact hemispheres of controls and patients, the alignment results were imperfect (see SI Analysis). Lastly, while all subjects had congenital hemiplegia, the vascular classification of the infarctions likely included a heterogeneous group of ischemic stroke of the middle cerebral artery, ischemic stroke of the lateral lenticulostriate, as well as perivenous infarction (see (Kirton, Deveber, Pontigon, Macgregor, & Shroff, 2008)).
The combination of concerns for which we were able to control, and those for which we could not, only highlights the difficulties investigators engage when examining perinatal stroke with neuroimaging techniques. Many of these concerns likely contribute to the discrepancies in the literature. Nonetheless, there are several key observations presented in this manuscript that should help advance the field.
Atypical trial-related activations in the right hemisphere after perinatal stroke appear to be unique to the individual rather than common across the group
The use of an event-related design and the context provided by a large sample of control subjects allowed for a unique perspective on perinatal stroke data. Our group analysis, investigating correct trial related activity only, showed very few statistical differences in the non-involved right (well-aligned) hemisphere between patients and performance matched controls (Figure 2). Such a finding could result from 3 distinct circumstances. First, there could be no differences in the functional neuroanatomy between stroke patients and controls that are measurable with fMRI. This scenario is unlikely considering the substantial literature which points to the contrary (Booth et al., 1999; Guzzetta et al., 2008; Hertz-Pannier et al., 1997; Muller, Rothermel et al., 1999; Muller, Rothermel, Behen, Muzik, Mangner, Chakraborty et al., 1998; Muller, Rothermel, Behen, Muzik, Mangner, & Chugani, 1998; Staudt et al., 2002; Staudt et al., 2001; Tillema et al., 2008). Second, most differences between the groups could be located in the left, ipsilesional hemisphere. This scenario would be consistent with results by Papanicolaou et al and Liegeois et al, revealing atypical ipsilesional functional organization of language following left hemispheric injury (Liegeois et al., 2004; Papanicolaou et al., 1990). Lastly, differences could be variable across subjects such that group consistencies did not emerge. This consideration would be consistent with results that suggest that language function after left hemispheric stroke is organized into the left, right, or both hemispheres depending on the size and location of the lesion (Fair et al., 2006; Rasmussen & Milner, 1977).
Considering these alternatives, we also employed a strategy for identifying alternative functional neuroanatomic patterns of activity in children with perinatal stroke at the individual level. This strategy utilizes our large control sample and allows for a statistical comparison of functional activity of any one individual patient to a relatively large normative cohort. This procedure allows for the statistical identification of functional differences that may be unique to the individual and is independent of lesion heterogeneity.
Results from the single subject analysis were more consistent with the idea that alternative functional organization of trial-related activity after left hemisphere lesions is in large part unique to the individual. We did identify instances in a number of subjects where alternative functional neuroanatomic patterns of activity occurred in the contralesional, right hemisphere, suggesting that atypical organization does not limit itself to the involved hemisphere. As with the group analysis, differences that were identified in the individual subjects did not generalize across the group (SI Figure 4 & 5). However, because we were unable to properly align the lesioned hemisphere, we can not rule out the possibility of common ipsilesional/perilesional activations across the patient group that help support language function after insult.
Event-related versus Blocked Designs
We note that our result is quite different from blocked fMRI studies, which have typically shown a flip of function to the contralesional hemisphere (Guzzetta et al., 2008; Staudt et al., 2002; Tillema et al., 2008). Importantly, in these previous studies the effect of error trials could not be removed because of the blocked design, and excessive movement was not consistently addressed. In our analysis we were able to observe the potential effect of errors and movement by including them in a subsequent analysis of the stroke patients. As can be seen in Figure 3, qualitatively, the functional neuroanatomy of errors is not identical to that of correct trials. The consequence of including error trials in the analysis ought to be explicitly considered for any fMRI study that examines patients with perinatal stroke, particularly when in-scanner performance is discrepant.
We should reiterate that the patients imaged in the present study were under the age of 13 years. Considering the dynamic changes in activation patterns which occur over development for these tasks (see (Brown et al., 2005; Schlaggar et al., 2002)), it is quite possible and likely that consistent right hemispheric lateralization will develop for these subjects as they mature.
It is also important to note that the current findings are not necessarily in direct conflict with previous results obtained with blocked fMRI, which have shown primarily right hemisphere activations with left hemisphere lesions (Guzzetta et al., 2008; Staudt et al., 2002; Tillema et al., 2008). As noted in the Introduction, an important distinction between blocked and event-related designs concerns the types of signals they are able to detect. Several single unit recording, ERP, and fMRI studies have shown that evoked activity related to any particular task can be divided into specific subtypes (Bushnell et al., 1981; Donaldson, 2004; Donaldson & Buckner, 2001; Dosenbach et al., 2006; Hillyard et al., 1973; Visscher et al., 2003; Wenger et al., 2004) (i.e., activity related to each trial of a task, and activity that is sustained across an entire task block). Event-related designs, as used here, are unable to investigate sustained activity across an entire task block, whereas blocked designs by their nature examine both of these signals but are unable to differentiate between the two. It is plausible that sustained activity, as opposed to trial-related activity, does indeed flip to the contralesional hemisphere, but that trial-related activity (at least at these young ages) does not. Evidence for this dichotomy between trial-related activity and sustained activity may exist in the typical developmental literature where controlled lexical tasks, similar to the ones employed in this manuscript, examined in a blocked design show distinct left hemispheric lateralization in early childhood (Gaillard et al., 2000; Gaillard et al., 2003; Holland et al., 2001; Szaflarski, Holland, Schmithorst, & Byars, 2006; Wilke et al., 2005). In event-related designs, which examine only the trial-related activity for these tasks, left hemispheric lateralization appears to develop later in maturity (Brown et al., 2005; Schlaggar et al., 2002). Results using probed-evoked potentials by Papanicolaou et al (Papanicolaou et al., 1990) provide another example of where activity examined on a shorter temporal scale deviates from the more common result of right hemispheric lateralization after left hemispheric damage.
The potential distinction between sustained and trial-related activity revealed here may relate to language specific task-level control mechanisms in the patients. It is believed by some that top-down control, essential for enhanced selection of task-relevant information, is implemented by a distributed set of brain regions, which include regions commonly activated during language tasks (Bitan et al., 2006; Bitan, Cheon, Lu, Burman, & Booth, 2009 in press; Dosenbach et al., 2008; Dosenbach et al., 2006; January, Trueswell, & Thompson-Schill, 2008).
Importantly, control related processing comes in multiple forms – some control processing is sustained across an entire task block and is thought to be important for maintaining task set. Other control processing works on a faster timescale and is important for the moment-to-moment processing demands (Dosenbach et al., 2008). It is possible that the previously identified regions which appear to switch to the contralesional hemisphere after early left hemispheric injury are important for maintaining task sets, contain sustained activity, and are thus more readily identifiable with blocked designs. To the contrary, the developmental course of the moment-to-moment, trial related activity might take a different trajectory and be more variable from subject to subject after early left hemisphere damage. The variable results from the Intracarotid Amytal study (Rasmussen & Milner, 1977), which injected a pharmacologic agent that presumably affects both signal types, lends credence to this view. Future work that integrates event-related and blocked designs such as the mixed blocked/event-related designs capable of identifying both trial-related and sustained activity is well suited to investigate this possibility (Donaldson, Petersen, Ollinger, & Buckner, 2001 & Buckner, 2001; Visscher et al., 2003), and is validated in children (Wenger et al., 2004).
Conclusions
In this paper, we attempt to address some significant methodological concerns when using fMRI to study the functional neuroanatomy of lexical processing in children with perinatal stroke. However, there are several other considerations and concerns related to the current study that we could not address. As mentioned above we were not in a position to address the potential impact of sustained activity on the alternative functional organization in patients with perinatal stroke. In addition, other signals related to developing brain function such as intrinsic spontaneous brain activity will be of interest as the field moves forward (e.g., (Fair et al., 2008; Fair et al., in press; Fair et al., 2007)).
While we aligned the right hemisphere to the best of our ability to allow for direct comparisons, we were not successful in doing the same for all patients for the affected, left hemisphere. For future analyses involving the affected hemispheres, proper alignment will be important to allow for direct comparisons. New registration approaches will likely be required (Cohen et al., 2008; Gholipour, Kehtarnavaz, Briggs, Devous, & Gopinath, 2007; Van Essen, 2005).
While our results did not support a common ‘flipped’ contralesional functional organization specific to trial-related activity in our patients, this lack of support may be criticized as a “negative finding” potentially resulting from relatively low sample size with mixed lesion types (cortical versus subcortical) and locations. In addition, while our single subject results were most consistent with the idea that functional organization after left hemispheric damage is variable and largely depends on the location, size, and timing of the stroke, our analysis was not a direct test of this hypothesis.
Testing these hypotheses will likely require very large patient samples, where patient groups can be assembled who have identical or near identical lesions and who are scanned at approximately the same age. Of course perinatal strokes are relatively infrequent (approximately 1 in every 5000 births (Lee et al., 2005)) and show considerable variability in lesion etiology, onset, size, and location, which is the primary factor that makes it difficult to obtain large homogeneous patient samples that provide adequate power suitable for study. In addition, mixed blocked/event-related designs, which would allow investigators to differentiate sustained and trial-related activity, also require large sample sizes. Thus, what may be required to properly pursue a better understanding of the underlying functional neuranatomy following perinatal stroke is a large collaboration between institutions that allows for the acquisition of large normative datasets as well as large patient datasets to improve the quality of investigations.
Supplementary Material
The conjunction image revealed very little overlap across patients with regard to significant differences. No voxel showed overlap for more than 3 subjects in activated regions that differed significantly from their respective cohorts.
Z-scores for each region from the single subject/cohort analysis were summed and divided by the square-root of the number of patients to create a fixed-effects |z|. As with the conjunction image in SI Figure 4, there was very little consistence across subjects with regard to single subject differences to their respective cohort. Only 3 regions had a fixed effects |z| > 2 (also see SI Table 3)
Acknowledgments
We would like to thank Mark McAvoy and Abraham Z. Snyder for their assistance with data analysis. This work was supported by NIH grants NS053425 (BLS), NS41255 and NS46424 (SEP), the John Merck Scholars Fund, the Burroughs-Wellcome Fund, the Dana Foundation, and the Ogle Family Fund (BLS), the Washington University Chancellor's Graduate Fellowship and UNCF/Merck Graduate and Postgraduate Science Research Fellowship (DAF).
Footnotes
Publisher's Disclaimer: This is a PDF file of an unedited manuscript that has been accepted for publication. As a service to our customers we are providing this early version of the manuscript. The manuscript will undergo copyediting, typesetting, and review of the resulting proof before it is published in its final citable form. Please note that during the production process errors may be discovered which could affect the content, and all legal disclaimers that apply to the journal pertain.
References
- Bates E. Plasticity, localization, and language development. In: Broman SH, Fletcher JM, editors. The Changing Nervous System. New York: Oxford University Press; 1999. pp. 214–253. [Google Scholar]
- Bates E, Reilly J, Wulfeck B, Dronkers N, Opie M, Fenson J, et al. Differential effects of unilateral lesions on language production in children and adults. Brain Lang. 2001;79(2):223–265. doi: 10.1006/brln.2001.2482. [DOI] [PubMed] [Google Scholar]
- Bitan T, Burman DD, Lu D, Cone NE, Gitelman DR, Mesulam MM, et al. Weaker top-down modulation from the left inferior frontal gyrus in children. Neuroimage. 2006;33(3):991–998. doi: 10.1016/j.neuroimage.2006.07.007. [DOI] [PMC free article] [PubMed] [Google Scholar]
- Bitan T, Cheon J, Lu D, Burman DD, Booth JR. Developmental increase in top-down and bottom-up processing in a phonological task: an effective connectivity, fMRI study. Journal of Cognitive Neuroscience. 2009 doi: 10.1162/jocn.2009.21065. in press. [DOI] [PMC free article] [PubMed] [Google Scholar]
- Booth JR, Macwhinney B, Thulborn KR, Sacco K, Voyvodic J, Feldman HM. Functional organization of activation patterns in children: whole brain fMRI imaging during three different cognitive tasks. Prog Neuropsychopharmacol Biol Psychiatry. 1999;23(4):669–682. doi: 10.1016/s0278-5846(99)00025-1. [DOI] [PMC free article] [PubMed] [Google Scholar]
- Brown TT, Lugar HM, Coalson RS, Miezin FM, Petersen SE, Schlaggar BL. Developmental changes in human cerebral functional organization for word generation. Cerebral Cortex. 2005;15:275–290. doi: 10.1093/cercor/bhh129. [DOI] [PubMed] [Google Scholar]
- Buckner RL, Bandettini PA, O'Craven KM, Savoy RL, Petersen SE, Raichle ME, et al. Detection of cortical activation during averaged single trials of a cognitive task using functional magnetic resonance imaging. Proceedings of the National Academy of Science. 1996;93:14878–14883. doi: 10.1073/pnas.93.25.14878. [DOI] [PMC free article] [PubMed] [Google Scholar]
- Buckner RL, Bandettini PA, O'Craven KM, Savoy RL, Petersen SE, Raichle ME, et al. Detection of transient and distributed cortical activation during single trials of a cognitive task using fMRI. Proceedings of the National Academy of Sciences. 1997 doi: 10.1073/pnas.93.25.14878. in press. [DOI] [PMC free article] [PubMed] [Google Scholar]
- Buckner RL, Braver TS. Event Related Functional MRI. In: Moonen CTW, Bandettini P, editors. Functional MRI. Mauer, Germany: Springer-Verlag; 1999. pp. 441–450. [Google Scholar]
- Burgund ED, Kang HC, Kelly JE, Buckner RL, Snyder AZ, Petersen SE, et al. The feasibility of a common stereotactic space for children and adults in fMRI studies of development. Neuroimage. 2002;17(1):184–200. doi: 10.1006/nimg.2002.1174. [DOI] [PubMed] [Google Scholar]
- Bushnell MC, Goldberg ME, Robinson DL. Behavioral enhancement of visual responses in monkey cerebral cortex. I. Modulation in posterior parietal cortex related to selective attention. Journal of Neurophysiology. 1981;46:755–772. doi: 10.1152/jn.1981.46.4.755. [DOI] [PubMed] [Google Scholar]
- Casey BJ, Galvan A, Hare TA. Changes in cerebral functional organization during cognitive development. Curr Opin Neurobiol. 2005;15(2):239–244. doi: 10.1016/j.conb.2005.03.012. [DOI] [PubMed] [Google Scholar]
- Church JA, Coalson RS, Lugar HM, Petersen SE, Schlaggar BL. A developmental fMRI study of reading and repetition reveals changes in phonological and visual mechanisms over age. Cerebral Cortex. 2008;18:2054–2065. doi: 10.1093/cercor/bhm228. [DOI] [PMC free article] [PubMed] [Google Scholar]
- Cohen AL, Fair DA, Dosenbach NU, Miezin FM, Dierker D, Van Essen DC, et al. Defining functional areas in individual human brains using resting functional connectivity MRI. NeuroImage. 2008;41:45–57. doi: 10.1016/j.neuroimage.2008.01.066. [DOI] [PMC free article] [PubMed] [Google Scholar]
- Connor LT, Braby TD, Snyder AZ, Lewis C, Blasi V, Corbetta M. Cerebellar activity switches hemispheres with cerebral recovery in aphasia. Neuropsychologia. 2005 doi: 10.1016/j.neuropsychologia.2005.05.019. [DOI] [PubMed] [Google Scholar]
- Cotard J. Etude sur l'atrophie cerebrale. These de Paris 1868 [Google Scholar]
- Dale AM, Buckner RL. Selective averaging of rapidly presented individual trials using fMRI. Human Brain Mapping. 1997;5:329–340. doi: 10.1002/(SICI)1097-0193(1997)5:5<329::AID-HBM1>3.0.CO;2-5. [DOI] [PubMed] [Google Scholar]
- Donaldson DI. Parsing brain activity with fMRI and mixed designs: what kind of a state is neuroimaging in? Trends Neurosci. 2004;27(8):442–444. doi: 10.1016/j.tins.2004.06.001. [DOI] [PubMed] [Google Scholar]
- Donaldson DI, Buckner RL. Effective paradigm design. In: Jezzard P, Matthews PM, Smith SM, editors. Functional magnetic resonance imaging: An introduction to methods. Oxford: Oxford University Press; 2001. pp. 177–196. [Google Scholar]
- Donaldson DI, Petersen SE, Ollinger JM, Buckner RL. Dissociating state and item components of recognition memory using fMRI. Neuroimage. 2001;13:129–142. doi: 10.1006/nimg.2000.0664. [DOI] [PubMed] [Google Scholar]
- Dosenbach NU, Fair DA, Cohen AL, Schlaggar BL, Petersen SE. A dual-networks architecture of top-down control. TICS. 2008 doi: 10.1016/j.tics.2008.01.001. [DOI] [PMC free article] [PubMed] [Google Scholar]
- Dosenbach NU, Visscher KM, Palmer ED, Miezin FM, Wenger KK, Kang HC, et al. A core system for the implementation of task sets. Neuron. 2006;50(5):799–812. doi: 10.1016/j.neuron.2006.04.031. [DOI] [PMC free article] [PubMed] [Google Scholar]
- Fair DA, Brown TT, Petersen SE, Schlaggar BL. fMRI reveals novel functional neuroanatomy in a child with perinatal stroke. Neurology. 2006;67:2246–2249. doi: 10.1212/01.wnl.0000249348.84045.0e. [DOI] [PubMed] [Google Scholar]
- Fair DA, Cohen AL, Dosenbach NU, Church JA, Miezin FM, Barch DM, et al. The maturing architecture of the brain's default network. PNAS. 2008;105(10):4028–4032. doi: 10.1073/pnas.0800376105. [DOI] [PMC free article] [PubMed] [Google Scholar]
- Fair DA, Cohen AL, Power JD, Dosenbach NUF, Church JA, Miezin FM, et al. Functional brain networks develop from a “local to distributed” organization. PLoS Computational Biology. doi: 10.1371/journal.pcbi.1000381. in press. [DOI] [PMC free article] [PubMed] [Google Scholar]
- Fair DA, Dosenbach NUF, Church JA, Cohen AL, Brahmbhatt S, Miezin FM, et al. Development of distinct control networks through segregation and integration. Proc Natl Acad Sci U S A. 2007;104(33):13507–13512. doi: 10.1073/pnas.0705843104. [DOI] [PMC free article] [PubMed] [Google Scholar]
- Forman SD, Cohen JD, Fitzgerald M, Eddy WF, Mintun MA, Noll DC. Improved assessment of significant activation in functional magnetic resonance imaging (fMRI): Use of a cluster-size threshold. Magnetic Resonance in Medicine. 1995;33:636–647. doi: 10.1002/mrm.1910330508. [DOI] [PubMed] [Google Scholar]
- Freud S. Infantile Cerebral Paralysis. Coral Gables: University of Miami Press; 1968. [Google Scholar]
- Gaillard WD, Grandin CB, Xu B. Developmental Aspects of Pediatric fMRI: Considerations for Image Acquisition, Analysis, and Interpretation. Neuroimage. 2001;13(2):239–249. doi: 10.1006/nimg.2000.0681. [DOI] [PubMed] [Google Scholar]
- Gaillard WD, Hertz-Pannier L, Mott SH, Barnett AS, LeBihan D, Theodore WH. Functional anatomy of cognitive development: fMRI of verbal fluency in children and adults. Neurology. 2000;54:180–185. doi: 10.1212/wnl.54.1.180. [DOI] [PubMed] [Google Scholar]
- Gaillard WD, Sachs BC, Whitnah JR, Ahmad Z, Balsamo LM, Petrella JR, et al. Developmental aspects of language processing: fMRI of verbal fluency in children and adults. Hum Brain Mapp. 2003;18(3):176–185. doi: 10.1002/hbm.10091. [DOI] [PMC free article] [PubMed] [Google Scholar]
- Gholipour A, Kehtarnavaz N, Briggs R, Devous M, Gopinath K. Brain functional localization: a survey of image registration techniques. IEEE Trans Med Imaging. 2007;26(4):427–451. doi: 10.1109/TMI.2007.892508. [DOI] [PubMed] [Google Scholar]
- Goldman PS. Functional development of the prefrontal cortex in early life and the problem of neuronal plasticity. Exp Neurol. 1971;32(3):366–387. doi: 10.1016/0014-4886(71)90005-7. [DOI] [PubMed] [Google Scholar]
- Guzzetta A, Pecini C, Biagi L, Tosetti M, Brizzolara D, Chilosi A, et al. Language organisation in left perinatal stroke. Neuropediatrics. 2008;39(3):157–163. doi: 10.1055/s-0028-1085465. [DOI] [PubMed] [Google Scholar]
- Hecaen H. Acquired aphasia in children and the ontogenesis of hemispheric functional specialization. Brain and Language. 1976;3(1):114–134. doi: 10.1016/0093-934x(76)90009-2. [DOI] [PubMed] [Google Scholar]
- Hertz-Pannier L, Gaillard W, Mott SH, Cuenod DA, Bookheimer Sy, Weinstein D, et al. Noninvasive assessment of language dominance in children and adolescents with functional MRI: a preliminary study. Neurology. 1997;48:1003–1012. doi: 10.1212/wnl.48.4.1003. [DOI] [PubMed] [Google Scholar]
- Hillyard SA, Hink RF, Schwent VL, Picton TW. Electrical signs of selective attention in the human brain. Science. 1973;182(4108):177–179. doi: 10.1126/science.182.4108.177. [DOI] [PubMed] [Google Scholar]
- Holland SK, Plante E, Weber Byars A, Strawsburg RH, Schmithorst VJ, Ball WS., Jr Normal fMRI brain activation patterns in children performing a verb generation task. Neuroimage. 2001;14(4):837–843. doi: 10.1006/nimg.2001.0875. [DOI] [PubMed] [Google Scholar]
- January D, Trueswell JC, Thompson-Schill SL. Co-localization of Stroop and Syntactic Ambiguity Resolution in Broca's Area: Implications for the Neural Basis of Sentence Processing. J Cogn Neurosci. 2008 doi: 10.1162/jocn.2008.21179. [DOI] [PMC free article] [PubMed] [Google Scholar]
- Johnson MH. Functional brain development in humans. Nat Rev Neurosci. 2001;2(7):475–483. doi: 10.1038/35081509. [DOI] [PubMed] [Google Scholar]
- Kang HC, Burgund ED, Lugar HM, Petersen SE, Schlaggar BL. Comparison of functional activation foci in children and adults using a common stereotactic space. Neuroimage. 2003;19(1):16–28. doi: 10.1016/s1053-8119(03)00038-7. [DOI] [PubMed] [Google Scholar]
- Kirton A, Deveber G, Pontigon AM, Macgregor D, Shroff M. Presumed perinatal ischemic stroke: vascular classification predicts outcomes. Ann Neurol. 2008;63(4):436–443. doi: 10.1002/ana.21334. [DOI] [PubMed] [Google Scholar]
- Kolb B, Wishaw IQ. Reorganization of function after cortical lesions in rodents. In: Levin HS, Grafman J, editors. Cerebral reorganization of function after brain damage. New York: Oxford University Press; 2000. pp. 109–129. [Google Scholar]
- Lee J, Croen LA, Backstrand KH, Yoshida CK, Henning LH, Lindan C, et al. Maternal and infant characteristics associated with perinatal arterial stroke in the infant. Jama. 2005;293(6):723–729. doi: 10.1001/jama.293.6.723. [DOI] [PubMed] [Google Scholar]
- Liegeois F, Connelly A, Baldeweg T, Vargha-Khadem F. Speaking with a single cerebral hemisphere: fMRI language organization after hemispherectomy in childhood. Brain Lang. 2008;106(3):195–203. doi: 10.1016/j.bandl.2008.01.010. [DOI] [PubMed] [Google Scholar]
- Liegeois F, Connelly A, Cross JH, Boyd SG, Gadian DG, Vargha-Khadem F, et al. Language reorganization in children with early-onset lesions of the left hemisphere: an fMRI study. Brain. 2004;127(Pt 6):1229–1236. doi: 10.1093/brain/awh159. [DOI] [PubMed] [Google Scholar]
- Miezin FM, Maccotta L, Ollinger JM, Petersen SE, Buckner RL. Characterizing the hemodynamic response: Effects of presentation rate, sampling procedure, and the possibility of ordering brain activity based on relative timing. NeuroImage. 2000;11:735–759. doi: 10.1006/nimg.2000.0568. [DOI] [PubMed] [Google Scholar]
- Moses P, Stiles J. The lesion methodology: contrasting views from adult and child studies. Dev Psychobiol. 2002;40(3):266–277. doi: 10.1002/dev.10031. [DOI] [PubMed] [Google Scholar]
- Muller RA, Behen ME, Rothermel RD, Muzik O, Chakraborty PK, Chugani HT. Brain organization for language in children, adolescents, and adults with left hemisphere lesion: a PET study. Prog Neuropsychopharmacol Biol Psychiatry. 1999;23(4):657–668. doi: 10.1016/s0278-5846(99)00024-x. [DOI] [PubMed] [Google Scholar]
- Muller RA, Rothermel RD, Behen ME, Muzik O, Chakraborty PK, Chugani HT. Language organization in patients with early and late left-hemisphere lesion: a PET study. Neuropsychologia. 1999;37(5):545–557. doi: 10.1016/s0028-3932(98)00109-2. [DOI] [PubMed] [Google Scholar]
- Muller RA, Rothermel RD, Behen ME, Muzik O, Mangner TJ, Chakraborty PK, et al. Brain organization of language after early unilateral lesion: A PET study. Brain and Language. 1998;62(3):422–451. doi: 10.1006/brln.1997.1931. [DOI] [PubMed] [Google Scholar]
- Muller RA, Rothermel RD, Behen ME, Muzik O, Mangner TJ, Chugani H. Differential patterns of language and motor reorganizaiton following early left hemisphere lesion: A PET study. Archives of Neurology. 1998;55:1113–1119. doi: 10.1001/archneur.55.8.1113. [DOI] [PubMed] [Google Scholar]
- Murphy K, Garavan H. Artifactual fMRI group and condition differences driven by performance confounds. Neuroimage. 2004;21(1):219–228. doi: 10.1016/j.neuroimage.2003.09.016. [DOI] [PubMed] [Google Scholar]
- Muzik O, Chugani DC, Juhasz C, Shen C, Chugani HT. Statistical parametric mapping: assessment of application in children. Neuroimage. 2000;12(5):538–549. doi: 10.1006/nimg.2000.0651. [DOI] [PubMed] [Google Scholar]
- Palmer ED, Brown TT, Petersen SE, Schlaggar BL. Investigation of the functional neuroanatomy of single word reading and its development. Scientific Studies of Reading. 2004;8(3):203–223. [Google Scholar]
- Papanicolaou AC, DiScenna A, Gillespie L, Aram D. Probe-evoked potential findings following unilateral left-hemisphere lesions in children. Arch Neurol. 1990;47(5):562–566. doi: 10.1001/archneur.1990.00530050086016. [DOI] [PubMed] [Google Scholar]
- Rasmussen T, Milner B. The role of early left-brain injury in determining lateralization of cerebral speech functions. Ann N Y Acad Sci. 1977;299:355–369. doi: 10.1111/j.1749-6632.1977.tb41921.x. [DOI] [PubMed] [Google Scholar]
- Schiller F. Paul Broca: Founder of French anthropology, explorer of the brain. Berkeley: University of California Press; 1979. [Google Scholar]
- Schlaggar BL, Brown TT, Lugar HM, Visscher KM, Miezin FM, Petersen SE. Functional neuroanatomical differences between adults and school-age children in the processing of single words. Science. 2002;296:1476–1479. doi: 10.1126/science.1069464. [DOI] [PubMed] [Google Scholar]
- Staudt M, Grodd W, Gerloff C, Erb M, Stitz J, Krageloh-Mann I. Two types of ipsilateral reorganization in congenital hemiparesis: a TMS and fMRI study. Brain. 2002;125(Pt 10):2222–2237. doi: 10.1093/brain/awf227. [DOI] [PubMed] [Google Scholar]
- Staudt M, Grodd W, Niemann G, Wildgruber D, Erb M, Krageloh-Mann I. Early left periventricular brain lesions induce right hemispheric organization of speech. Neurology. 2001;57(1):122–125. doi: 10.1212/wnl.57.1.122. [DOI] [PubMed] [Google Scholar]
- Strauss E, Verity C. Effect of hemispherectomy in infantile hemiplegics. Brain and Language. 1983;20(1):1–11. doi: 10.1016/0093-934x(83)90027-5. [DOI] [PubMed] [Google Scholar]
- Szaflarski JP, Holland SK, Schmithorst VJ, Byars AW. fMRI study of language lateralization in children and adults. Human Brain Mapping. 2006;27(3):202–212. doi: 10.1002/hbm.20177. [DOI] [PMC free article] [PubMed] [Google Scholar]
- Talairach J, Tournoux P. In: Co-Planar Stereotaxic Atlas of the Human Brain. Rayport M, translator. New York: Thieme Medical Publishers, Inc.; 1988. [Google Scholar]
- Tillema JM, Byars AW, Jacola LM, Schapiro MB, Schmithorst VJ, Szaflarski JP, et al. Reprint of “Cortical reorganization of language functioning following perinatal left MCA stroke” [Brain and Language 105 (2008) 99-111] Brain Lang. 2008;106(3):184–194. doi: 10.1016/j.bandl.2008.08.001. [DOI] [PubMed] [Google Scholar]
- Turkeltaub PE, Flowers DL, Verbalis A, Miranda M, Gareau L, Eden GF. The neural basis of hyperlexic reading: an FMRI case study. Neuron. 2004;41(1):11–25. doi: 10.1016/s0896-6273(03)00803-1. [DOI] [PubMed] [Google Scholar]
- Van Essen DC. A Population-Average, Landmark- and Surface-based (PALS) Atlas of Human Cerebral Cortex. Neuroimage. 2005;28(3):635–662. doi: 10.1016/j.neuroimage.2005.06.058. [DOI] [PubMed] [Google Scholar]
- Vargha-Khadem F, O'Gorman AM, Watters GV. Aphasia and handedness in relation to hemispheric side, age at injury and severity of cerebral lesion during childhood. Brain. 1985;108(3):677–696. doi: 10.1093/brain/108.3.677. [DOI] [PubMed] [Google Scholar]
- Vargha-Khadem F, Polkey CE. A review of cognitive outcome after hemidecortication in humans. Adv Exp Med Biol. 1992;325:137–151. doi: 10.1007/978-1-4615-3420-4_8. [DOI] [PubMed] [Google Scholar]
- Visscher KM, Miezin FM, Kelly JE, Buckner RL, Donaldson DI, McAvoy MP, et al. Mixed blocked/event-related designs separate transient and sustained activity in fMRI. NeuroImage. 2003;19(4):1694–1708. doi: 10.1016/s1053-8119(03)00178-2. [DOI] [PubMed] [Google Scholar]
- Webster MJ, Bachevalier J, Ungerleider LG. Transient subcortical connections of inferior temporal areas TE and TEO in infant macaque monkeys. J Comp Neurol. 1995;352(2):213–226. doi: 10.1002/cne.903520205. [DOI] [PubMed] [Google Scholar]
- Webster MJ, Ungerleider LG, Bachevalier J. Development and plasticity of the neural circuitry underlying visual recognition memory. Can J Physiol Pharmacol. 1995;73(9):1364–1371. doi: 10.1139/y95-191. [DOI] [PubMed] [Google Scholar]
- Wechsler D. Wechsler abbreviated scale of intelligence. Third. San Antonio: The Psychological Corporation; 1999. [Google Scholar]
- Wenger KK, Visscher KM, Miezin FM, Petersen SE, Schlaggar BL. Comparison of sustained and transient activity in children and adults using a mixed blocked/event-related fMRI design. NeuroImage. 2004;22:975–985. doi: 10.1016/j.neuroimage.2004.02.028. [DOI] [PubMed] [Google Scholar]
- Wilke M, Lidzba K, Staudt M, Buchenau K, Grodd W, Krageloh-Mann I. Comprehensive language mapping in children, using functional magnetic resonance imaging: what's missing counts. Neuroreport. 2005;16(9):915–919. doi: 10.1097/00001756-200506210-00008. [DOI] [PubMed] [Google Scholar]
Associated Data
This section collects any data citations, data availability statements, or supplementary materials included in this article.
Supplementary Materials
The conjunction image revealed very little overlap across patients with regard to significant differences. No voxel showed overlap for more than 3 subjects in activated regions that differed significantly from their respective cohorts.
Z-scores for each region from the single subject/cohort analysis were summed and divided by the square-root of the number of patients to create a fixed-effects |z|. As with the conjunction image in SI Figure 4, there was very little consistence across subjects with regard to single subject differences to their respective cohort. Only 3 regions had a fixed effects |z| > 2 (also see SI Table 3)