Abstract
Purpose
We report a noninvasive method for the monitoring of retinal ganglion cell (RGC) survival in live mice utilizing standard fluorescence microscopy.
Procedures
Transgenic mice expressing cyan fluorescent protein (CFP) under the regulation of an RGC-specific promoter Thy1 were used in this study.
Results
We established that Thy1-CFP expression is a quantitative reflection of the number of surviving RGCs, the fluorescence emission is stable for at least a year and that the loss of fluorescence correlates directly to glaucomatous damage. In high pressure glaucoma model, the peripheral retina is preferentially affected.
Conclusions
Our live-imaging technique allows for the longitudinal assessment of RGC survival from the same animal. Noninvasive monitoring of neuronal cell death and survival is a powerful technique that would allow investigators to validate new potential glaucoma therapy based on neuroprotection.
Keywords: Retina, Ganglion cells, Glaucoma, Optic neuropathy, Imaging, AMPA, alpha-amino-3-hydroxy-5-methyl-4-isoxazole propionic acid, KA, kainic acid, NMDA, N-methyl-d-aspartic acid, RGC, retinal ganglion cell, THY1, Thy-1 cell surface antigen
Introduction
Glaucoma is a leading cause of blindness that disproportionally affects women, blacks and Asians [1, 2], and the annual worldwide incidence is estimated to be about 70 million. The lack of symptoms in many advanced glaucoma patients results in poor treatment outcomes. Although glaucoma represents the second most prevalent cause of irreversible blindness worldwide, its pathogenesis remains unclear. Retinal ganglion cell (RGC) death is the primary cause of vision loss in glaucoma [3, 4]. The ability to live-image RGCs, specifically in animal models, is of significant importance to the development of new glaucoma therapies, such as those based on neuroprotection.
Current method to quantify RGCs involves retrograde labeling followed by histological analyses of fixed tissue. This procedure is laborious, and the need to sacrifice animals at every time point constraints longer studies or more frequent assessments. An alternative protocol that uses confocal scanning laser ophthalmoscope (cSLO) for the live-imaging of RGCs has been recently developed [5–8]. cSLO was initially applied to the imaging of human retinal neurons, and several investigators soon adapted cSLO to animal research [5, 9–11]. For instance, cSLO was used successfully to detect apoptotic RGCs labeled with fluorescent annexin V in rat and primates [6], and individual RGCs were imaged from live rats [8] and monkeys [7] after retrograde labeling with a fluorescent dye, and even in some mice with fluorescence protein labeled RGCs [9–11].
In this report, we demonstrate that fluorescence microscopy (with CFP optical filter) could be performed in conjunction with fundus imaging to visualize RGCs from live Tg(Thy1-CFP)I mice [12, 13]. This expedient approach minimizes the need to sacrifice experimental animals. The ability to perform longitudinal RGC assessment should greatly facilitate validation of new therapies for glaucoma mouse models, such as those induced by elevated intraocular pressure (IOP) or N-methyl-d-aspartate (NMDA), and kainic acid (KA) excitotoxins.
Materials and Methods
In Vivo Fluorescence Microscopy and Live Imaging
In vivo microscopy and digital imaging were performed as described previously [14], using an M2Bio fluorescence stereo microscope Stemi SV1 (Carl Zeiss, Oberkochen, Germany). Only one of the binocular tubes was used for fluorescence digital imaging, and the stereo feature was not used.
For in vivo observation, mice were anesthetized with 3% isoflurane in oxygen. The eye was lightly proptosed and Viscotears (Novartis, Basel, Switzerland) was applied to the cornea after which a circular 7.5 mm sapphire window (Edmund Optics, Barrington, NJ) was placed over the cornea. CFP positive RGCs were imaged with a CFP optical filter (Chroma Technology, Rockingham, VT) and a ×1.6 objective with zoom at ×2 or ×4, and recorded with a digital camera (Coolsnap ES, Roper, Texas). Image resolution was approximately 1.0 and 2.0 μm/pixel with the ×4 and ×2 zoom, respectively. Fluorescent images were acquired under identical conditions such that the image brightness does not change between images captured at different times. The intensity of the excitation light at 430 nm was monitored with a power meter (Optical Power Meter Model 840, Newport Corp., Irvine, CA) to ensure reproducibility.
Experimental Animals
All mice were housed with standard nutrition and water provided ad libitum and maintained in temperature-controlled rooms with a 12-h light and 12-h dark cycle. All animal studies were conducted in accordance with the ARVO Statement for Use of Animals in Ophthalmic and Vision Research, and procedures were approved by the Institutional Animal Care and Use Committee of Columbia University. The Tg(Thy1-CFP)I mice [13] were a gift of Dr. Guoping Feng (Duke University) and maintained in a C57/Bl6 background. CFP line I, which showed RGC-specific CFP expression were selected for further studies [13].
Comparing Fluorescence Expression from CFP and Immunohistochemistry with Anti-THY-1
Eyes were isolated after sacrificing the animal with intraperitoneal (IP) pentobarbital (100 mg/kg). Whole mounts of the posterior cup were prepared after fixing the whole eye in 4% formaldehyde in phosphate buffered saline (PBS). CFP expression patterns were visualized with a fluorescence microscope (Axioskop2, Carl Zeiss, Germany), and recorded digitally. Immunohistochemistry for THY1 was performed with whole mounts with rat antibody to THY1.2 (Pharmingen, San Diego, CA) and donkey anti-rat IgG conjugated with Texas Red (Jackson ImmunoResearch Laboratories, West Grove, PA). For comparison, images were obtained from fluorescence microscopy of CFP-labeled RGCs and anti-THY1.2 antibody-labeled RGC.
Induction of High IOP
Thirty-five adult Tg(Thy1-CFP)I mice, in which the Thy1 promoter drives expression of CFP, were used in the study of retinal ischemia–reperfusion injury. The mice weighed between 27–36 g and were approximately 8 weeks old. Before ischemia was induced, animals were anaesthetized with IP ketamine (100 mg/ml) and xylazine (20 mg/ml). Body temperature was maintained at 37°C using a heating pad throughout the experiment.
Corneal analgesia was achieved using topical drops of 0.5% proparacaine hydrochloride. The pupils were dilated with topical 2.5% phenylephrine hydrochloride and 1% tropicamide. After topical instillation of 0.5% proparacaine hydrochloride, the anterior chamber of the right eye was cannulated with a 27-gauge infusion needle connected to a 500 ml plastic container containing sterile 0.9% NaCl. The intraocular pressure in the experimental eyes was maintained at a pressure of 120 mmHg for 60 min by adjusting the elevation of the saline bag. Retinal ischemia was confirmed by the blanching of the iris and retinal circulation. Sham procedure was performed without the elevation of the saline bag in control mice.
Intraocular pressure was measured with a handheld tonometer (Tonopen XL, Mentor, Norwell, MA, USA) that was calibrated prior to performing the procedure [15]. The Tonopen was held perpendicular to, and applied toward the center of the cornea. All readings obtained after contact with the cornea were used to calculate the mean values for each eye. Intraocular pressure recordings were obtained from both the experimental eye and the control eye, preoperatively, postoperatively, and during the procedure.
Whole-Mount Retina and RGCs Cell Counting
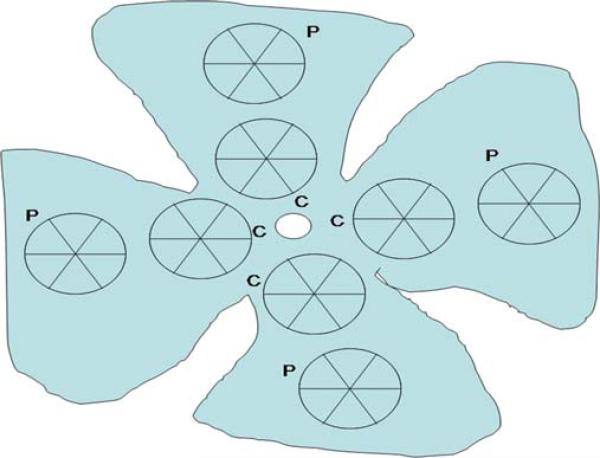
Elevated IOP-induced ischemia for 60 min was followed by 1, 6, 24, 48 h, and 7 days (168 h) reperfusion period. After the reperfusion, the eyes (n=5 mice per group) were enucleated and placed in 4% paraformaldehyde for 24 h. The cornea and lens were removed from each eye. The retinas were dissected under a surgical microscope. The retinas were flattened by means of four radial cuts and mounted using PBS with 50% v/v glycerol. Visualization was achieved by fluorescence microscopy (×20 magnification). Images of the fluorescent RGCs, in all specimens, were generated using the same microscope setting. The number of RGCs were counted manually in eight areas (two per quadrant), and the mean value from three counts was calculated (Fig. 1). RGCs along the image border were not counted. The measured regions were located in two zones: central zone (C), at a radial distance of 500 μm from the optic nerve head; and peripheral zone (P), at more than 900 μm from the optic nerve head. Each of the fields measured 0.125 mm2 (×20 objective) and the total sampling area was 1.005 mm2 for each retina. The data was expressed as means ± S.E.M. per area, and was evaluated for differences using the Student's t test.
Fig. 1.
RGCs counting method. The number of RGCs were counted manually in eight areas (two per quadrant), with three counts performed. The measured regions were located in two zones: central zone (C), at a radial distance of 500 μm from the optic nerve head; and peripheral zone (P), at more than 900 μm from the optic nerve head. Each of the fields measured 0.125 mm2 (×20 objective) so that the total counted area was 1.005 mm2 for each retina.
Animal Models of NMDA- and KA-Induced Neuronal Death
NMDA, alpha-amino-3-hydroxy-5-methyl-4-isoxazole propionic acid (AMPA; 20 nmol in PBS), KA (47 nmole in PBS), memantine, and MK-801 were purchased from Sigma-Aldrich (St. Louis, MO). Eight-week-old Tg(Thy1-CFP)I mice were anesthetized by IP injection of ketamine (100 mg/kg) and xylazine (10 mg/kg) for general anesthesia and a topical tetracaine drop. Under a dissecting microscope, the glass pipette was passed through the sclera just behind the limbus into the vitreous cavity. All intravitreal injections (IVIs) were performed in a final volume of 2 μL. To evaluate the effect of excitotoxicity from NMDA on survival of RGCs, we co-injected memantine with NMDA (40 nmole in PBS) intravitreously at 160 nmol per injection or injected MK-801 intraperitoneally (1 mg/kg in PBS) 1 h prior to intravitreal injection of NMDA or KA. The contralateral control eye was injected with PBS.
Results
Visualization of Thy-1 CFP Expressing RGCs
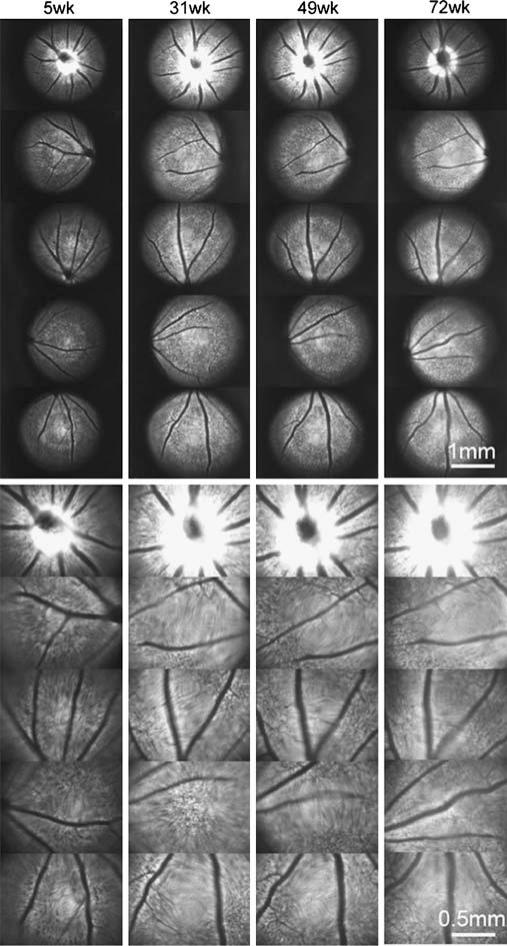
The expression of CFP in RGCs is detectable at 5 weeks and was observed for at least 72 weeks (Fig. 2). Imaging from different time points also indicate that CFP expression maintains consistent localization. The intensity of CFP fluorescence was sufficient for RGCs live-imaging.
Fig. 2.
Long-term time-lapse fundus fluorescence imaging with a Thy1::CFP mouse in vivo. Fundus CFP fluorescence is imaged at indicated times, which are the age of the mouse. Some areas in an image are not in focus and appear blurry due to spherical errors and refractive errors in the optics which have not been corrected. This sequence is a representative of four separate mice which all show similar results. Bar, 500 μm.
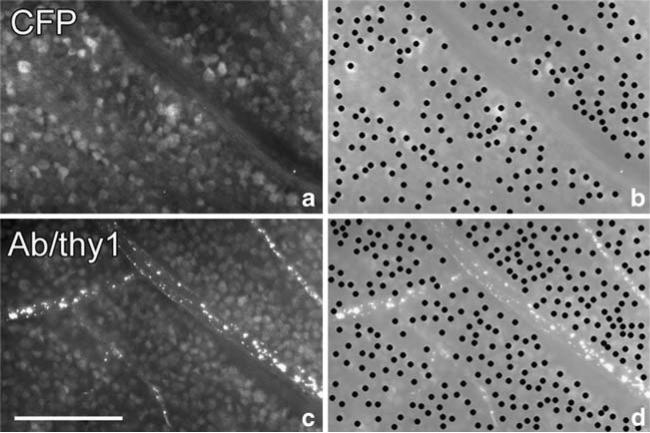
Immunolabeling of whole-mount retina with anti-Thy-1 antibody (Fig. 3c) showed that at least 70% of CFP-positive cells can be labeled with anti-Thy-1 (Fig. 3a).
Fig. 3.
Histology of whole-mount retina from a Thy1::CFP mouse. a Shows CFP fluorescence of a fixed normal retina, and c shows THY1 immunofluorescence in the same area. b and d are duplicates of a and b, except that their contrast has been reduced to highlight individual cell bodies that are plotted manually. The number of CFP positive cell bodies in b is 204; the number of THY1-positive cell bodies in d is 281. Bar, 100 μm.
To examine the possibility of phototoxicity from fundus illumination, the fundus CFP fluorescence of four mice was monitored for over 60 weeks at 4 to 8 weeks intervals (Fig. 2). The number of CFP-positive cells and overall fundus fluorescence during this period remained stable, suggesting that there were no light damage to the RGC layer. Electroretinograms used to monitor retinal function were also normal after 1 year of follow-up (data not shown). CFP-positive RGCs could be monitored for over 1 year without obvious photo-toxicity to the retina.
High Intraocular Pressure Model of Glaucoma
The preoperative IOP mean value was 6 mmHg, and an IOP of 120 mmHg was maintained throughout the procedure. The postoperative IOP mean value was 4 mmHg.
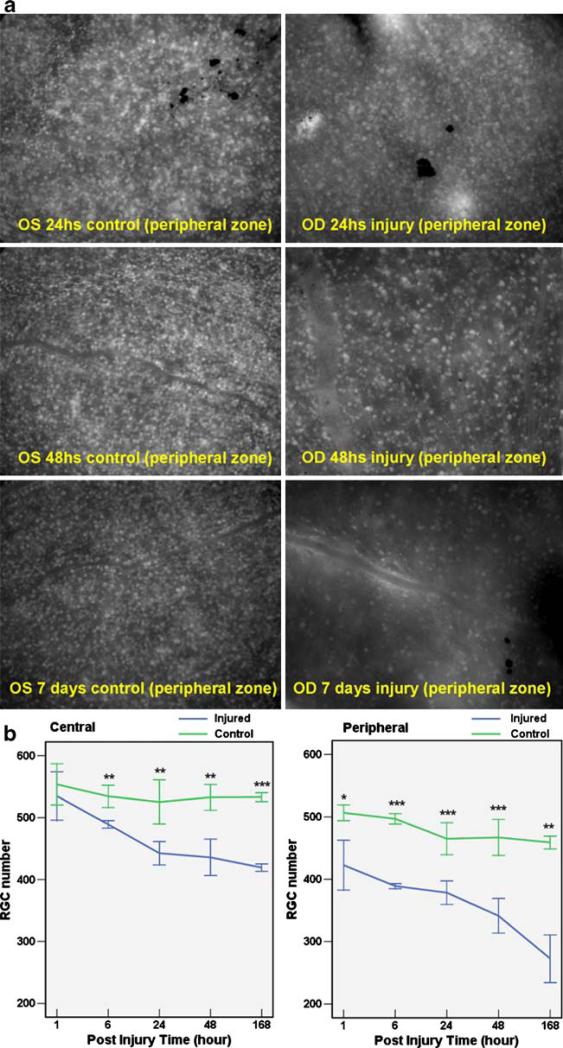
In Fig. 4a, the number of CFP-positive RGCs steadily decreased from 24 h postinjury to 7 days postinjury. There is a statistically significant difference between the number of CFP-positive RGCs of the control eye and experimental eye at three different time points (Table 1). In Fig. 4b, RGC counts are plotted for the control eye and the experimental eye at several time points. The central retina and peripheral retina are presented separately. In the central retina, statistically significant differences between experimental and control eyes were observed 6 h after injury, whereas in the peripheral retina, statistically significant differences began 1 h after injury.
Fig. 4.
RGC loss induced by acute high intraocular pressure (IOP). a Shows the CFP positive RGCs from whole-mount retina. After acute high IOP induction in the right eye, there are significant differences of RGCs from 24 h after injury to 7 days after injury. The control eyes (OS) have more RGCs than injury eyes (OD) at different time points after injury. b Reveals the RGC numbers in central and peripheral retina at 1, 6, 24, 48, and 168 h after injury. *P≤0.05; **P≤0.01; ***P≤0.001.
Table 1.
RGC count status posthigh intraocular pressure induction
| Post injured time | Number of RGC (central retina) |
Number of RGC (peripheral retina) |
||||||
|---|---|---|---|---|---|---|---|---|
| Injured eye | Control eye | Cell loss (%) | P value | Injured eye | Control eye | Cell loss (%) | P value | |
| 1 h | 534.80±17.41 | 553.60±14.85 | –3.44 | 0.357 | 422.60±17.88 | 506.60±5.67 | –16.60 | 0.011 |
| 6 h | 489.20±2.82 | 534.40±7.97 | –8.43 | 0.007 | 389.00±1.87 | 497.00±3.74 | –21.73 | <0.001 |
| 24 h | 442.57±7.15 | 525.29±13.48 | –15.81 | 0.002 | 378.43±7.07 | 464.86±9.68 | –18.53 | <0.001 |
| 48 h | 435.86±11.12 | 532.86±7.85 | –18.23 | 0.001 | 341.14±10.52 | 467.00±10.89 | –26.98 | <0.001 |
| 7 days | 419.40±2.62 | 533.20±3.20 | –21.39 | <0.001 | 272.60±17.12 | 459.00±4.60 | –40.74 | 0.001 |
The number of RGC was counted in six eyes per group. The data were expressed as means ± S.E.M. per area
RGC retina ganglion cell
Animal Models of NMDA- and KA-Induced Neuronal Death
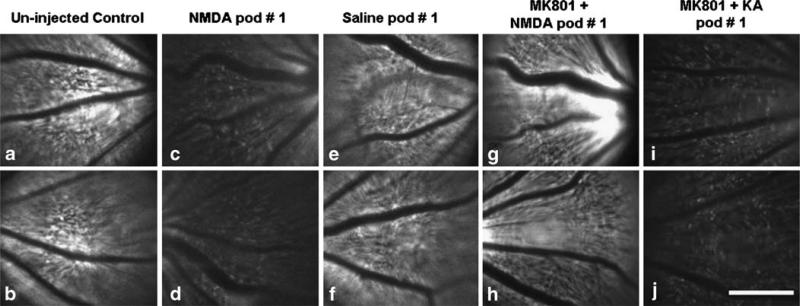
At day 1 after IVI with NMDA, AMPA, and KA, noticeable reduction in the number of CFP-positive RGCs was observed (Fig. 5a–d; data for KA and AMPA are similar to NMDA and are not shown). After NMDA was administered, the RGCs remained visible under live fundus imaging; however, the fluorescence intensity of individual RGCs and the overall fundus reduced significantly. The fundus fluorescence from mice injected with saline IVI (Fig. 5e, f) and NMDA IVI with dizocilpine (MK801) IP (is NMDA injected IVI with MK801 IP?; Fig. 5g, h) were comparable to uninjected eyes (Fig. 5a, b). However, the fundus fluorescence from mice injected with MK-801 IP and KA IVI showed significant reduction in fluorescence (Fig. 5i, j).
Fig. 5.
Effect of excitotoxins on the CFP positive RGCs in vivo. In vivo live fundus fluorescence 5A and 5B: uninjected eyes; 5C and 5D: NMDA, IVI; 5E and 5F: Saline, IVI; 5G and 5H: NMDA, IVI 1 h after MK801, IP; 5I and 5H: KA, IVI 1 h after MK801, IP. The intensity of the fluorescence from live fundus imaging in vivo corresponds to the numbers of CFP positive RGCs. The fundus fluorescence from mice injected with saline IVI (5E and 5F) and NMDA IVI with MK801 IP (5G and 5H) maintains the same intensity as the control uninjected eyes (5A and 5B). The fundus fluorescence from mice injected with MK-801 IP and KA IVI shows significant decrease (5I and 5J). Bar, 500 μm. pod postoperative day.
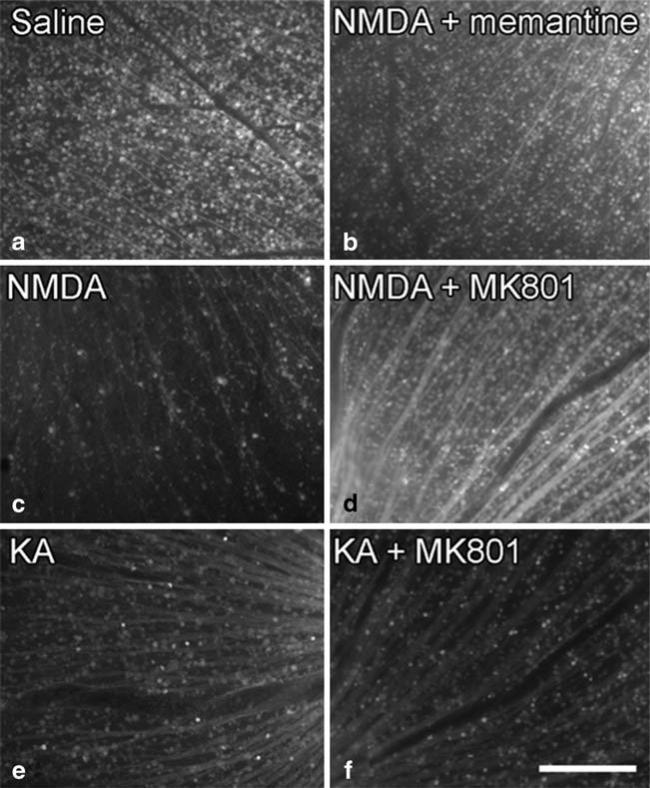
Fluorescence imaging of whole-mount retina showed decreased number of CFP-positive RGCs from eyes injected with NMDA (Fig. 6c), KA (Fig. 6e), and KA+MK801 (Fig. 6f), whereas fluorescence from eyes injected with NMDA+memantine (Fig. 6b), and NMDA+MK801 (Fig. 6d) were comparable to eyes injected with saline (Fig. 6a). The fluorescence of whole-mount retina from fixed specimens (Fig. 6) correlates well with in vivo fundus imaging (Fig. 5).
Fig. 6.
Fundus fluorescence in fixed retinal whole mounts of CFP mouse eyes. Fluorescence of whole-mount retina 6A: Saline, IVI; 6B: NMDA and memantine, IVI; 6C: NMDA, IVI; 6D: NMDA, IVI 1 h after MK801 IP; 6E: KA, IVI; 6F: KA, IVI 1 h after MK801 IP. All eyes are from mice killed 1 day later and fixed for whole-mount histology and fluorescence imaging. Decreased numbers of CFP-positive RGCs are noted from eyes injected with NMDA (6C), KA (6E), and KA+MK801 (6F), whereas fluorescence from eyes injected with NMDA+memantine (6B), and NMDA+MK801 (6D) have intensity comparable to eyes injected with saline (6A). Bar, 200 μm.
Discussion
We described here a simple and cost-efficient method to monitor RGC loss in vivo using standard fluorescence microscopy. In contrast to existing technique where glaucoma progression and RGC loss are ascertained through histological samples obtained from sacrificed animals [16], live imaging permits safe and repeated examinations of the same animal. Previous studies have reported IVI of recombinant adeno-associated viral vector expressing green fluorescence protein [17], IVI of annexin 5 [6], and retrograde labeling with a neuronal tracer [8] to visualize RGCs in vivo.
Recently, the use of fluorescent protein-labeled RGC mice has been reported in vivo time-lapse live imaging with laser scanning confocal microscopy [9–11]. Walsh and Quigley used the B6.Cg-Tg(Thy1-YFPH)2Jrs/J line, and Leung et al. used the B6.Cg-TgN (Thy1-CFP)23Jrs/J line. The fluorescent protein expression driven by the Thy-1 promoter fluorescent proteins in these two transgenic lines can also be detected in amacrine cells [13]. In comparison, our Tg(Thy1-CFP)I reporter is RGC-specific [13] which will be invaluable to glaucoma research as the disease selectively affect RGCs and spares amacrine neurons.
Our data suggests that the overall fundus fluorescence is proportional to the total number of RGCs and the progression of RGC loss in the same animal could be recorded over several time intervals, as shown in Fig. 2.
It should be noted that approximately 30% of THY1 expressing cells lacked recordable CFP fluorescence, and the contribution that these cells have on glaucoma pathogenesis is not clear. However, the presence of these cells does not limit the effectiveness of our technique, as the majority of Thy1::positive RGCs are CFP-positive. Nevertheless, there exists the possibility that our method may underestimate the effect of a toxic reagent that preferentially targets CFP-negative RGCs. The development of additional strains expressing fluorescence in all THY1 positive cells would eliminate this concern.
High IOP-induced ischemia is a commonly accepted animal model for acute angle closure glaucoma, and also for ophthalmic artery and central retinal artery occlusions. In this study, we confirmed that high IOP induces RGC loss in Thy-1 CFP mice, and that the loss of RGCs originates from the peripheral retina in a manner comparable to human glaucoma. The high IOP-induced ischemia model in conjunction with the Thy-1 CFP mice should prove useful in the study of RGC loss after close angle glaucoma.
In the retina, glutamate release has been implicated as a mechanism effecting RGC death in glaucoma [18–22], particularly in secondary RGC degenerations [23–26]. Glutamate mediates excitatory neurotransmission via ion channel-associated receptors such as NMDA (N-methyl-d-aspartic acid) and KA (Kainate) [27, 28]. Several NMDA antagonists including memantine and MK801 can ameliorate ischemia-induced insults to the retina [29–31]. In our study, intravitreal administration of NMDA successfully induced glaucoma in mice [32], and through subsequent live imaging analyses using our novel Tg(Thy1-CFP)I reporter we found that NMDA toxicity was greatly reduced by memantine and MK-801, whereas the KA toxicity was unaffected by the same concentration of MK-801 [33] (Fig. 5 and 6).
Conclusion
Live imaging is indispensable for studying chronic neurodegenerative disorders like glaucoma as the ability to perform long-term serial investigation is needed to document disease progression. As digital fluorescence microscopy is presently available to many research laboratories, our Tg(Thy1-CFP)I reporter assay could be rapidly deployed by glaucoma investigators. Our fluorometric assay is readily adaptable to high-throughput screening (>30 mice/day), and to the screening of reagents that may be toxic or protective to RGCs. Different optical filters could be substituted to allow for the imaging of mice strains utilizing alternative fluorescent reporters [34]. The use of this particular Tg(Thy1-CFP)I mouse model could enable and accelerate discoveries of neuroprotective treatments that are applicable to glaucoma and other ganglion cell diseases.
Acknowledgements
Dr. Guoping Feng of Duke University is acknowledged for the gift of Tg(Thy1-CFP)I mice. We are indebted to members of the Chyuan-Sheng Lin and Takayuki Nagasaki laboratories for sharing ideas and equipment, as well as for critical reading of the manuscript. We are also grateful to members of our laboratories for support—especially Richard Davis. Stephen H. Tsang is a Burroughs-Wellcome Program in Biomedical Sciences fellow, and is also supported by the Charles Culpeper Scholarship, Foundation Fighting Blindness, Hirschl Trust, Schneeweiss Stem Cell Fund, Joel Hoffmann Foundation, Jonas Family Fund, Crowley Research Fund, Jahnigen/Hartford/American Geriatrics Society, Eye Surgery Fund, Bernard Becker-Association of University Professors in Ophthalmology-Research to Prevent Blindness (RPB), and Jules Stein-RPB Omics Laboratory.
Support. Research to Prevent Blindness, Burroughs-Wellcome Program in Biomedical Sciences, the Bernard Becker-Association of University Professors in Ophthalmology-Research to Prevent Blindness Award, Foundation Fighting Blindness, Dennis W. Jahnigen Award of the American Geriatrics Society, Joel Hoffman Fellowship, Gale and Richard Siegel Stem Cell Fund, Charles Culpeper Scholarship, Schneeweiss Stem Cell Fund, Irma T. Hirschl Charitable Trust, Barbara & Donald Jonas Family Fund, Eye Surgery Fund, and Bernard and Anne Spitzer Stem Cell Fund.
Footnotes
Joaquin Tosi and Nan-Kai Wang contributed equally to this work
References
- 1.Quigley HA, Broman AT. The number of people with glaucoma worldwide in 2010 and 2020. Br J Ophthalmol. 2006;90:262–267. doi: 10.1136/bjo.2005.081224. [DOI] [PMC free article] [PubMed] [Google Scholar]
- 2.Friedman DS, Wolfs RC, O'Colmain BJ, et al. Prevalence of open-angle glaucoma among adults in the United States. Arch Ophthalmol. 2004;122:532–538. doi: 10.1001/archopht.122.4.532. [DOI] [PMC free article] [PubMed] [Google Scholar]
- 3.Quigley HA. Neuronal death in glaucoma. Prog Retin Eye Res. 1999;18:39–57. doi: 10.1016/s1350-9462(98)00014-7. [DOI] [PubMed] [Google Scholar]
- 4.Whitmore AV, Libby RT, John SW. Glaucoma: thinking in new ways-a role for autonomous axonal self-destruction and other compartmentalised processes? Prog Retin Eye Res. 2005;24:639–662. doi: 10.1016/j.preteyeres.2005.04.004. [DOI] [PubMed] [Google Scholar]
- 5.Paques M, Simonutti M, Roux MJ, et al. High resolution fundus imaging by confocal scanning laser ophthalmoscopy in the mouse. Vision Res. 2006;46:1336–1345. doi: 10.1016/j.visres.2005.09.037. [DOI] [PubMed] [Google Scholar]
- 6.Cordeiro MF, Guo L, Luong V, et al. Real-time imaging of single nerve cell apoptosis in retinal neurodegeneration. Proc Natl Acad Sci USA. 2004;101:13352–13356. doi: 10.1073/pnas.0405479101. [DOI] [PMC free article] [PubMed] [Google Scholar]
- 7.Gray DC, Merigan W, Wolfing J, et al. In vivo fluorescence imaging of primate retinal ganglion cells and retinal pigment epithelial cells. Opt Express. 2006;14:7144–7158. doi: 10.1364/oe.14.007144. [DOI] [PubMed] [Google Scholar]
- 8.Higashide T, Kawaguchi I, Ohkubo S, Takeda H, Sugiyama K. In vivo imaging and counting of rat retinal ganglion cells using a scanning laser ophthalmoscope. Invest Ophthalmol Vis Sci. 2006;47:2943–2950. doi: 10.1167/iovs.05-0708. [DOI] [PubMed] [Google Scholar]
- 9.Leung CK, Lindsey JD, Crowston JG, et al. In vivo imaging of murine retinal ganglion cells. J Neurosci Methods. 2008;168:475–478. doi: 10.1016/j.jneumeth.2007.10.018. [DOI] [PubMed] [Google Scholar]
- 10.Leung CK, Lindsey JD, Crowston JG, Lijia C, Chiang S, Weinreb RN. Longitudinal Profile of Retinal Ganglion Cell Damage after Optic Nerve Crush with Blue-Light Confocal Scanning Laser Ophthalmoscopy. Invest Ophthalmol Vis Sci. 2008;49:4898–4902. doi: 10.1167/iovs.07-1447. [DOI] [PMC free article] [PubMed] [Google Scholar]
- 11.Walsh MK, Quigley HA. In vivo time-lapse fluorescence imaging of individual retinal ganglion cells in mice. J Neurosci Methods. 2008;169:214–221. doi: 10.1016/j.jneumeth.2007.11.029. [DOI] [PMC free article] [PubMed] [Google Scholar]
- 12.Caroni P. Overexpression of growth-associated proteins in the neurons of adult transgenic mice. J Neurosci Methods. 1997;71:3–9. doi: 10.1016/s0165-0270(96)00121-5. [DOI] [PubMed] [Google Scholar]
- 13.Feng G, Mellor RH, Bernstein M, et al. Imaging neuronal subsets in transgenic mice expressing multiple spectral variants of GFP. Neuron. 2000;28:41–51. doi: 10.1016/s0896-6273(00)00084-2. [DOI] [PubMed] [Google Scholar]
- 14.Maurice DM, Zhao J, Nagasaki T. A novel microscope system for time-lapse observation of corneal cells in a living mouse. Exp Eye Res. 2004;78:591–597. doi: 10.1016/s0014-4835(03)00210-0. [DOI] [PubMed] [Google Scholar]
- 15.Junk AK, Mammis A, Savitz SI, et al. Erythropoietin administration protects retinal neurons from acute ischemia-reperfusion injury. Proc Natl Acad Sci USA. 2002;99:10659–10664. doi: 10.1073/pnas.152321399. [DOI] [PMC free article] [PubMed] [Google Scholar]
- 16.Reichstein D, Ren L, Filippopoulos T, Mittag T, Danias J. Apoptotic retinal ganglion cell death in the DBA/2 mouse model of glaucoma. Exp Eye Res. 2007;84:13–21. doi: 10.1016/j.exer.2006.08.009. [DOI] [PubMed] [Google Scholar]
- 17.Thanos S, Indorf L, Naskar R. In vivo FM: using conventional fluorescence microscopy to monitor retinal neuronal death in vivo. Trends Neurosci. 2002;25:441–444. doi: 10.1016/s0166-2236(02)02246-4. [DOI] [PubMed] [Google Scholar]
- 18.Osborne NN, Ugarte M, Chao M, et al. Neuroprotection in relation to retinal ischemia and relevance to glaucoma. Surv Ophthalmol. 1999;43(Suppl 1):S102–S128. doi: 10.1016/s0039-6257(99)00044-2. [DOI] [PubMed] [Google Scholar]
- 19.Kwon YH, Rickman DW, Baruah S, et al. Vitreous and retinal amino acid concentrations in experimental central retinal artery occlusion in the primate. Eye. 2005;19:455–463. doi: 10.1038/sj.eye.6701546. [DOI] [PubMed] [Google Scholar]
- 20.Lotery AJ. Glutamate excitotoxicity in glaucoma: truth or fiction? Eye. 2005;19:369–370. doi: 10.1038/sj.eye.6701623. [DOI] [PubMed] [Google Scholar]
- 21.Salt TE, Cordeiro MF. Glutamate excitotoxicity in glaucoma: throwing the baby out with the bathwater? Eye. 2006;20:730–731. doi: 10.1038/sj.eye.6701967. author reply 731–732. [DOI] [PMC free article] [PubMed] [Google Scholar]
- 22.Levin LA. Retinal ganglion cells and neuroprotection for glaucoma. Surv Ophthalmol. 2003;48(Suppl 1):S21–S24. doi: 10.1016/s0039-6257(03)00007-9. [DOI] [PubMed] [Google Scholar]
- 23.Levkovitch-Verbin H, Quigley HA, Martin KR, Zack DJ, Pease ME, Valenta DF. A model to study differences between primary and secondary degeneration of retinal ganglion cells in rats by partial optic nerve transection. Invest Ophthalmol Vis Sci. 2003;44:3388–3393. doi: 10.1167/iovs.02-0646. [DOI] [PubMed] [Google Scholar]
- 24.Levkovitch-Verbin H, Quigley HA, Kerrigan-Baumrind LA, D'Anna SA, Kerrigan D, Pease ME. Optic nerve transection in monkeys may result in secondary degeneration of retinal ganglion cells. Invest Ophthalmol Vis Sci. 2001;42:975–982. [PubMed] [Google Scholar]
- 25.Kaushik S, Pandav SS, Ram J. Neuroprotection in glaucoma. J Postgrad Med. 2003;49:90–95. doi: 10.4103/0022-3859.917. [DOI] [PubMed] [Google Scholar]
- 26.Schori H, Kipnis J, Yoles E, et al. Vaccination for protection of retinal ganglion cells against death from glutamate cytotoxicity and ocular hypertension: implications for glaucoma. Proc Natl Acad Sci USA. 2001;98:3398–3403. doi: 10.1073/pnas.041609498. [DOI] [PMC free article] [PubMed] [Google Scholar]
- 27.Yang XL. Characterization of receptors for glutamate and GABA in retinal neurons. Prog Neurobiol. 2004;73:127–150. doi: 10.1016/j.pneurobio.2004.04.002. [DOI] [PubMed] [Google Scholar]
- 28.Hollmann M, Heinemann S. Cloned glutamate receptors. Annu Rev Neurosci. 1994;17:31–108. doi: 10.1146/annurev.ne.17.030194.000335. [DOI] [PubMed] [Google Scholar]
- 29.Lam TT, Siew E, Chu R, Tso MO. Ameliorative effect of MK-801 on retinal ischemia. J Ocul Pharmacol Ther. 1997;13:129–137. doi: 10.1089/jop.1997.13.129. [DOI] [PubMed] [Google Scholar]
- 30.el-Asrar AM, Morse PH, Maimone D, Torczynski E, Reder AT. MK-801 protects retinal neurons from hypoxia and the toxicity of glutamate and aspartate. Invest Ophthalmol Vis Sci. 1992;33:3463–3468. [PubMed] [Google Scholar]
- 31.Lipton SA. The molecular basis of memantine action in Alzheimer's disease and other neurologic disorders: low-affinity, uncompetitive antagonism. Curr Alzheimer Res. 2005;2:155–165. doi: 10.2174/1567205053585846. [DOI] [PubMed] [Google Scholar]
- 32.Sun Q, Ooi V, Chan S. N-methyl-D-aspartate-induced excitotoxicity in adult rat retina is antagonized by single systemic injection of MK-801. Exp Brain Res. 2001;138:37–45. doi: 10.1007/s002210100688. [DOI] [PubMed] [Google Scholar]
- 33.Wong EH, Kemp JA, Priestley T, Knight AR, Woodruff GN, Iversen LL. The anticonvulsant MK-801 is a potent N-methyl-D-aspartate antagonist. Proc Natl Acad Sci USA. 1986;83:7104–7108. doi: 10.1073/pnas.83.18.7104. [DOI] [PMC free article] [PubMed] [Google Scholar]
- 34.Livet J, Weissman TA, Kang H, et al. Transgenic strategies for combinatorial expression of fluorescent proteins in the nervous system. Nature. 2007;450:56–62. doi: 10.1038/nature06293. [DOI] [PubMed] [Google Scholar]


