Abstract
1,6-hexamethylene diisocyanate (HDI) is extensively used in the automotive repair industry and is a commonly reported cause of occupational asthma in industrialized populations. However, the exact pathological mechanism remains uncertain. Characterization and quantification of biomarkers resulting from HDI exposure can fill important knowledge gaps between exposure, susceptibility, and the rise of immunological reactions and sensitization leading to asthma. Here, we discuss existing challenges in HDI biomarker analysis including the quantification of N-acetyl-1,6-hexamethylene diamine (monoacetyl-HDA) and N,N′-diacetyl-1,6-hexamethylene diamine (diacetyl-HDA) in urine samples based on previously established methods for HDA analysis. In addition, we describe the optimization of reaction conditions for the synthesis of monoacetyl-HDA and diacetyl-HDA, and utilize these standards for the quantification of these metabolites in the urine of three occupationally exposed workers. Diacetyl-HDA was present in untreated urine at 0.015 – 0.060 μg/l. Using base hydrolysis, the concentration range of monoacetyl-HDA in urine was 0.19 – 2.2 μg/l, 60-fold higher than in the untreated samples on average. HDA was detected only in one sample after base hydrolysis (0.026 μg/l). In contrast, acid hydrolysis yielded HDA concentrations ranging from 0.36 to 10.1 μg/l in these three samples. These findings demonstrate HDI metabolism via N-acetylation metabolic pathway and protein adduct formation resulting from occupational exposure to HDI.
Keywords: 1,6-hexamethylene diamine (HDA); biomarker; 1,6-hexamethylene diisocyanate (HDI); diisocyanate-induced asthma
1. Introduction
Biological monitoring of diisocyanate exposure through the analysis of diisocyanate-derived diamines in the urine of exposed individuals has been performed for a few decades [1]. However, the relationship of these diamines with dermal and inhalation exposure measures has been more difficult to discern due to the lack of a standardized method to assess dermal exposure, as well as the low sensitivity and poor specificity of analytical methods for biomarker quantification. In addition, workers receive dermal and inhalation exposure to different forms of diisocyanates (e.g., monomers, oligomers, and polymers) simultaneously, further complicating attempts to investigate the relationship between exposure and dose. Nevertheless, several volunteer and occupational studies have demonstrated a good association between 1,6-hexamethylene diamine (HDA), in urine or plasma, and inhalation exposure to HDI monomer [2-8].
HDI dermal exposure assessment is much less developed than that of inhalation exposure [9], although the role of dermal exposure in sensitization and diisocyanate-induced asthma has been demonstrated [10,11]. Several different techniques have been used to detect and/or quantify these levels in the workplace including SWYPE pads [12], wipes [13], glove washes [5], and tape-strips [14]. The lack of a standardized and fully validated method to assess HDI dermal exposure has added to the difficulty in investigating associations between dermal exposure and internal dose. Evidence that dermal exposure occurs among automotive spray painters stresses the need to validate methods to measure skin exposure [15]. Post-exposure tape-stripping of the skin has the advantage of quantifying dermal penetration of HDI, and has the potential to be adapted to collect and measure HDI-keratin adducts that have been identified in vivo [16].
Automotive repair shop workers are becoming increasingly exposed to HDI oligomers (i.e., isocyanurate, biuret, uretidone) relative to HDI monomer during spray-painting operations, and analytical methods for quantifying specific HDI monomer and oligomers in the breathing-zone and skin of exposed workers are available [14,15,17]. Since these compounds differ in size and volatility, absorption and metabolism may differ by type of HDI oligomer and between monomer and oligomers. Because exposure to these compounds can now be quantified by LC-MS analysis [18], analytical methods to identify and validate specific biomarkers stemming from HDI monomer and oligomers need to be developed in order to help characterize exposure patterns to these compounds, as well as to understand their potential role in sensitization and asthma.
Measures of exposure levels alone, through tape-stripping of the skin or air monitoring, are insufficient to fully understand mechanisms involved in sensitization. Information on HDI metabolism and protein adduct formation has contributed to our understanding of the possible mechanisms involved in sensitization and development of diisocyanate-induced asthma [16,19,20]. As only 5-10% of diisocyanate-exposed individuals develop asthma [21], attention has been focused on the role of genetic factors in modifying individual susceptibility to asthma. Polymorphisms in glutathione-S-transferase (GST) or N-acetyltransferase (NAT) genes may result in inter-individual variation in GST or NAT enzyme activities that are involved in HDI metabolism, and could lead to increased risk of disease development [22]. Thus, highly sensitive and specific analytical methods for the quantification of HDI metabolites would improve our understanding of genetic susceptibility factors contributing to exposure-disease relationships.
HDI monomer (see Figure 1: 11) is the most commonly used aliphatic diisocyanate [23] for the production of polyurethane foams and coatings, as well as a hardener in automobile and airplane paints. Its highly reactive isocyanato (NCO) moieties react readily with the hydroxyl (OH) group of polyols to form polyurethanes. Thus, the chemical reactivity of HDI has been exploited in the automotive repair industry as a component of polyurethane paints and coatings. The negative consequence of exposure to these highly reactive compounds is the rapid reaction of NCO moieties with protein functional groups such as amines, hydroxyls, and thiols, with the last of these reactions favored under physiologic conditions [24].
Figure 1.
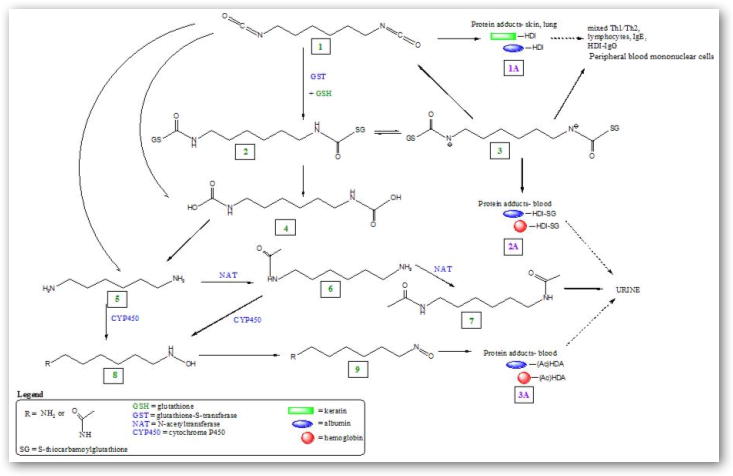
Proposed enzymatic (GST, NAT, CYP450) and non-enzymatic directed HDI metabolic pathways leading to formation of HDI-protein adducts, potential immune response, and elimination.
Biological monitoring of HDI exposure has primarily involved analysis of HDA, the hydrolysis product of HDI, in urine or plasma as a marker of exposure to HDI. Typically, 1-2 ml of urine or plasma is hydrolyzed by acid or base, and the liberated diamines are extracted into toluene followed by derivatization with heptafluorobutyric anhydride (HFBA) or pentafluoropropionic anhydride (PFPA) and analyzed by gas chromatography-mass spectrometry (GC-MS) in negative chemical ionization mode [6,25] or by liquid chromatography-mass spectrometry (LC-MS) [26]. The former has been the most commonly used method for HDA analysis and implemented primarily when HFBA was used as the derivatization agent. The HDA detection limits in urine or plasma as reported in various publications are in the range of 0.02 – 3.0 μg/l (summarized in Table 1). The high detection limit of HDA in samples, resulting in low analytical sensitivity, has hindered quantification of plasma HDA in several studies [3,6] and resulted in relatively large number of non-detectable levels in both plasma and urine [4,8]. However, measurement of HDA in acid-hydrolyzed plasma among workers exposed to HDI allows for further characterization of blood biomarkers and evaluation of their usefulness as markers of HDI exposure [8].
Table 1.
Summary of analytical method and HDA detection limits (μg/l) in biological media.
| Reference | Biological media | Derivatization agent1 | Analytical method2 | Detection limit (μg/l) |
|---|---|---|---|---|
| Brorson et al. 1990 [6] | plasma & urine | HFBA | GC-MS | 0.5 |
| Dalene et al. 1994 [25] | urine | TFECF | GC-MS | 0.5 |
| Skarping et al. 1994 [26] | urine | PFPA | LC-MS | 0.1 |
| Tinnerberg et al. 1995 [3] | plasma & urine | PFPA | GC-MS | ≤0.1 |
| Maitre et al. 1996 [2] | urine | HFBA | GC-MS | 0.35 |
| Rosenberg et al. 2002 [27] | urine | HFBA | GC-MS | 0.43 |
| Liu et al. 2004 [7] | urine | HFBA | GC-MS | 0.2 |
| Pronk et al. 2006 [5] | urine | HFBA | GC-MS | 3.0 |
| Gaines et al. 2009 [4] | urine | HFBA | GC-MS | 0.04 |
| Flack et al. 2009 [8] | plasma | HFBA | GC-MS | 0.02 |
HFBA = heptafluorobutyric anhydride; TFECF = 2′,2′,2-trifluoroethyl chloroformate; PFPA = pentafluoropropionic anhydride.
GC-MS = gas chromatography-mass spectrometry; LC-MS = liquid chromatography-mass spectrometry.
Reported as limit of quantification (LOQ) = 5 nmol/l = limit of detection (LOD) × 1.5 [27], and LOD (μg/l) calculated as follows: 5 nmol/l ÷ 1.5 × 1 mol/109 nmol × 116.21 g/mol × 106 μg/g = 0.4 μg/l.
Analytical methods for HDA in biological media are hindered by extensive sample processing involving lengthy acid or base hydrolysis (4 – 16 h), multiple extraction steps with toluene, derivatization and drying of samples [3,5,26,27], and relatively large volume of plasma required to conduct replicate analyses (2 – 4 ml). Acid hydrolysis releases HDA-protein conjugates from biological matrixes and converts the acetyl functional groups on N-acetyl-1,6-hexamethylene diamine (monoacetyl-HDA) and N,N′-diacetyl-1,6-hexamethylene diamine (diacetyl-HDA) back to HDA. Thus, the HDA detected following these treatment conditions may be derived from a number of other metabolites and adducts, and any individual variability in specific metabolite formation would be masked by acid hydrolysis. Base hydrolysis of hemoglobin has resulted in identification of 4,4′-methylenedianiline (MDA) and N′-acetyl-4,4′-methylenedianiline (monoacetyl-MDA) hemoglobin adducts [28,29]. Whether base hydrolysis could liberate albumin and hemoglobin adducts of HDA and monoacetyl-HDA or adducts of HDI oligomers, has yet to be determined. HDA was non-detectable in untreated urine while base hydrolysis produced detectable levels of HDA [26], indicating that HDA may be covalently bound to proteins, and/or metabolized to other products such as diacetyl-HDA. Therefore, analytical specificity for HDI exposure biomarkers must be further developed to determine individual differences in specific metabolite formation related to HDI monomer and oligomer exposure.
Because no studies have been conducted to quantify monoacetyl-HDA or diacetyl-HDA in biological samples, and analytical standards are not commercially available, optimized conditions for their synthesis and detection are not well established, leading to variable analytical conditions being reported in a few studies [30-32]. Brorson and colleagues (1990) reported conditions for the synthesis of monoacetyl-HDA using a 1:1 molar ratio of acetic anhydride to HDA in acetonitrile and reacting for 2 h [31]. However, the final results for monoacetyl-HDA in urine samples were only “semi-quantitative” because monoacetyl-HDA standards were not purified or fully characterized. In addition, the individuals in their study were orally exposed to HDA, not HDI. Thus, monoacetyl-HDA and diacetyl-HDA metabolites among HDI exposed workers, and whose exposure occurs primarily via dermal and inhalation routes, need to be further investigated. Therefore, our intent was to (i) modify and improve on existing protocols for monoacetyl-HDA and diacetyl-HDA synthesis and quantification, (ii) use these methods to quantify monoacetyl-HDA and diacetyl-HDA in urine from three occupationally exposed workers, using GC-MS analysis, and (iii) discuss our current understanding of HDI metabolism by integrating these findings with additional reaction pathways.
2. Materials and Methods
Solvents and chemicals were purchased from Thermo Fisher (Hampton, NH): HPLC grade (99.9%) dichloromethane (#AC61005-0040), ethyl acetate (#AC61006-0040) and acetonitrile (#AC61001-0040), sodium sulfate anhydrous (certified ACS, #S421-500), acetic anhydride (>99%, #AC14949-0010), and sodium hydroxide (certified ACS, #S318-500); Sigma Aldrich (St. Louis, MO): 1,6-hexamethylene diamine (≥99%, #33000), 1,7-diaminoheptane (98%, #D17408), and heptafluorobutyric anhydride (HFBA, derivatization grade, #394912).
2.1 Reaction with acetic anhydride
Acetylation of HDA in acetonitrile for synthesis of monoacetyl-HDA has been published previously [31]. Because we used ethyl acetate in the GC-MS analysis of HDA in urine and plasma [27], we were interested in comparing acetylation of HDA carried out in ethyl acetate or acetonitrile. HDA was dissolved in acetonitrile according to Brorson and colleagues [31], and in ethyl acetate (2 mg/ml, 100 ml total volume). Acetic anhydride was added dropwise with constant stirring at seven molar ratios of acetic anhydride to HDA increasing from 0.7:1 to 4:1, (S1A – S7A and S1E – S7E, respectively) during which time a precipitate formed. Solutions were allowed to react at room temperature for 2 h with continuous stirring then filtered under vacuum using a 0.22 μm, 25 mm nylon filter. The precipitate collected on filters was dissolved in ethyl acetate (1 mg/ml). The filtrates were dried under N2 and dissolved in ethyl acetate at 1 mg/ml.
1,7-Heptanediamine (HpDA), the internal standard (IS) for HDA, was dissolved in ethyl acetate (2 mg/ml, 100 ml total volume). Acetic anhydride was added dropwise with constant stirring at 0.9:1 molar ratio of acetic anhydride to HpDA. The solution was allowed to react at room temperature for 2 h with continuous stirring, filtered, and filtrates dried under N2. The dried products were dissolved in ethyl acetate to make a 1 mg/ml IS mixture.
Each 1 mg/ml sample, synthesized in acetonitrile or ethyl acetate, was diluted 1:1000 in ethyl acetate (final concentration = 1 μg/ml). A solution containing monoacetyl-HDA mixture (S3E) and IS mixture (final concentrations = 1 μg/ml) was also prepared in ethyl acetate. To 1 ml of these diluted samples, 10 μl HFBA was added and reacted for 1 h at 55°C with periodic shaking.
2.2 GC-MS Analysis
Samples were immediately analyzed by GC-MS (Thermo Trace GC Ultra interfaced with a PolarisQ ion trap mass spectrometer and AI/AS 3000 injector, and Xcalibur 1.4 SR1 software, Thermo Electron Corporation, Austin, TX) in negative chemical ionization mode, according to Flack and colleagues [8], in scan mode (m/z 200-600) using methane as the reagent gas. Injections (1 μl) were made under splitless mode of 30 s with injector temperature of 220°C. Samples were separated on a GC capillary column (DB5-MS, 30 m × 0.25 mm ID, 0.1 μm film thickness; Agilent Technologies, Palo Alto, CA). The ion source and GC transfer line temperatures were maintained at 150°C and 260°C, respectively. Helium was used as the carrier gas with a constant flow of 1 ml/min. The GC oven temperature program was 50°C (1.0 min) to 155°C at 10°C/min, 155°C to 185°C at 2°C/min, and 185°C to 300°C at 25°C/min (final temperature held for 10 min). Ions were monitored in negative ion chemical ionization mode using methane as the reagent gas (1.8 ml/min). Major ions corresponding to HDA, monoacetyl-HDA, and diacetyl-HDA, as well as internal standards, HpDA, N-acetyl-1,7-heptanediamine (monoacetyl-HpDA), and N,N′-diacetyl-1,7-heptanediamine (diacetyl-HpDA), were identified. The relative percent abundance of each compound (i.e., peak intensity of diamine/sum of peak intensities × 100) was calculated for each molar ratio by solvent type (acetonitrile or ethyl acetate).
2.3 Reaction time
HDA was dissolved in ethyl acetate (2 mg/ml, 100 ml total volume) to which acetic anhydride (0.9:1 molar ratio acetic anhydride to HDA) was dropwise added with constant stirring at room temperature. At each respective time point (1, 2, 3, 4, and 21 h) 10 ml aliquot of the mixture was filtered and the filtrate diluted 1:1000 in ethyl acetate (5 ml final volume). Solutions were reacted with 10 μl HFBA for 1 h at 55°C and immediately analyzed by GC-MS. The percent abundance of each compound was calculated for each reaction time point.
2.4 Standard curves (diacetyl-HDA and HDA)
A portion of the synthesized diacetyl-HDA solution (S7E) was dried under N2, dissolved in ethyl acetate (1 mg/ml), and diluted to a concentration range (0 – 4 μg/ml) in ethyl acetate. A concentration range of HDA was also prepared in ethyl acetate (0 – 1 μg/ml). To 1 ml diluted samples, 5 μl of 1 mg/ml IS mixture was added. Each solution was derivatized with 10 μl HFBA and allowed to react for 1 h at 55°C. Samples were immediately analyzed by GC-MS.
2.5 Treatment of spiked urine (base hydrolysis vs. no treatment)
To two control (unexposed) urine samples (1 ml aliquots), 10 μl of the 1 μg/ml optimized monoacetyl-HDA mixture synthesized in ethyl acetate (S3E) was added and shaken (set A). To two control urine samples (1 ml aliquots), 10 μl of the 1 μg/ml optimized diacetyl-HDA mixture synthesized in ethyl acetate (S7E) was added and shaken (set B). A reagent blank (1 ml urine) was also prepared, which was not spiked with monoacetyl-HDA or diacetyl-HDA mixture. Aqueous NaOH (32%, 50 μl) was added to one sample in set A and B, as well as the reagent blank, shaken for several seconds, and allowed to react at room temperature for 20 min, according to Sepai and colleagues [28], while the other samples were left untreated. Samples were extracted into 6 ml dichloromethane and dried over sodium sulfate. Dried extracts were transferred to fresh vials and reacted with 10 μl HFBA for 30 min at room temperature. The derivatized extracts were dried under nitrogen, reconstituted in 200 μl ethyl acetate, sonicated for several minutes, and analyzed by GC-MS.
2.6 Analysis of urine samples
Urine samples were collected from three automotive spray painters at the end of the workday who were applying HDI-containing paint. These samples were previously analyzed for total HDA using acid hydrolysis (0.36 – 10.1 μg/l) [4], and were analyzed for acetylated HDA using base hydrolysis or no treatment according to section 2.2 and GC-MS analysis according to section 2.5. The acetylated HDA levels were quantified in duplicate samples against a standard curve of urine spiked with synthesized 1 mg/ml (S3E) amine mixture (final urine concentrations: 0 – 0.09 μg HDA/l, 0 – 2.1 μg monoacetyl-HDA/l, 0 – 2.8 μg diacetyl-HDA/l). These standards were subjected to both base hydrolysis or no treatment and analyzed by GC-MS. In addition, breathing-zone and dermal tape-strip samples were collected during and after each paint task, respectively, and previously analyzed by LC-MS [15,17]. These data for total urinary HDA in acid-hydrolyzed samples and HDI in breathing-zone and dermal tape-strip samples have been published [4,15,17].
3. Results
3.1 Acetylation of HDA
GC-MS analysis of the synthesized mixtures in ethyl acetate or acetonitrile, as well as untreated urine spiked with the mixtures, revealed that the major ions corresponding to derivatized HDA, monoacetyl-HDA, and diacetyl-HDA was m/z 448 [M--H3F3] eluting at 13.9 min, 510 [M--H2F2] eluting at 14.9 min, and 552 [M--H2F2] eluting at 16.0 min, respectively (Figure 2A). The major ion for HpDA, monoacetyl-HpDA, and diacetyl-HpDA in the IS mixture was m/z 462 [M--H3F3] eluting at 15.6 min, 524 [M--H2F2] eluting at 16.6 min, and 566 [M--H2F2] eluting at 17.8 min, respectively (Figure 3). The mass spectra for each corresponding standard peak reflected successive losses of hydrogen (H) and fluorine (F) atoms from derivatized parent amines (HDA=508, monoacetyl-HDA=550, diacetyl-HDA=592 g/mol) and IS amines (HpDA=522, monoacetyl-HpDA=564, diacetyl-HpDA=606 g/mol). Ion selection used in quantification of each amine was based on the most abundant ion fragment in mass spectra (Figure 4). The GC-MS chromatogram of amine mixture displaying the major fragment ion for each amine (Figure 3) also revealed smaller peaks resulting from shared fragment ions among the different amines [e.g., monoacetyl-HDA peak (m/z 448) at 14.9 min].
Figure 2.
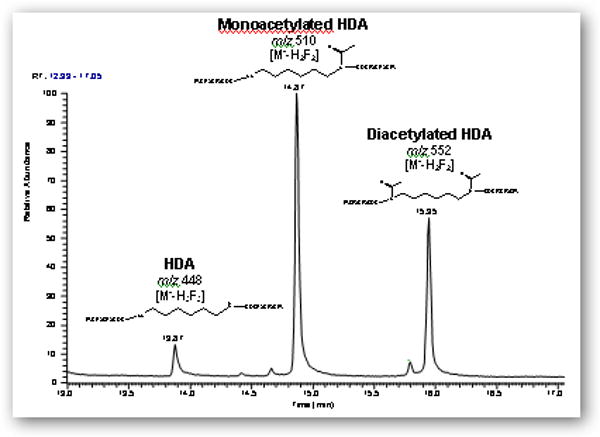
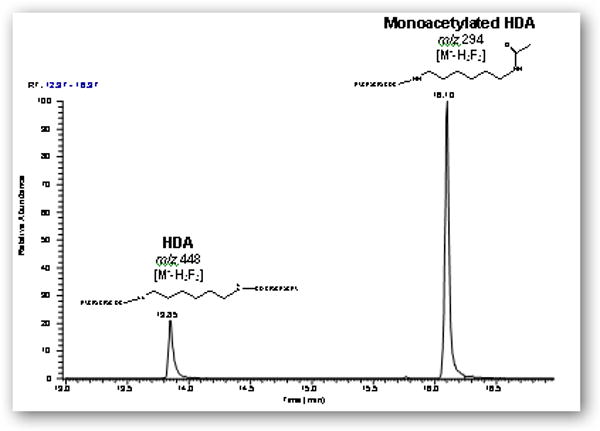
Gas chromatograms (m/z 200-600) of (A) a filtered solution containing HDA, monoacetyl-HDA, and diacetyl-HDA synthesized with 0.9:1 molar ratio (acetic anhydride to HDA) in ethyl acetate using 2 h reaction time and derivatization with HFBA and (B) derivatized extract from control urine spiked with the 0.9:1 molar ratio mixture and subjected to base hydrolysis.
Figure 3.
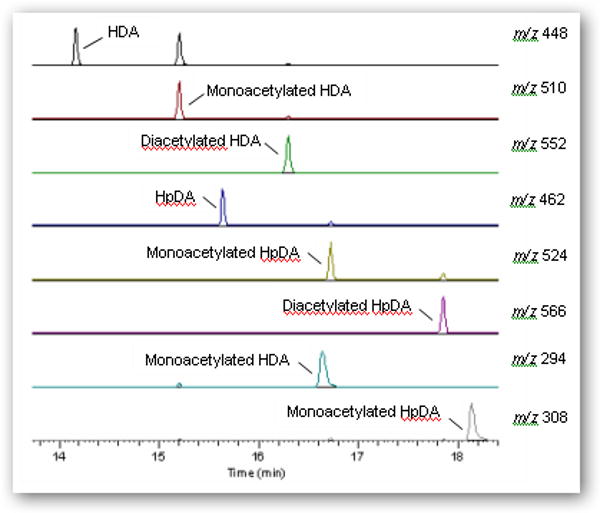
GC-MS chromatogram and most abundant mass fragment ion (m/z) for each amine (HDA, monoacetyl-HDA, diacetyl-HDA) and the internal standards (HpDA, monoacetyl-HpDA, diacetyl-HpDA) in derivatized extract from base-hydrolyzed control urine sample spiked with 0.9:1 molar ratio (acetic anhydride to HDA or HpDA) mixtures.
Figure 4.
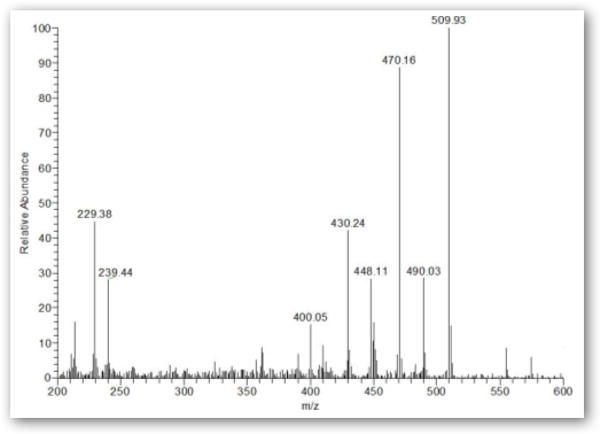
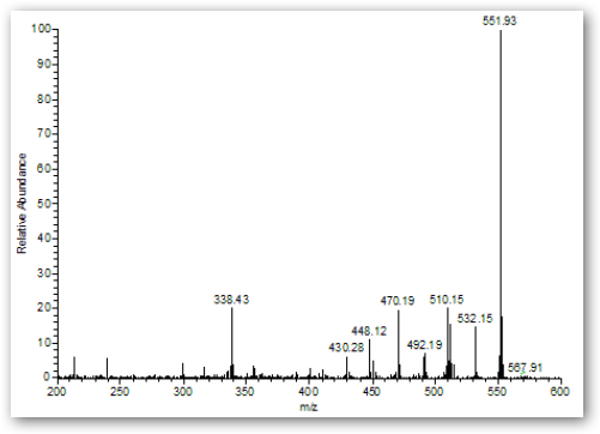
GC mass spectra (m/z 200 – 600) of monoacetyl-HDA (A) and diacetyl-HDA (B) in derivatized extract from untreated control urine sample spiked with 0.9:1 molar ratio (acetic anhydride to HDA or HpDA) mixtures.
Comparison of various molar ratios of acetic anhydride to HDA synthesized in acetonitrile or ethyl acetate is summarized in Figure 5. The reaction conditions yielding >99% diacetyl-HDA was a 2:1 molar ratio in acetonitrile (S5A) or a 4:1 molar ratio in ethyl acetate (S7E). Reaction in ethyl acetate at molar ratio 0.9:1 (acetic anhydride to HDA) gave the maximum yield of monoacetyl-HDA (55%). Monoacetyl-HDA was quantified in the product by ascertaining the concentration of HDA and diacetyl-HDA in a known concentration of mixture against pure (≥99%) HDA and diacetyl-HDA standards. Monoacetyl-HDA was quantified in these mixtures by subtracting out the known concentrations of HDA and diacetyl-HDA in the 1 mg/ml mixture quantified against pure (≥99%) HDA (0 – 1 μg/ml) and diacetyl-HDA standards (S7E; 0 – 4 μg/ml) prepared in ethyl acetate (R2 = 0.999). The limit of detection (LOD) of diacetyl-HDA in ethyl acetate, defined as a signal-to-noise ratio of 3, was 1 ng/ml, corresponding to 1 pg on-column injection. The optimal reaction time resulting in both the maximum percent yield of monoacetyl-HDA and minimal percent of unreacted HDA was 2 h, which was also the reaction time used by Brorson and colleagues [31]. These reaction conditions may also be used for the synthesis of monoacetyl-HDA and diacetyl-HpDA, used as the internal standard for monoacetyl-HDA and diacetyl-HDA quantification in biological samples.
Figure 5.
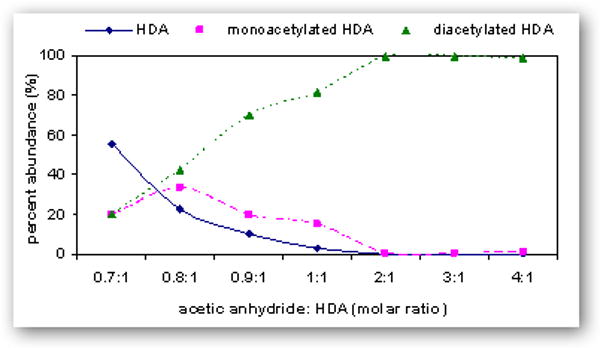
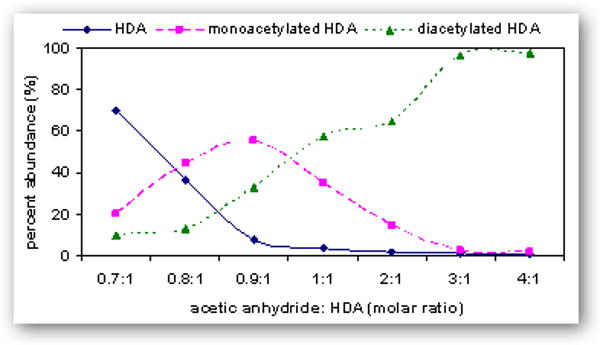
Relative percent abundance of HDA ( ), monoacetyl-HDA (
 ), and diacetyl-HDA (
 ) in derivatized mixtures synthesized by varying the molar ratios of acetic anhydride to HDA (0.7:1 to 4:1) in acetonitrile (A) or ethyl acetate (B), reacting for 2 h, drying filtrates under N2, and preparing 1 μg/ml solutions in ethyl acetate.
3.2 Analysis of spiked urine
GC-MS analysis of the spiked base-hydrolyzed urine revealed a chromatographic profile with a major peak at retention time of 16.1 min and containing an ion corresponding to monoderivatized monoacetyl-HDA, m/z 294 [M--H3F3] eluting at 16.10 min (Figure 2B). This major ion fragment stemmed from derivatized monoacetyl-HDA and whose acetyl group did not react with HFBA. Futhermore, diacetyl-HDA in the base-hydrolyzed urine (spiked with S3E or S7E) was approximately 5 to 20-fold lower in sensitivity, revealing a limitation of base hydrolysis and subsequent HFBA derivatization for detection of both monoacetyl-HDA and diacetyl-HDA in biological samples. The limit of detection (LOD; signal-to-noise of 3:1) and limit of quantification (LOQ; signal-to-noise of 10:1) for HDA, monoacetyl-HDA, and diacetyl-HDA in spiked urine subjected to no treatment or base hydrolysis are summarized in Table 2. We postulated that base hydrolysis of urine modified the derivatization reaction of HFBA with the acetyl groups on monoacetyl-HDA and diacetyl-HDA. It is unlikely that base hydrolysis converted diacetyl-HDA to monoacetyl-HDA or HDA since the chromatographic profiles of base-hydrolyzed urine samples spiked with pure diacetyl-HDA solution (S7E) did not show peaks corresponding to HDA or monoacetyl-HDA. The lower sensitivity and different extraction method may explain why Brorson and colleagues [31], did not detect diacetyl-HDA in base-hydrolyzed urine samples, while monoacetyl-HDA was detectable. Therefore, no hydrolysis treatment could be implemented to improve detection of diacetyl-HDA.
Table 2.
Summary of the LOD and LOQ values for HDA, monoacetyl-HDA, and diacetyl-HDA in spiked urine under base hydrolysis or no treatment conditions.
| Analyte | LOD (μg/l) | LOQ (μg/l) | ||
|---|---|---|---|---|
| Base hydrolysis | No treatment | Base hydrolysis | No treatment | |
| HDA | 0.035 | 0.030 | 0.12 | 0.10 |
| Monoacetyl-HDA | 0.022 | 0.020 | 0.080 | 0.070 |
| Diacetyl-HDA | 0.050 | 0.015 | 0.20 | 0.050 |
LOD = limit of detection; LOQ = limit of quantification.
3.3 Analysis of urine samples
Urine samples collected from three HDI exposed workers at the end of the workday were analyzed for HDA, monoacetyl-HDA, and diacetyl-HDA using base hydrolysis or no treatment. The results are summarized in Table 3 along with HDI breathing-zone and dermal exposure levels as well as HDA concentrations analyzed in these same samples using acid-hydrolysis and published previously [4,15,17]. All three untreated urine samples had detectable levels of diacetyl-HDA (0.015 – 0.062 μg/l) while one sample had a detectable level after base hydrolysis (0.065 μg/l). Additionally, the signal-to-noise ratio of diacetyl-HDA in base-hydrolyzed samples was 2 to 10-fold lower compared to untreated samples. Therefore, the sensitivity of diacetyl-HDA analysis may be improved by not hydrolyzing the samples. All three urine samples subjected to base hydrolysis had detectable levels of monoacetyl-HDA (0.19 – 2.2 μg/l) whereas monoacetyl-HDA was detectable in two untreated samples (0.020 and 0.061 μg/l). In addition, base-hydrolyzed samples had an average of 60-fold higher concentrations compared with the untreated samples. These differences between untreated and base-hydrolyzed samples indicate the presence of monoacetyl-HDA-protein adducts that are released after base-hydrolysis. One urine sample had a detectable level of HDA after base hydrolysis (0.026 μg/l) while HDA was non-detectable in all untreated samples.
Table 3.
Summary of the average inhalation and total dermal HDI levels and HDA and acetylated HDA concentrations in the end-of-day urine samples collected from three workers occupationally exposed to HDI using different treatment conditions.
| Worker | Breathing-zone HDI1 (μg/m3) | Dermal HDI2 (ng/mm3) | HDA (μg/l) | Monoacetyl-HDA (μg/l) | Diacetyl-HDA (μg/l) | ||||
|---|---|---|---|---|---|---|---|---|---|
| Acid3 | Base | None | Base | None | Base | None | |||
| 1 | 0.94 | 15.8 | 4.1 | ND | ND | 1.7 | 0.020 | ND | 0.048 |
| 2 | 15.0 | 730 | 10.1 | 0.026 | ND | 2.2 | 0.061 | 0.065 | 0.060 |
| 3 | 4.3 | 20.3 | 0.36 | ND | ND | 0.19 | ND | ND | 0.015 |
ND = non-detectable.
Average HDI breathing-zone level across paint tasks (μg/m3) determined using LC-MS.
Total dermal HDI exposure level across paint tasks (ng/mm3) determined using LC-MS.
Urinary HDA concentration determined using acid hydrolysis and GC-MS [4].
4. Discussion
Our analysis of monoacetyl-HDA and diacetyl-HDA in the urine of three HDI exposed workers adds to our understanding of an important metabolic pathway for HDI involving N-acetylation of HDA. The difference in monoacetyl-HDA levels between untreated and base-hydrolyzed urine also demonstrates the presence of monoacetyl-HDA-protein adducts that are secreted into urine, and subsequently released with base hydrolysis. The absence of HDA in untreated or base-hydrolyzed urine samples indicates that HDA is covalently bound to proteins, which was also demonstrated by Skarping and colleagues [26]. Moreover, the concentration of bound monoacetyl-HDA (i.e., base-hydrolyzed minus untreated) in the urine samples represented 21 – 52% of the total HDA concentration (acid hydrolysis) while diacetyl-HDA represented 0.6 – 4% of the total HDA concentration indicating that monoacetyl-HDA adducts comprise a large portion of the total HDA with unbound diacetyl-HDA representing a minor component. The concentration of total HDA in urine and HDI exposure levels followed a similar trend with monoacetyl-HDA and diacetyl-HDA (Table 3). Further work is needed to investigate the significance of this metabolic pathway resulting from HDI exposure in the occupational setting among a larger population of workers. We have integrated these findings for HDI metabolism with additional reaction pathways identified in other publications to provide an overview of HDI metabolism (Figure 1).
In addition to the HDI acetylation pathway, diisocyanates can also react spontaneously, or through catalysis by glutathione-S-transferase (GST), with thiol groups in cysteine residues of glutathione (GSH) and other proteins to form mono- and bis-dithiocarbamate adducts (see Figure 1: 2) [24,33]. In vitro studies by Chipinda and colleagues [33] indicated that HDI-protein conjugates are also created via the base-catalyzed elimination reaction of the bis-dithiocarbamate adducts (2) to form an intermediate S-glutathionyl adduct (3), which can undergo carbamoylation reactions with proteins or undergo solvolysis to regenerate HDI (1), resulting in potential carbamoylations with other nucleophilic sites on albumin or hemoglobin far from the initial site of contact (2A). This reaction pathway competes with the base-catalyzed biomolecular substitution reaction, leading to the formation of the very labile carbamic acid group (4), which decomposes to HDA (5) [33]. Because these reaction pathways were demonstrated in vitro, it is unknown whether these metabolic products can be measured in humans following occupational exposure to HDI. The role of individual differences in enzymatic activity (i.e., GST) on the risk of developing diisocyanate-induced asthma [21] emphasizes the importance of investigating this metabolic pathway among exposed workers.
Sepai and colleagues [28] proposed an alternative pathway for diisocyanate-adduct formation based on measurements of MDA and monoacetyl-MDA in blood and urine samples. This proposed metabolic pathway for HDI is based on the N-hydroxylation of the amines (5, 6), catalyzed by cytochrome P-450 isoforms (CYP450), resulting in the formation of N-hydroxyamine (8) and the nitroso compound (9), which can react with thiols on albumin or hemoglobin (3A) [28]. This pathway competes with N-acetylation of the amine, catalyzed by NAT enzymes, to form monoacetylated (6) and diacetylated amines (7), which are excreted in urine [25]. The identification of monoacetyl-HDA in individuals receiving HDA by oral administration also indicates the potential for this metabolic pathway [31]. However, prior to our study reported here, monoacetyl-HDA had not yet been identified in individuals exposed to HDI in the occupational setting where dermal and inhalation exposures are the major exposure routes. Therefore, the identification and quantification of monoacetyl-HDA and diacetyl-HDA in urine of occupationally exposed workers demonstrates the relevance of the N-acetylation pathway in the metabolism of HDA. In addition, the difference in monoacetyl-HDA levels between base-hydrolyzed and untreated urine demonstrates the presence of monoacetyl-HDA-protein adducts that are secreted into urine.
The association between HDI exposure and biomarker levels has been evaluated in several HDI exposure assessment studies and a good correlation between HDI inhalation exposure and urinary HDA levels has been observed [2-7]. However, the impact of dermal exposure on urinary HDA levels has been quantitatively investigated in only one study [4]. Investigation of these associations between exposure and biomarker levels has been hindered not only by the sensitivity of analytical methods, but also by the large inter- and intra-individual variability in plasma and urinary biomarker levels of HDA [5]. In urine, this is partially attributed to the biphasic elimination pattern of HDA, characterized by a rapid elimination phase (t1/2 = 1.2 – 2.9 h) and a slow elimination phase, which may be attributed to the breakdown of HDI-protein conjugates in the blood [3,4,6,7]. Furthermore, analyses of HDA in acid hydrolyzed urine may represent a combination of various metabolites, including free and protein conjugates of HDA and acetylated HDA. Therefore, the identification of specific HDI metabolites, such as monoacetyl-HDA or diacetyl-HDA, would improve biological monitoring methods for HDI exposure by reducing the inter- and intra-individual variability in biomarker measures and providing further information on HDI metabolism.
The low proportion of diisocyanate-induced asthmatics with detectable specific IgE [34,35] has generated theories concerning disease mechanisms and genetic susceptibility. Lung epithelial cells, such as keratin and serum albumin, can act as carriers (antigen presenting cells) that present HDI to the immune system (1A), resulting in induction of mixed Th1/Th2 type response and lymphocyte production [16,19,36,37], as well as peripheral blood mononuclear cell responses, which has been demonstrated in human subjects receiving inhalation exposure to HDI-albumin [38] (Figure 1). Therefore, biomarker type and yield may be applied further to investigate metabolic pathways contributing to increased risk of diisocyanate-induced asthma. Not only is the large inter-individual variability in HDA levels partially attributed to workplace exposure factors, but also to individual differences in GST or acetylator status resulting from variable NAT enzyme activity that influence metabolism and susceptibility for disease [22]. We have demonstrated the elimination of monoacetyl-HDA and diacetyl-HDA in the urine of occupationally exposed workers. Factors driving these pathways may be further investigated using improved genotyping technologies for identifying individual single nucleotide polymorphisms and copy number variants affecting variable enzyme activities. Thus, analytical specificity for HDI biomarkers needs to be developed in order to investigate factors driving metabolic activation versus detoxification of HDI and susceptibility of diisocyanate-induced asthma.
Our analysis of monoacetyl-HDA and diacetyl-HDA in the urine samples collected from occupationally exposed workers demonstrates the relevance of the N-acetylation metabolic pathway for HDI following exposure. Our proposed analytical methods for the quantification of monoacetyl-HDA and diacetyl-HDA in untreated or base-hydrolyzed urine may be utilized and applied to further investigate individual differences in HDI metabolism and relate these measurements to HDI exposure levels and susceptibility factors for HDI-associated diseases.
5. Conclusions
Highly sensitive and specific analytical methods for HDI biomarkers would allow for improved characterization of HDI exposure patterns and predicting systemic exposure and dose, as well as enhance our understanding of exposure-disease relationships. Progress has been made in identifying HDI metabolic pathways and intermediates leading to the formation of various protein adducts that may play a role in disease development. However, further research is needed to improve the sensitivity and specificity of analytical methods for the detection of HDA and other metabolites to better explain the sources of intra- and inter-individual variability in metabolite formation related to HDI exposure. The lack of commercially available analytical standards for monoacetyl-HDA and diacetyl-HDA has also hindered quantification of these metabolic products in biological samples. Therefore, we have optimized the reaction conditions for monoacetyl-HDA and diacetyl-HDA synthesis and presented analytical methods for their analysis in order to improve quantification of these metabolites in biological samples. In addition, we have demonstrated that monoacetyl-HDA and diacetyl-HDA may be quantified in the urine of exposed workers, thereby further contributing to our understanding of HDI metabolism.
Acknowledgments
This study was supported by grants from the National Institute for Occupational Safety and Health (R01-OH007598 and T42/CCT422952), the National Institute of Environmental Health Sciences (P30ES10126), and American Chemistry Council (RSK0015-01).
Footnotes
Numbers and letters in bold (e.g., 1, 1A) refer to the specific chemical reaction product and protein adducts, respectively, in Figure 1.
Publisher's Disclaimer: This is a PDF file of an unedited manuscript that has been accepted for publication. As a service to our customers we are providing this early version of the manuscript. The manuscript will undergo copyediting, typesetting, and review of the resulting proof before it is published in its final citable form. Please note that during the production process errors may be discovered which could affect the content, and all legal disclaimers that apply to the journal pertain.
References
- 1.Rosenberg C, Savolainen H. J Chromatogr. 1986;367:385. doi: 10.1016/s0021-9673(00)94859-3. [DOI] [PubMed] [Google Scholar]
- 2.Maitre A, Berode M, Perdrix A, Stoklov M, Mallion JM, Savolainen H. Int Arch Occup Environ Health. 1996;69:65. doi: 10.1007/BF02630741. [DOI] [PubMed] [Google Scholar]
- 3.Tinnerberg H, Skarping G, Dalene M, Hagmar L. Int Arch Occup Environ Health. 1995;67:367. doi: 10.1007/BF00381050. [DOI] [PubMed] [Google Scholar]
- 4.Gaines LGT, Fent KW, Flack SL, Thomasen JM, Ball LM, Richardson DB, Ding K, Whittaker SG, Nylander-French LA. Ann Occup Hyg. 2009 doi: 10.1093/annhyg/meq041. submitted. [DOI] [PMC free article] [PubMed] [Google Scholar]
- 5.Pronk A, Yu F, Vlaanderen J, Tielemans E, Preller L, Bobeldijk I, Deddens JA, Latza U, Baur X, Heederik D. Occup Environ Med. 2006;63:624. doi: 10.1136/oem.2005.023226. [DOI] [PMC free article] [PubMed] [Google Scholar]
- 6.Brorson T, Skarping G, Nielsen J. Int Arch Occup Environ Health. 1990;62:385. doi: 10.1007/BF00381369. [DOI] [PubMed] [Google Scholar]
- 7.Liu Y, Berode M, Stowe MH, Holm CT, Walsh FX, Slade MD, Boeniger MF, Redlich CA. Int J Occup Environ Health. 2004;10:262. doi: 10.1179/oeh.2004.10.3.262. [DOI] [PubMed] [Google Scholar]
- 8.Flack SL, Fent KW, Trelles Gaines LG, Thomasen JM, Whittaker S, Ball LM, Nylander-French LA. Ann Occup Hyg. 2009 doi: 10.1093/annhyg/mep069. [DOI] [PMC free article] [PubMed] [Google Scholar]
- 9.Bello D, Herrick CA, Smith TJ, Woskie SR, Streicher RP, Cullen MR, Liu Y, Redlich CA. Environ Health Perspect. 2007;115:328. doi: 10.1289/ehp.9557. [DOI] [PMC free article] [PubMed] [Google Scholar]
- 10.Rattray NJ, Botham PA, Hext PM, Woodcock DR, Fielding I, Dearman RJ, Kimber I. Toxicology. 1994;88:15. doi: 10.1016/0300-483x(94)90108-2. [DOI] [PubMed] [Google Scholar]
- 11.Pauluhn J, Mohr U. Toxicology. 1994;92:53. doi: 10.1016/0300-483x(94)90167-8. [DOI] [PubMed] [Google Scholar]
- 12.Liu Y, Bello D, Sparer JA, Stowe MH, Gore RJ, Woskie SR, Cullen MR, Redlich CA. Ann Occup Hyg. 2007;51:429. doi: 10.1093/annhyg/mem021. [DOI] [PubMed] [Google Scholar]
- 13.Bello D, Redlich CA, Stowe MH, Sparer J, Woskie SR, Streicher RP, Hosgood HD, Liu Y. Ann Occup Hyg. 2008;52:117. doi: 10.1093/annhyg/mem066. [DOI] [PubMed] [Google Scholar]
- 14.Fent KW, Jayaraj K, Gold A, Ball LM, Nylander-French LA. Scand J Work Environ Health. 2006;32:225. doi: 10.5271/sjweh.1003. [DOI] [PubMed] [Google Scholar]
- 15.Fent KW, Trelles Gaines LG, Thomasen JM, Flack SL, Ding K, Herring AH, Whittaker SG, Nylander-French LA. Ann Occup Hyg. 2009;53:691. doi: 10.1093/annhyg/mep048. [DOI] [PMC free article] [PubMed] [Google Scholar]
- 16.Wisnewski AV, Srivastava R, Herick C, Xu L, Lemus R, Cain H, Magoski NM, Karol MH, Bottomly K, Redlich CA. Am J Respir Crit Care Med. 2000;162:2330. doi: 10.1164/ajrccm.162.6.2002086. [DOI] [PubMed] [Google Scholar]
- 17.Fent KW, Gaines LG, Thomasen JM, Flack SL, Ding K, Herring AH, Whittaker SG, Nylander-French LA. Ann Occup Hyg. 2009;53:677. doi: 10.1093/annhyg/mep046. [DOI] [PMC free article] [PubMed] [Google Scholar]
- 18.Fent KW, Jayaraj K, Ball LM, Nylander-French LA. J Environ Monit. 2008;10:500. doi: 10.1039/b715605g. [DOI] [PubMed] [Google Scholar]
- 19.Wisnewski AV, Lemus R, Karol MH, Redlich CA. J Allergy Clin Immunol. 1999;104:341. doi: 10.1016/s0091-6749(99)70377-5. [DOI] [PubMed] [Google Scholar]
- 20.Jin R, Day BW, Karol MH. Chem Res Toxicol. 1993;6:906. doi: 10.1021/tx00036a023. [DOI] [PubMed] [Google Scholar]
- 21.Butcher BT, Jones RN, O'Neil CE, Glindmeyer HW, Diem JE, Dharmarajan V, Weill H, Salvaggio JE. Am Rev Respir Dis. 1977;116:411. doi: 10.1164/arrd.1977.116.3.411. [DOI] [PubMed] [Google Scholar]
- 22.Wikman H, Piirila P, Rosenberg C, Luukkonen R, Kaaria K, Nordman H, Norppa H, Vainio H, Hirvonen A. Pharmacogenetics. 2002;12:227. doi: 10.1097/00008571-200107000-00007. [DOI] [PubMed] [Google Scholar]
- 23.Urlich H. Chemistry and technology of isocyanates. Wiley; West Sussex, UK: 1996. [Google Scholar]
- 24.Day BW, Jin R, Basalyga DM, Kramarik JA, Karol MH. Chem Res Toxicol. 1997;10:424. doi: 10.1021/tx960201+. [DOI] [PubMed] [Google Scholar]
- 25.Dalene M, Skarping G, Tinnerberg H. J Chromatogr B Biomed Appl. 1994;656:319. doi: 10.1016/0378-4347(94)00137-5. [DOI] [PubMed] [Google Scholar]
- 26.Skarping G, Dalene MD, Tinnerberg H. Analyst. 1994;119:2051. doi: 10.1039/an9941902051. [DOI] [PubMed] [Google Scholar]
- 27.Rosenberg C, Nikkila K, Henriks-Eckerman ML, Peltonen K, Engstrorm K. J Environ Monit. 2002;4:711. doi: 10.1039/b206340a. [DOI] [PubMed] [Google Scholar]
- 28.Sepai O, Henschler D, Sabbioni G. Carcinogenesis. 1995;16:2583. doi: 10.1093/carcin/16.10.2583. [DOI] [PubMed] [Google Scholar]
- 29.Sepai O, Schutze D, Heinrich U, Hoymann HG, Henschler D, Sabbioni G. Chem Biol Interact. 1995;97:185. doi: 10.1016/0009-2797(95)03615-s. [DOI] [PubMed] [Google Scholar]
- 30.Meilhoc E, Moutin MJ, Osborne HB. Biochem J. 1986;238:701. doi: 10.1042/bj2380701. [DOI] [PMC free article] [PubMed] [Google Scholar]
- 31.Brorson T, Skarping G, Sandstrom JF, Stenberg M. Int Arch Occup Environ Health. 1990;62:79. doi: 10.1007/BF00397852. [DOI] [PubMed] [Google Scholar]
- 32.Naik S, Bhattacharjya G, Talukdar B, Patel BK. Eur J Org Chem. 2004:1254. [Google Scholar]
- 33.Chipinda I, Stetson SJ, Depree GJ, Simoyi RH, Siegel PD. Chem Res Toxicol. 2006;19:341. doi: 10.1021/tx050311t. [DOI] [PubMed] [Google Scholar]
- 34.Bernstein JA. Toxicology. 1996;111:181. doi: 10.1016/0300-483x(96)03375-6. [DOI] [PubMed] [Google Scholar]
- 35.Pronk A, Preller L, Raulf-Heimsoth M, Jonkers IC, Lammers JW, Wouters IM, Doekes G, Wisnewski AV, Heederik D. Am J Respir Crit Care Med. 2007;176:1090. doi: 10.1164/rccm.200702-215OC. [DOI] [PMC free article] [PubMed] [Google Scholar]
- 36.Herrick CA, Xu L, Wisnewski AV, Das J, Redlich CA, Bottomly K. J Allergy Clin Immunol. 2002;109:873. doi: 10.1067/mai.2002.123533. [DOI] [PubMed] [Google Scholar]
- 37.Redlich CA, Karol MH, Graham C, Homer RJ, Holm CT, Wirth JA, Cullen MR. Scand J Work Environ Health. 1997;23:227. doi: 10.5271/sjweh.203. [DOI] [PubMed] [Google Scholar]
- 38.Wisnewski AV, Liu Q, Liu J, Redlich CA. Clin Exp Allergy. 2008;38:957. doi: 10.1111/j.1365-2222.2008.02982.x. [DOI] [PMC free article] [PubMed] [Google Scholar]


