Abstract
Otto Warburg's theory on the origins of cancer postulates that tumor cells have defects in mitochondrial oxidative phosphorylation and therefore rely on high levels of aerobic glycolysis as the major source of ATP to fuel cellular proliferation (the Warburg effect). This is in contrast to normal cells, which primarily utilize oxidative phosphorylation for growth and survival. Here we report that the major function of glucose metabolism for Kras-induced anchorage-independent growth, a hallmark of transformed cells, is to support the pentose phosphate pathway. The major function of glycolytic ATP is to support growth under hypoxic conditions. Glutamine conversion into the tricarboxylic acid cycle intermediate alpha-ketoglutarate through glutaminase and alanine aminotransferase is essential for Kras-induced anchorage-independent growth. Mitochondrial metabolism allows for the generation of reactive oxygen species (ROS) which are required for Kras-induced anchorage-independent growth through regulation of the ERK MAPK signaling pathway. We show that the major source of ROS generation required for anchorage-independent growth is the Qo site of mitochondrial complex III. Furthermore, disruption of mitochondrial function by loss of the mitochondrial transcription factor A (TFAM) gene reduced tumorigenesis in an oncogenic Kras-driven mouse model of lung cancer. These results demonstrate that mitochondrial metabolism and mitochondrial ROS generation are essential for Kras-induced cell proliferation and tumorigenesis.
Keywords: Warburg Effect, glutamine, glycolysis, lung cancer, complex III
In the 1920s, Otto Warburg observed that tumor slices have elevated levels of glucose consumption and lactate production in the presence of ample oxygen (termed the Warburg effect) (1). He later postulated that cancer originates from irreversible injury to respiration followed by an increase in glycolysis to replace ATP loss due to defective oxidative phosphorylation (2). According to Warburg, this metabolic shift from oxidative phosphorylation to glycolysis converts differentiated cells into undifferentiated cells that proliferate as cancer cells. Although the observation that tumor cells exhibit high levels of aerobic glycolysis has been corroborated, the role of mitochondria in tumor cells has been contentious (3). While multiple investigators have demonstrated that mitochondria are indeed functional in most tumor cells, some argue that decreases in mitochondrial metabolism and respiratory rate are essential for tumor cell proliferation (4). However, the only tumor cells shown to exhibit mitochondrial dysfunction are those that have mutations in the tricarboxylic acid (TCA) cycle enzymes succinate dehydrogenase (SDH) or fumarate hydratase (FH) (5). Furthermore, oncogene activation increases mitochondrial metabolism (6), correlating with metastatic potential (7).
An attractive model of tumor cell metabolism is that oncogene-induced transformation depends on elevated glycolysis for ATP synthesis and the diversion of glycolytic intermediates to the pentose phosphate pathway (8). Those intermediates are used to generate NADPH and ribose-5-phosphate for reductive biosynthesis reactions and nucleotide biosynthesis, respectively. Glycolysis generates ATP with lower efficiency but at a faster rate than oxidative phosphorylation (9). The increased production of ATP by glycolysis is postulated to provide metabolic advantage to proliferating cells, while the role of mitochondria has been restricted to providing TCA cycle intermediates as substrates for de novo synthesis of lipids and nonessential amino acids (10). Since Warburg's initial observation, much progress has been made in elucidating the metabolic reprogramming of tumor cells, however, the role of glucose metabolism and mitochondrial metabolism in regulating oncogene-induced tumorigenicity are not fully understood. In the present study, we utilized a combination of biochemical, pharmacological, and genetic techniques to dissect the role of glucose and mitochondrial metabolism in Kras-mediated tumorigenicity.
Results
The Pentose Phosphate Pathway, Not Glycolysis, Is Essential for Kras-Induced Growth Under Aerobic Conditions.
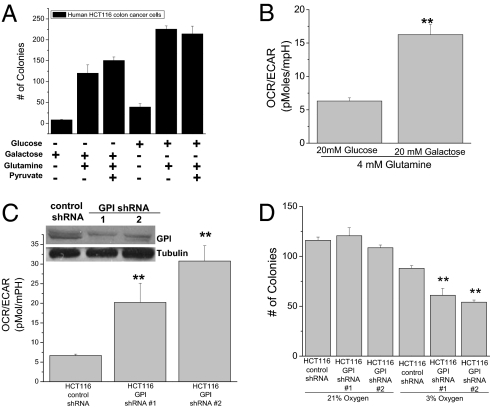
To test whether high levels of aerobic glycolysis are required for Kras-induced cell proliferation, we assessed the ability of KrasG13D driven HCT116 colon cancer cells to grow in soft agar in media containing galactose or glucose. Galactose enters glycolysis through the Leloir pathway, which occurs at a significantly lower rate than glucose entry into glycolysis (11). Cells grown in media containing glucose or galactose exhibited growth in soft agar (Fig. 1A). HCT116 cells grown in galactose displayed an increased ratio of oxygen consumption rate (OCR) to extracellular acidification rate (ECAR) (Fig. 1B). ECAR is an indirect measurement of lactate production. Similar results were observed with murine embryonic fibroblasts (MEFs) immortalized with a dominant negative p53 and transformed ectopically by either myristoylated AKT, HrasV12, KrasV12, or MCF-7 breast cancer cells (activated PI3K mutation) as well as MEFs isolated from mice containing one wild-type Kras allele and the other allele containing a Lox-STOP-Lox KrasG12 D (termed LSL-KrasG12D 3T3MEFs) (Fig. S1).
Fig. 1.
The pentose phosphate pathway, not glycolysis, is essential for Kras-induced growth under aerobic conditions. (A) Analysis of soft agar colonies of HCT116 cells, in media containing combinations of 20 mM glucose, 20 mM galactose, 4 mM glutamine, and 1 mM sodium pyruvate. (B) Ratio between oxygen consumption rate (OCR) and extracellular acidification rate (ECAR) of HCT116 cells incubated with 4 mM glutamine plus 20 mM glucose or galactose. Mean ± SE (n = 20). **P < 0.01 (C) Ratio between OCR and ECAR of control and GPI shRNA #1 and #2 in HCT116 cells. Mean ± SE (n = 20). **P < 0.01 (D) Analysis of soft agar colonies of HCT116 expressing control or GPI shRNAs grown under normoxia (21% O2) or hypoxia (3% O2). Bars represent the mean ± SE (n = 16). **P < 0.01.
Galactose mainly supports cell proliferation by entering into the pentose phosphate pathway and not glycolysis (11). To further dissect the role of glycolysis and the pentose phosphate pathway for growth, we reduced glucose 6-phosphate isomerase (GPI) protein levels by shRNA. Diminishing GPI allows the pentose phosphate pathway to proceed normally while compromising glycolysis. HCT116 cells infected with two different lentiviral GPI shRNA died in the presence of the mitochondrial inhibitor rotenone (Fig. S2A) and displayed an increased OCR to ECAR ratio, indicating a dependency on mitochondrial metabolism for survival (Fig. 1C). The total number of soft agar colonies did not differ between HCT116 cells expressing GPI shRNA or control shRNA under normoxic conditions; however, there was a noticeable difference in colony number under hypoxic conditions (Fig. 1D). A closer examination of the colony size under normoxia revealed that reducing GPI protein levels inhibited the ability of cells to grow in colonies to a size greater than 150 microns, the threshold at which cells encounter hypoxia (Fig. S2B). These results indicate that the major role of glucose metabolism for growth is to fuel the pentose phosphate pathway while the generation of glycolytic ATP is only necessary for growth under hypoxic conditions.
Glutamine Catabolism by the TCA Cycle Is Required for Oncogenic Kras-Induced Growth.
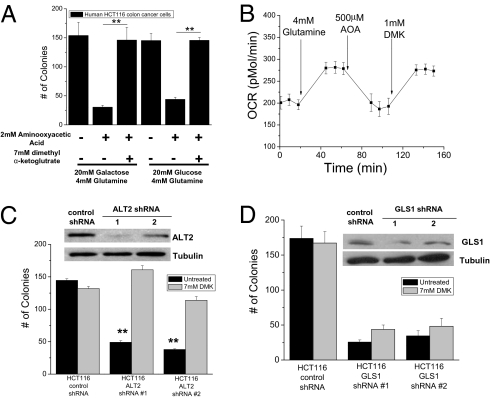
Previous studies suggest that Hela cells and Myc-overexpressing tumor cells require glutamine metabolism for cell growth and proliferation (12–15). Glutamine can be converted to glutamate by glutaminase. Subsequently, glutamate can enter the TCA cycle through its conversion into alpha-ketoglutarate by either aminotransferases or glutamate dehydrogenase. To determine whether glutamine entry into the TCA cycle is a general requirement for the growth of tumor cells, we utilized aminooxyacetic acid (AOA), a potent inhibitor of aminotransferase activity. Soft agar colony growth of HCT116 human colon cancer cells was inhibited in the presence of AOA, which was rescued with the addition of the cell permeable dimethyl α-ketoglutarate (DMK) (Fig. 2A). Similar results were observed in LSL-KrasG12D 3T3 MEFs and human MCF-7 breast cancer cells (Fig. S3 A and B). Glutamine addition to media stimulated oxygen consumption, which was inhibited by AOA and rescued by DMK (Fig. 2B). DMK did not further increase growth in the presence of glutamine indicating that DMK-induced colony growth was a specific rescue of AOA treatment (Fig. S3C). Glutamate conversion into alpha-ketoglutarate requires either pyruvate or oxaloacetate through the alanine or aspartate aminotransferases, respectively. We reasoned that pyruvate would be more abundant than oxaloacetate for carrying out the transamination reaction; thus, we tested whether diminishing mitochondrial alanine aminotransferase (ALT2) would attenuate anchorage-independent growth. Indeed, HCT116 cells expressing ALT2 shRNA had diminished colony growth compared to the control shRNA cells, an effect rescued by DMK (Fig. 2C). Interestingly, knockdown of glutaminase (GLS1) also decreased colony growth but was not effectively rescued by DMK (Fig. 2D). Glutamate, the product of GLS, is also required for generation of glutathione and NAPDH to provide redox balance (15). These data suggest that the ability of glutamine to fuel the TCA cycle through ALT2 and GLS1 is critical for anchorage-independent growth.
Fig. 2.
Glutamine catabolism by mitochondria is required for oncogenic Kras-induced anchorage-independent growth. (A) Analysis of soft agar colonies of HCT116 cells in media containing 4 mM glutamine with 20 mM glucose or 20 mM galactose in the presence of 2 mM aminooxyacetic acid (AOA) and 7 mM dimethyl α-ketoglutarate (DMK). Mean ± SE (n = 9). **P < 0.01. (B) Oxygen consumption rate (OCR) was measured in HCT116 cells incubated in basal media and subsequently exposed to glutamine, AOA, and DMK. (C) Analysis of soft agar colonies of HCT116 cells expressing control and alanine amiotransferase 2 (ALT2) shRNA #1 and #2 ± DMK or (D) control and glutaminase 1 (GLS1) shRNA #1 and #2 ± DMK. Bars represent the mean ± SE (n = 16 in C and n = 8 in D). **P < 0.01.
Mitochondria Derived Reactive Oxygen Species (ROS) Are Required for Cell Proliferation.
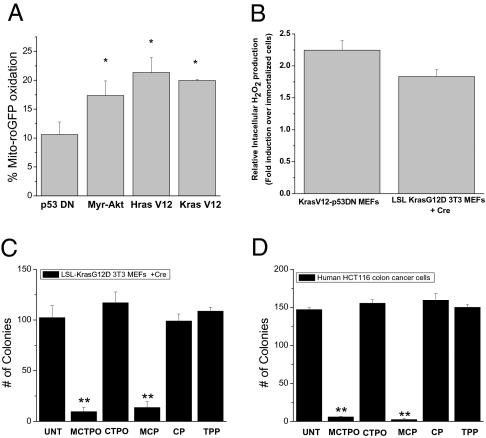
A consequence of mitochondrial metabolism is the generation of ROS by the electron transport chain. Previous reports indicate that cancer cells exhibit more oxidative stress than normal cells (16). Indeed, we observed an oncogene-induced increase in mitochondrial ROS as assessed by mitochondria-targeted redox sensitive GFP (mito-roGFP, Fig. 3A). This roGFP protein contains two surface-exposed cysteines that form a disulfide bond in the presence of an oxidant resulting in an increase in the excitation at 400 nm at the expense of the peak near 490 nm. These results were corroborated using Amplex Red, which detects intracellular H2O2 levels (Fig. 3B). We hypothesized that mitochondrial ROS are required to maintain oncogene-induced anchorage-independent growth. To test this, colony growth was evaluated in the presence of the mitochondria-targeted nitroxides, MCP and MCTPO, which act as superoxide dismutase mimetics and superoxide scavengers. These nitroxides are targeted to mitochondria by covalently coupling the nitroxide moiety to a triphenylphosphonium cation (TPP) (17). Cells treated with mito-nitroxides (MCP and MCTPO) demonstrated reduced colony growth as compared to control nitroxides (CTPO and CP), which were not targeted to the mitochondria, suggesting that mitochondria-derived ROS are critical for anchorage-independent growth (Fig. 3 C and D and Fig. S4 A–C). The antioxidants did not cause cell death (Fig. S4D).
Fig. 3.
Mitochondrial ROS are required for oncogene-induced anchorage-independent growth. (A) Levels of oxidized mito-roGFP in p53DN, Myr-Akt-p53DN, HrasV12-p53DN, and KrasV12-p53DN cells. Mean ± SE (n = 4). *P < 0.05; Statistical comparisons were made between p53DN cells and Myr-Akt, HrasV12, or KrasV12 cells. (B) Intracellular H2O2 levels were assessed by Amplex Red in cell lysates of p53DN, KrasV12-p53DN cells, LSL KrasG12D 3T3 ± Cre. Mean ± SE (n = 4). Data represented is KrasV12-p53DN cells/immortalized p53DN and LSLKrasG12D3T3 +Cre/immortalized LSLKrasG12D. Analysis of soft agar colonies of (C) LSL-Kras G12D, and (D) HCT116 cell lines treated with mitochondrial targeted antioxidants 1 μM MCTPO, 1 μM MCP, or the control compounds 1 μM CTPO, 1 μM CP, and 1 μM TPP. Mean ± SE (n = 9). **P < 0.01; Statistical comparisons are between MCTPO or MCP and TPP.
Mitochondrial ROS Regulate Cellular Proliferation Through ERK1/2.
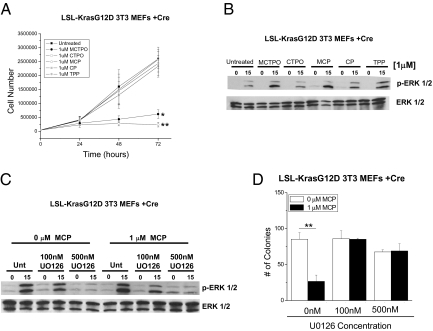
To determine whether mitochondrial ROS regulate cell proliferation, we assessed the ability of KrasV12-p53DN, HrasV12-p53DN, myr-Akt-p53DN MEFs, LSL-KrasG12D 3T3 MEFs, and HCT116 cells to proliferate following treatment with mito-targeted antioxidants. All cell lines showed a reduction in the rate of proliferation at 48-hours post-treatment suggesting that ablation of mitochondrial ROS by the mito-targeted antioxidants induced cell proliferation arrest (Fig. 4A and Fig. S5). The extracellular signal-regulated kinase (ERK1/2) MAP kinase pathway is an important regulator of proliferation. The ERK MAPKs are regulated by the upstream MEK kinase (MAPK kinase) and at low levels induce cellular proliferation but at high levels cause growth arrest (18). The mito-nitroxides, but not untargeted nitroxides, induced an increase in phosphorylated ERK 1/2 in tumor cells (Fig. 4B and Fig. S6 A and C). The MEK inhibitor U0126 decreased the phosphorylation of ERK1/2 to levels similar to cells incubated in the absence of mito-nitroxides (Fig. 4C and Fig. S6 B and D). Additionally, cells treated with the MEK inhibitor U0126 rescued soft agar colony formation in the presence of mito-nitroxides (Fig. 4D and Fig. S7). These data suggest that oncogene-induced mitochondrial ROS serve as signaling molecules to dampen the ERK1/2 MAPK pathway to levels that are compatible with cellular proliferation and subsequent anchorage-independent growth.
Fig. 4.
Mitochondrial ROS regulate anchorage-independent growth through the MAPK/ERK1/2 pathway. (A) Effects of mitochondrial targeted nitroxides and control compounds on LSL-Kras G12D 3T3 MEFs + Cre cellular proliferation at 24, 48, or 72 hours after treatment. *P < 0.05; **P < 0.01. Statistical comparisons are between MCTPO or MCP and TPP. (B) Western blot analysis of phosphorylated ERK1/2 and Total ERK in LSL-KrasG12D 3T3 MEFs cell lysates serum starved for 18 hours (0 time point) or after 15 min serum stimulation post-48-hours treatment with 1 μM MCTPO, 1 μM CTPO, 1 μM MCP, 1 μM CP, and 1 μM TPP. (C) Western blot analysis of phosphorylated ERK1/2 and Total ERK 48 hours after treatment with no drug or 1 μM MCP in the presence of either 0 nM, 100 nM, or 500 nM U0126. (D) Analysis of soft agar colonies of LSL-KrasG12D 3T3 MEFs treated with either 0 or 1 μM MCP in the presence of 0 nM, 100 nM, or 500 nM UO216. Mean ± SE (n = 9). **P < 0.01. Statistical comparison was made between cells treated with Mito CP and cells not treated with Mito CP.
Mitochondrial Complex III Regulates Anchorage Independent Growth Independently from Oxidative Phosphorylation.
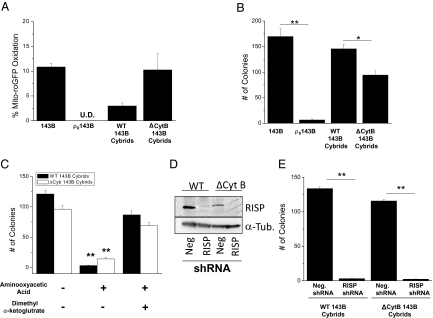
To genetically address the requirement of mitochondrial ROS for anchorage-independent growth, we utilized 143B osteosarcoma cells (oncogenic Kras mutation) that are depleted of mitochondrial DNA (ρ0 143B cells). These ρ0 cells were then reconstituted with either wild-type mitochondria or mitochondria containing a 4-bp mutation in the mitochondrial-encoded cytochrome b gene (wt or Δcytochrome b 143B cybrids). Both ρ0 cells and Δcytochrome b 143B cybrids are deficient in oxidative phosphorylation and did not survive in glucose-free media enriched with galactose (Fig. S8A). However, ρ0 143B cells cannot generate mitochondrial ROS, while the Δcytochrome b cybrids can generate superoxide at the Qo site of complex III (19). As predicted, the ρ0 143B cells had undetectable levels of mitochondrial ROS compared to Δcytochrome b cybrids as assessed by oxidation of the mito-roGFP probe (Fig. 5A). The ρ0 143B cells exhibited minimal growth in soft agar as compared to the Δcytochrome b 143B cybrids, highlighting the importance of mitochondrial ROS in tumor cell proliferation (Fig. 5B). The Δcytochrome b 143B cybrids had less growth in soft agar than the wild-type 143B cybrids, suggesting that a defect in oxidative phosphorylation also diminishes anchorage-independent growth. Wild-type cybrids and Δcytochrome b cybrids were both dependent on glutamine entry into the TCA cycle as AOA abolished soft agar colony formation (Fig. 5C). These results indicate that the Δcytochrome b cybrids still require glutamine catabolism by the TCA cycle even though they cannot generate ATP by oxidative phosphorylation.
Fig. 5.
Mitochondrial complex III generated ROS are required for anchorage-independent growth. (A) Levels of oxidized mito-roGFP in 143B cells, ρ°143B cells, wild-type 143B cybrids, and Δcytochrome b 143B cybrids. (B) Analysis of soft agar colonies of 143B, ρ0143B cells, wild-type cybrids and Δcytochrome b cybrids. Mean ± SE (n = 9). *P < 0.05; **P < 0.01. (C) Analysis of soft agar colonies of wild-type cybrids and Δcytochrome b cybrids treated with 2 mM aminooxyacetic acid (AOA) ± 7 mM dimethyl α-ketoglutarate (DMK). (D) Western blot analysis of RISP protein and (E) analysis of soft agar colonies of wild-type 143B cybrids and Δcytochrome b 143B cybrids stably infected with negative control shRNA or RISP shRNA. **P < 0.01.
The Δcytochrome b 143B cybrids have a disrupted Complex III, however there are residual levels of Rieske iron sulfur protein (RISP), a component required for ROS generation at the Qo site of complex III (20). In the absence of RISP, ROS are not generated at the Qo site of complex III (19). The wild-type 143B cybrids and Δcytochrome b 143B cybrids were stably infected with shRNA against the RISP or a negative control shRNA (Fig. 5D). In the absence of RISP, anchorage-independent growth was ablated in both wild-type 143B cybrids and Δcytochrome b 143B cybrids, indicating that the ROS generated from the Qo site of complex III is required for anchorage-independent growth (Fig. 5E). Similar results were obtained with a second shRNA against RISP (Fig. S8B).
Mitochondrial Metabolism Is Required for in Vivo Tumorigenesis.
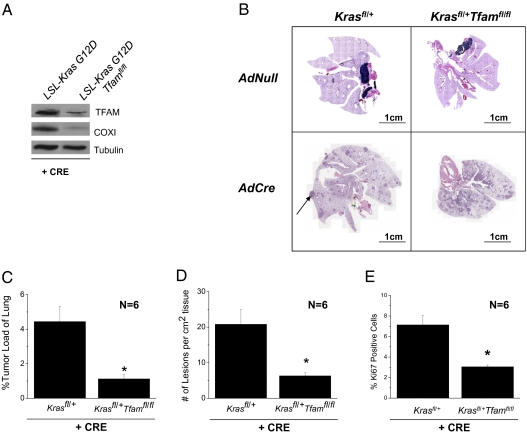
The inability of ρ0 cells to grow in an anchorage-independent manner suggests that mitochondrial function is crucial for tumor cell proliferation. To address whether loss of mitochondrial function in vivo impacts tumorigenesis, we crossed LSL-Kras G12D mice with mice harboring floxed alleles of mitochondrial transcription factor A (Tfam). TFAM is required for mitochondrial DNA replication and transcription and previous studies demonstrated that Tfam-null tissues are deficient in electron transport and oxidative phosphorylation (21). After crossing these animals, we verified that Cre recombinase reduced TFAM protein levels and the mitochondrial DNA encoded protein, cytochrome c oxidase subunit I (COXI) (Fig. 6A). The recombination frequency of LSL-KrasG12D allele was not influenced by the presence of TFAM floxed alleles (Fig. S9). Intratracheal adenoviral Cre-treated LSL-Kras G12D+/fl-Tfamfl/fl mice formed fewer lesions per unit area, had smaller tumors, and displayed fewer Ki67 positive cells compared to adenoviral Cre-treated LSL-Kras G12D+/fl mice (Fig. 6 B–E). This indicates that a functional mitochondrial electron transport chain is required for tumorigenesis.
Fig. 6.
Mitochondrial metabolism is required for oncogenic Kras-driven mouse lung adenocarcinoma. (A) Western blot analysis of TFAM, cytochrome c oxidase subunit I protein (COXI), and α-TUBULIN in lung lysates and (B) histology of LSL-Kras G12Dfl/+ and LSL-Kras G12Dfl/+ Tfamfl/fl lungs 12-weeks post treatment with intratracheal instillation of Cre-recombinase. (Scale bars, 1 cm.) (C and D) Tumor loads and number of lesions per area of lung tissue in LSL-Kras G12Dfl/+ and LSL-Kras G12Dfl/+ Tfamfl/fl mice. Bars represent the mean ± SE (n = 6 animals). *P < 0.05. (E) Ki67 staining (proliferative index) of the LSL-Kras G12Dfl/+ and LSL-Kras G12Dfl/+ Tfamfl/fl mice lungs. Bars represent the mean ± SE (n = 6 animals). *P < 0.05.
Discussion
Recent studies demonstrate that a gain of function in oncogenes, loss or mutation of tumor suppressors, and the activation of phosphoinositide 3-kinase (PI3K) are major regulators of the high levels of aerobic glycolysis observed in tumor cells (22). Our present studies suggest that this high glycolytic flux is required to provide continuous glycolytic intermediates for the pentose phosphate pathway in order to generate nucleotides and phospholipids for rapidly proliferating tumor cells. Our premise that enhanced aerobic glycolysis is more important for anabolic processes such as nucleotide and phospholipid synthesis, as opposed to the generation of ATP, is supported by the observation that diminishing GPI protein levels did not prevent colony growth under aerobic conditions. Loss of GPI should allow glucose-6-phosphate to fuel the pentose phosphate pathway but not glycolysis. These results are consistent with previous studies that demonstrate the low activity form of the pyruvate kinase M2 isoform (PKM2) directs glycolytic intermediates into nucleotide and phospholipid biosynthesis (23). Tumor cells express the PKM2 isoform and inhibition of PKM2 reduces xenograft tumor growth of human lung cancer cells (23). It is important to note that while aerobic glycolysis fuels the pentose phosphate pathway for normoxic cells, the major role of glycolysis in hypoxic cells is to generate ATP for survival. This premise is supported by our observation that diminishing GPI resulted in a decrease in colony growth under hypoxia. These results are consistent with previous studies that showed the inhibition of the glycolytic enzyme lactate dehydrogenase A (LDH-A) prevents anchorage-independent growth of Myc tumor cells and xenograft tumor formation of mouse mammary tumor cells by preventing the survival of these tumor cells under hypoxia (24, 25).
Previous studies indicate that cells overexpressing Myc utilize glutamine metabolism for their proliferation (13, 14). Myc represses microRNA mir23a/b, which allows for the expression of glutaminase (15). Our current results indicate that glutamine addiction is likely a general phenomenon as Ras-, Myc-, and AKT-dependent tumor cells require glutamine-fueled mitochondrial metabolism. Glutamine catabolism by the TCA cycle is essential for tumor cell growth and proliferation in the absence or presence of glucose. Glutamine is converted to glutamate by glutaminase, which can be converted to alpha-ketoglutarate by alanine or aspartate aminotransferases as well as glutamate dehydrogenase. The inhibition of mitochondrial alanine aminotransferase by shRNA prevented anchorage-independent growth in oncogenic Kras-transformed cells, which was rescued by cell permeable alpha-ketoglutarate. An important consequence of glutamine catabolism by the TCA cycle is the production of reducing equivalents for the generation of ROS by complex I, II, and III of the electron transport chain. Our data indicate that oncogenic Kras induced an increase in mitochondrial ROS to control cellular proliferation. These results are consistent with previous studies suggesting that ROS regulate cell cycle progression (26). We propose that oncogenes induce mitochondrial ROS to serve as signaling molecules to regulate cell proliferation.
The premise that ROS are required for tumor cell proliferation is further supported by our observations that cells deficient in mitochondrial DNA (ρ0cells) do not generate ROS nor grow in an anchorage-independent manner. By contrast, cells with a deletion in the mitochondrial DNA encoded cytochrome b gene were able to generate ROS and grow in an anchorage independent-manner. Both ρ0143B cells and cytochrome b null 143B cells are deficient in oxidative phosphorylation. Preventing the generation of ROS from complex III in wild-type or cytochrome b null cells by shRNA targeting of the complex III subunit RISP diminishes growth of cytochrome b null cells in soft agar. These results indicate that complex III-generated ROS are crucial to maintain the transformed cancer cell phenotype. The essential role of mitochondria in regulating tumorigenesis is further corroborated by our observation that loss of the TFAM protein, which is required to replicate and maintain mtDNA copy number, diminished tumorigenicity in an oncogenic Kras-driven mouse model of lung adenocarcinoma.
In summary, our data indicate that the majority of cancer cells have evolved to utilize glycolysis, pentose-phosphate pathway, and mitochondrial metabolism to provide the necessary resources for rapid cell proliferation. We suggest that the major role of aerobic glycolysis in cancer cells is likely to provide glycolytic intermediates to the pentose phosphate pathway for nucleotide and phospholipid synthesis, while glycolytic ATP generation is likely to be important for survival under hypoxic conditions. The glutamine-fueled TCA cycle results in generation of ATP, ROS, NADPH, amino acids, nucleotides, and lipids. We propose that feeding substrates to the TCA cycle through amino acids, as well as other sources such as fatty acid oxidation, is critical for oncogene-induced tumorigenicity. Deciphering the pathways that fuel the TCA cycle differentially in cancer cells versus normal cells will enable design of targeted therapies.
Methods
Full methods are available as SI Methods.
Anchorage-independent growth was assessed by plating cells in a two-layer agar system (Millipore), in which the final concentration of the bottom layer agarose was 0.8% and 0.4% for the top layer that contained the cells. The protocol for the use of mice was approved by the Animal Care and Use Committee at Northwestern University. LSL-Kras G12D mice are on a mixed B6/129 background and were obtained from National Cancer Institute Repository (Bethesda, MD). Tfam floxed mice are on a C57BL/6 background and were generated by Ozgene as previously described (21). We utilized littermate cohorts of Tfam floxed mice crossed to LSL-Kras G12D mice.
Supplementary Material
Acknowledgments
We grateful to Dr. Carlos Moraes and Dr. IFM de Coo for the cytochrome b mutant cells. We thank Dr. Gerry Shadel for the mouse TFAM antibody. This work was supported by the LUNGevity Foundation and a Consortium of Independent Lung Health Organizations convened by Respiratory Health Association of Metropolitan Chicago (to N.S.C.) and by National Institutes of Health Grants R01CA123067-04, ES015024 (to G.M.M.), ES013995 (to G.R.S.B.), P01HL071643 (to N.S.C., G.M.M. and G.R.S.B.), and CA125112 (to B.K.). F.W. and W.W. were supported by National Institute of Health predoctoral training Grant T32CA009560-22. R.H. was supported by a National Institute of Health postdoctoral training Grant T32CA070085-13.
Footnotes
The authors declare no conflict of interest.
This article is a PNAS Direct Submission.
This article contains supporting information online at www.pnas.org/lookup/suppl/doi:10.1073/pnas.1003428107/-/DCSupplemental.
References
- 1.Warburg O, Posener K, Negelein E. Uber den stoffwechsel der carcinomzelle. Biochem Z. 1924;152:309. [Google Scholar]
- 2.Warburg O. On the origin of cancer cells. Science (New York) 1956;123:309–314. doi: 10.1126/science.123.3191.309. [DOI] [PubMed] [Google Scholar]
- 3.Weinhouse S. On respiratory impairment in cancer cells. (Translated from eng) Science (New York) 1956;124:267–269. doi: 10.1126/science.124.3215.267. [DOI] [PubMed] [Google Scholar]
- 4.Denko NC. Hypoxia, HIF1 and glucose metabolism in the solid tumour. Natl Rev. 2008;8:705–713. doi: 10.1038/nrc2468. [DOI] [PubMed] [Google Scholar]
- 5.Gottlieb E, Tomlinson IP. Mitochondrial tumour suppressors: A genetic and biochemical update. Natl Rev. 2005;5:857–866. doi: 10.1038/nrc1737. [DOI] [PubMed] [Google Scholar]
- 6.Funes JM, et al. Transformation of human mesenchymal stem cells increases their dependency on oxidative phosphorylation for energy production. Proc Natl Acad Sci USA. 2007;104:6223–6228. doi: 10.1073/pnas.0700690104. [DOI] [PMC free article] [PubMed] [Google Scholar]
- 7.Mori S, et al. Anchorage-independent cell growth signature identifies tumors with metastatic potential. Oncogene. 2009;28:2796–2805. doi: 10.1038/onc.2009.139. [DOI] [PMC free article] [PubMed] [Google Scholar]
- 8.Jones RG, Thompson CB. Tumor suppressors and cell metabolism: A recipe for cancer growth. Genes Dev. 2009;23:537–548. doi: 10.1101/gad.1756509. [DOI] [PMC free article] [PubMed] [Google Scholar]
- 9.Pfeiffer T, Schuster S, Bonhoeffer S. Cooperation and competition in the evolution of ATP-producing pathways. Science. 2001;292:504–507. doi: 10.1126/science.1058079. [DOI] [PubMed] [Google Scholar]
- 10.DeBerardinis RJ, Lum JJ, Hatzivassiliou G, Thompson CB. The biology of cancer: Metabolic reprogramming fuels cell growth and proliferation. Cell Metab. 2008;7:11–20. doi: 10.1016/j.cmet.2007.10.002. [DOI] [PubMed] [Google Scholar]
- 11.Bustamante E, Pedersen PL. High aerobic glycolysis of rat hepatoma cells in culture: Role of mitochondrial hexokinase. Proc Natl Acad Sci USA. 1977;74:3735–3739. doi: 10.1073/pnas.74.9.3735. [DOI] [PMC free article] [PubMed] [Google Scholar]
- 12.Reitzer LJ, Wice BM, Kennell D. Evidence that glutamine, not sugar, is the major energy source for cultured HeLa cells. J Biol Chem. 1979;254:2669–2676. [PubMed] [Google Scholar]
- 13.DeBerardinis RJ, et al. Beyond aerobic glycolysis: Transformed cells can engage in glutamine metabolism that exceeds the requirement for protein and nucleotide synthesis. Proc Natl Acad Sci USA. 2007;104:19345–19350. doi: 10.1073/pnas.0709747104. [DOI] [PMC free article] [PubMed] [Google Scholar]
- 14.Wise DR, et al. Myc regulates a transcriptional program that stimulates mitochondrial glutaminolysis and leads to glutamine addiction. Proc Natl Acad Sci USA. 2008;105:18782–18787. doi: 10.1073/pnas.0810199105. [DOI] [PMC free article] [PubMed] [Google Scholar]
- 15.Gao P, et al. c-Myc suppression of miR-23a/b enhances mitochondrial glutaminase expression and glutamine metabolism. Nature. 2009;458:762–765. doi: 10.1038/nature07823. [DOI] [PMC free article] [PubMed] [Google Scholar]
- 16.Trachootham D, et al. Selective killing of oncogenically transformed cells through a ROS-mediated mechanism by beta-phenylethyl isothiocyanate. Cancer Cell. 2006;10:241–252. doi: 10.1016/j.ccr.2006.08.009. [DOI] [PubMed] [Google Scholar]
- 17.Dhanasekaran A, et al. Mitochondria superoxide dismutase mimetic inhibits peroxide-induced oxidative damage and apoptosis: Role of mitochondrial superoxide. Free Radic Biol Med. 2005;39:567–583. doi: 10.1016/j.freeradbiomed.2005.04.016. [DOI] [PubMed] [Google Scholar]
- 18.Meloche S, Pouysségur J. The ERK1/2 mitogen-activated protein kinase pathway as a master regulator of the G1- to S-phase transition. Oncogene. 2007;26:3227–3239. doi: 10.1038/sj.onc.1210414. [DOI] [PubMed] [Google Scholar]
- 19.Bell EL, et al. The Qo site of the mitochondrial complex III is required for the transduction of hypoxic signaling via reactive oxygen species production. J Cell Biol. 2007;177:1029–1036. doi: 10.1083/jcb.200609074. [DOI] [PMC free article] [PubMed] [Google Scholar]
- 20.Rana M, de Coo I, Diaz F, Smeets H, Moraes CT. An out-of-frame cytochrome b gene deletion from a patient with parkinsonism is associated with impaired complex III assembly and an increase in free radical production. Ann Neurol. 2000;48:774–781. [PubMed] [Google Scholar]
- 21.Larsson NG, et al. Mitochondrial transcription factor A is necessary for mtDNA maintenance and embryogenesis in mice. Nat Genet. 1998;18:231–236. doi: 10.1038/ng0398-231. [DOI] [PubMed] [Google Scholar]
- 22.Vander Heiden MG, Cantley LC, Thompson CB. Understanding the Warburg effect: The metabolic requirements of cell proliferation. Science. 2009;324:1029–1033. doi: 10.1126/science.1160809. [DOI] [PMC free article] [PubMed] [Google Scholar]
- 23.Christofk HR, et al. The M2 splice isoform of pyruvate kinase is important for cancer metabolism and tumour growth. Nature. 2008;452:230–233. doi: 10.1038/nature06734. [DOI] [PubMed] [Google Scholar]
- 24.Shim H, et al. c-Myc transactivation of LDH-A: Implications for tumor metabolism and growth. Proc Natl Acad Sci USA. 1997;94:6658–6663. doi: 10.1073/pnas.94.13.6658. [DOI] [PMC free article] [PubMed] [Google Scholar]
- 25.Fantin VR, St-Pierre J, Leder P. Attenuation of LDH-A expression uncovers a link between glycolysis, mitochondrial physiology, and tumor maintenance. Cancer Cell. 2006;9:425–434. doi: 10.1016/j.ccr.2006.04.023. [DOI] [PubMed] [Google Scholar]
- 26.Havens CG, Ho A, Yoshioka N, Dowdy SF. Regulation of late G1/S phase transition and APC Cdh1 by reactive oxygen species. Mol Cell Biol. 2006;26:4701–4711. doi: 10.1128/MCB.00303-06. [DOI] [PMC free article] [PubMed] [Google Scholar]
Associated Data
This section collects any data citations, data availability statements, or supplementary materials included in this article.


