

Abstract
Two contrasting theories have emerged that attempt to describe T-cell ligand potency, one based on the t1/2 of the interaction and the other based on the equilibrium affinity (KD). Here, we have identified and studied an extensive set of T-cell receptor (TCR)-peptide-MHC (pMHC) interactions for CD4+ cells that have differential KDs and kinetics of binding. Our data indicate that ligands with a short t1/2 can be highly stimulatory if they have fast on-rates. Simple models suggest these fast kinetic ligands are stimulatory because the pMHCs bind and rebind the same TCR several times. Rebinding occurs when the TCR-pMHC on-rate outcompetes TCR-pMHC diffusion within the cell membrane, creating an aggregate t1/2 (ta) that can be significantly longer than a single TCR-pMHC encounter. Accounting for ta, ligand potency is KD-based when ligands have fast on-rates (kon) and t1/2-dependent when they have slow kon. Thus, TCR-pMHC kon allow high-affinity short t1/2 ligands to follow a kinetic proofreading model.
Keywords: affinity, kinetic proofreading, MHC, rebinding, T cell receptor
T cell receptors (TCRs) expressed on T cells bind host MHC proteins presenting both self- and foreign pathogen-derived peptides (pMHCs). Depending on the signal emanating from these interactions, diverse biological outcomes ensue. In the thymus, these TCR-pMHC-mediated signals shape the specificity of the mature T-cell repertoire and prevent overtly self-reactive T cells from escaping (1). In the periphery, naive T cells require continual TCR engagement with self-pMHC complexes to receive a homeostatic survival signal, whereas engagements with foreign peptides induce rapid T-cell division and the acquisition of effector functions (2). How T cells interpret the interaction between their TCR and pMHC ligands leading to these different biological outcomes is greatly debated.
Two competing models of T-cell activation have been proposed, with ligand potency being a function of TCR-pMHC equilibrium affinity (KD) (3–7) or t1/2 (8–11). Evidence supporting KD-based receptor occupancy models of TCR signaling comes from sets of ligands that show a correlation between the KD and ligand potency (3, 5) and from the fact that ligands induce qualitatively distinct biological outcomes depending on their concentration (12).
In sharp contrast to receptor occupancy models, t1/2-based kinetic proofreading models hypothesize that the TCR must be engaged long enough to complete a series of signaling events, including coreceptor recruitment and TCR phosphorylation (13). Increases in the t1/2 of the TCR-pMHC engagement raise the probability that any single TCR-pMHC engagement will surpass the threshold amount of time required to initiate T-cell activation (14). Recently, this threshold amount of time has been predicted to be at least 2 s (9, 15). Whether there is, in addition, an optimal t1/2 that balances these kinetic proofreading requirements and the serial triggering of TCRs has been debated (16, 17).
Further evidence supporting t1/2-based kinetic proofreading models arises from the discovery of antagonist pMHC ligands (18). TCR antagonists induce partial but not complete phosphorylation of the TCR complex and fail to activate T cells fully at any ligand concentration (18). The subsequent discovery that antagonist ligands bind TCRs with a shorter t1/2 than stimulatory agonist-pMHC complexes further suggests that activating ligands must engage a specific TCR for a long enough period to allow a series of signaling events to occur (19, 20).
As compelling as the arguments are for t1/2 models of T-cell activation, discoveries of highly potent T-cell ligands with a short t1/2 suggest that T-cell activation may not be solely dependent on the dwell time (4–6, 21, 22). In an attempt to reconcile why neither KD nor t1/2 fully predicts ligand potency, we have identified low-, medium-, and high-potency T-cell ligands that have medium and fast binding kinetics. The potency of these ligands fails to be described by either a KD or t1/2-based model. By mathematically modeling the biophysical mechanisms leading to T-cell activation using standard assumptions, our results indicate that fast kon allow an individual TCR to bind and rebind rapidly to the same pMHC several times before diffusing away. The rebindings lead to an aggregate t1/2 (ta) that can be significantly longer than individual TCR-pMHC interactions. Importantly, ligand potency correlates closely with this ta regardless of whether the ligands have fast or slow kon or t1/2s. These findings demonstrate that KD and t1/2 models of T-cell activation are not mutually exclusive, because both emerge from a ta model. In particular, the ta depends on the t1/2 or KD alone when kon are low or high, respectively. The ta allows strong KD/fast-binding kinetic ligands to follow a kinetic proofreading model of activation.
Results
Identification of High, Medium, and Low KD TCR–pMHC Interactions with Fast Rates of Association and Disassociation.
During our previous study of TCRs specific for IAb/3K, we noticed that several of these TCRs bound IAb/3K with a strong KD using very fast binding kinetics (22, 23). However, because some of the koff were exceptionally fast, with loss of all specific binding for some occurring in less than 1 s, the original measurement had a significant error range. Using surface plasmon resonance (SPR) focusing on obtaining TCR-pMHC disassociation rates, we measured the binding kinetics of the B3K506 and B3K508 TCRs interacting with the previously reported and additional IAb/3K altered peptide ligands (APLs) (Fig. 1).
Fig. 1.

Release of soluble IAb/3K and APLs from immobilized B3K506 or B3K508 TCR, monitored SPR. Soluble IAb/3K, P5R, P8R, or P-1A (A); P8A, P5Q, or P-1K loaded onto B3K506 TCRs (B); or IAb/3K, P5R, or P2A loaded onto B3K508 TCRs (C) was allowed to disassociate for 60 s at a flow rate of 20 μL/min at 25 °C. Data were collected at 0.2-s intervals and fit to a 1:1 Langmuir binding model to determine the dissociation rate (koff) and t1/2 of the MHC/TCR complex. Curves are examples of three independent experiments.
Although the B3K506 and B3K508 TCRs interact with the IAb/3K complex with a conventional KD for agonist ligands (7 μM for the B3K506 and 29 μM for the B3K508), the binding kinetics of the interaction of the B3K506 TCR with IAb/3K are extremely fast: kon = 101,918/M·s and koff = 0.7/s, leading to a t1/2 of 0.9 s (Fig. S1 and Table S1). The KDs of other B3K506 and B3K508 TCR ligands range from 7–175 μM, all with fast or medium binding kinetics.
B3K506 and B3K508 CD4 T Cells Proliferate in Response to High, Medium, and Low KD Ligands with a Very Short t1/2.
To determine the potency of high, medium, and low KD ligands with differing binding kinetics, mature CD4 T cells from B3K506 and B3K508 Rag1−/− TCR transgenic (Tg) mice were incubated with titrating concentrations of peptides and assessed for proliferation (Fig. 2). Because the peptides with a KD or t1/2 beyond the SPR detection limit failed to induce significant activation, we do not consider them in our subsequent analysis. Of critical importance, except for a 2-fold increase in binding by the 3K P2A peptide to IAb, the peptides all bind similarly to IAb proteins (24). Furthermore, mature B3K506 and B3K508 CD4 T cells are equally sensitive to anti-CD3-mediated T-cell signaling, suggesting that the responses of these different T cells to stimulatory ligands can be directly compared (Fig. S2). Our data confirm that fast kinetic ligands can signal, suggesting that the 2-s limit on t1/2 is not absolute. Notably, the B3K506 undergoes proliferation at submicromolar peptide concentrations by the 3K, P5R, P8R, and P-1A ligands (t1/2 = 0.9, 0.9, 0.8, and 0.3 s, respectively) (Table S1).
Fig. 2.

Activation of 3K-reactive T cells to differing KD ligands. B3K506 (A) and B3K508 (B) T cells proliferate when challenged with 3K and APLs. 3K APLs are listed next to each panel by decreasing KD. Data are representative of at least three independent experiments.
Some T-cell ligands with a shorter t1/2 than the immunizing ligand can induce superagonist or partial T-cell effector functions if the TCR complex is not efficiently ubiquitinated (18, 25). To determine whether B3K506 and B3K508 T cells undergo complete activation in response to fast kinetic ligands, we chose two additional cellular functions to explore: (i) ligand-induced TCR down-regulation as a measure of receptor phosphorylation, ubiquitination, and degradation by Cbl-b (26) and (ii) cytokine production by T cells. Consistent with inducing complete phosphorylation of the TCR complex and T-cell activation, fast kinetic ligands induce TCR down-regulation and TNF-α production (Fig. S3 and Table S1).
Ligand Potency of 3K or APLs Fails to Obey Straightforward KD or t1/2 Model.
Individually, ligand potency for the B3K506 or B3K508 T cells loosely follows the overall trend of both KD- and t1/2-based models. However, when B3K506 and B3K508 T-cell activation data are compared, neither model suffices (Fig. 3 and Table S1). In regard to KD, the B3K508 T cells are hyperresponsive. For example, the 3K ligand induces proliferation of B3K506 and B3K508 T cells at a similar nanomolar range concentration, despite having significantly different KDs (7 vs. 29 μM). In another example, the B3K506 TCR binds IAb/P-1A (26 μM) with a similar KD as the B3K508 TCR binding IAb/3K (29 μM), yet the B3K506 T cells proliferate at an EC50 that is 23-fold less than that of the B3K508 T cells. A failure of KD to define the ligand potency is further apparent when additional 3K APLs are tested (Fig. 3A and Table S1).
Fig. 3.

Failure of KD or t1/2-based models to predict ligand potency. EC50 values, based on proliferation, are shown with respect to KA (A) and t1/2 (B). Data points are labeled by T cell, B3K506 (squares) or B3K508 (circles) and grouped by ligand potency: highest (black), intermediate (gray), and lowest (white). Specific TCR-pMHC pairs are listed to the right, ordered according to EC50. The EC50 values are averaged over three measurements.
In reverse correlation from KD, ligand potency does not correlate with t1/2 because the B3K506 T cells are hyperresponsive. The 3K ligand induces similar proliferation of the B3K506 T cells (t1/2 = 0.9 s) as the B3K508 T cells (t1/2 = 2.2 s) (Table S1). In addition, the P5R ligand is significantly less potent in activating the B3K508 T cells than the 3K ligand is in activating the B3K506 T cells, despite having a similar t1/2 (0.7 and 0.9 s, respectively). Multiple discrepancies can be observed when comparing other 3K APLs (Fig. 3B and Table S1). The finding that each T cell in isolation loosely follows both KD- and t1/2-based models appears to be an artifact of limited variation in the kinetics among the ligands for each T cell. A failure of KD or t1/2 to predict ligand potency is true for cytokine production as well, suggesting that the proliferation response is not anomalous (Fig. S3 and Table S1).
Consistently, activating ligands for B3K506 T cells use a fast kon or strong KD to compensate for a short t1/2. (Because there is a simple relation among them, only two of the three parameters describing the interaction are independent.) Vice versa, B3K508 T cells compensate for a weak KD by engaging IAb/3K ligands for a longer t1/2. These results suggest that ligand potency is determined by an interplay between the TCR-pMHC kon and t1/2 (or KD and t1/2) in a way that allows for enhanced signaling by fast kinetic ligands.
Does a Combined KD/t1/2 Model or Serial Triggering Predict T-Cell Ligand Potency?
In an attempt to reconcile how the interplay of KD and binding kinetics influences T-cell activation, we evaluated whether straightforward merging of the two predicts ligand potency. A combined KD and t1/2 model suggests that increasing the frequency or total number of TCRs engaged by pMHCs would stochastically result in an increase in the number of uncharacteristically long TCR-pMHC interactions. To test this, we identified the change in receptor occupancy required for a strong KD fast kinetic ligand to be bound to an equal number of TCRs, on average, for at least 2 s as compared with a medium kinetic medium KD ligand.
To approximate how frequently each pMHC ligand is bound to a TCR, we assume that a quasiequilibrium between TCRs and pMHCs occurs on the time scale of cell-cell contact and that TCRs are far in excess of the relevant pMHCs. The probability that a pMHC is bound to a TCR then depends on the equilibrium association affinity (KA) through a simple saturation curve (3):
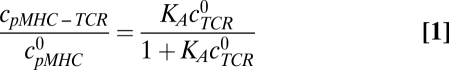 |
The parameter  denotes the concentration of pMHCs on the antigen presenting cell (APC),
  denotes the concentration of TCRs in the interface, and cpMHC-TCR denotes the concentration of bound pMHC.
  was estimated to be 20 TCRs per square micrometer (10,000 TCRs per T cell per 500-μm2 surface area of a T cell; SI Text). Within TCR islands,
  can be locally much higher (80–430 per square micrometer) (27); however, increasing this value had little effect on our results. To convert the measured KA of the TCR-pMHC pair in solution to KA when the TCRs and pMHCs are membrane-bound, we have used a confinement length measured for the 2B4 TCR interacting with the MCC88-103 ligand (1.2 nm, corresponding to a conversion factor of 0.262 nm) (8).
The TCR-pMHC saturation curve from Eq. 1 contains a threshold KD, K*, above which pMHC ligands are bound at least 50% of the time. Using the above approximations, K* is 130 μM and pMHC ligands with a 43-μM KD are bound 75% of the time (Fig. 4). These values mirror measurements made by Grakoui et al. (8), in which the majority of a 60-μM KD pMHC ligand was bound to a TCR when located within the interface of T cells and APCs. As a result of ligand saturation, strengthening KD above 100 μM has only a modest effect on the overall frequency of TCRs bound to pMHCs. This saturation curve can be used to show that changes in TCR-pMHC occupancy do not describe ligand potency (SI Text).
Fig. 4.

Receptor occupancy depends only weakly on KD for pMHC ligands with a KD stronger than 130 μM. The receptor occupancy predicted by Eq. 1 is plotted, according to the parameter estimates in the text, on a scale that is linear in KA (1/KD). The predictions for the actual pMHC-TCR pairs in our experiments are superimposed on the plot (circles), colored (black, gray, or white) according to their actual activity as described in the legend for Fig. 3.
By comparing ligands with similar EC50s of proliferation yet different t1/2s, we tested whether a merged KD/t1/2 model describes ligand potency. Specifically, the tests evaluate whether a stronger KD for the B3K506 TCR engaging the pMHC generates enough additional bindings to overcome the lower probability of the bindings being long-lived. One comparison is the B3K506 TCR interacting with 3K/P-1A peptide (KD = 26 μM, t1/2 = 0.3 s, EC50 = 9 nM) and the B3K508 TCR interacting with the 3K/P5R peptide (KD = 93 μM, t1/2 = 0.7 s, EC50 = 15 nM). Assuming that TCRs bind pMHCs with exponentially distributed dwell times, the B3K506 TCR would have to bind 26-fold more IAb/P-1A ligand than the B3K508 TCR binding IAb/P5R to generate an equal number of 2-s engagements. However, the 3.6-fold difference in KD between the two TCR-pMHC pairs leads to only a 1.5-fold difference in receptor occupancy. The effect is qualitatively similar for other comparisons (Fig. S4A) and is largely robust to assumptions about the parameters (SI Text). Thus, a merged KD/t1/2 model does not properly account for ligand potency. Based on similar reasoning, the effects of serial triggering cannot contribute significantly to ligand potency (Fig. S4 B and C and SI Text). It appears that the roles of the kon and KD in our data are not to increase the number of bindings, either at any given time (receptor occupancy) or over time (serial triggering).
Could Rebinding of TCRs to pMHCs Expand the Dwell Time for Fast Kinetic Ligands?
The failure of KD, t1/2, or serial triggering models indicates that other mechanisms must underlie ligand potency. The hypothesis of serial triggering, that individual pMHCs can sequentially bind multiple TCRs, led us to wonder whether a pMHC can bind multiple times to the same TCR. The ability of a receptor/ligand pair to associate, disassociate, and reassociate in a finite amount of time before complete disengagement is termed “rebinding.” Although TCR-pMHC interactions are usually thought of as single binding events, it is theoretically possible that ligands with fast kon may be able to rebind TCRs (28), especially because they are bound on membranes on which diffusivities are typically slower than in solution. If it occurred, TCR-pMHC rebinding would generate an aggregate dwell time (ta) of interaction, assuming that the rebindings occur faster than the TCR signaling complex disassembles.
To investigate whether TCR-pMHC rebindings are plausible, we have followed an extensive set of work analyzing diffusion-influenced reactions (29, 30). Our approach has been to apply the particular estimate of the ta, including rebindings, as provided by Bell (31), because of its simplicity and to suggest that the qualitative results are robust to the choice of model (see below and SI Text). In applying Bell's model (31), we assume that pMHCs and TCRs move purely diffusively on flat stiff membranes. Neglecting membrane forces is potentially in conflict with emerging work indicating the role of the actin cytoskeleton in breaking TCR-pMHC bonds, decreasing their t1/2 (32). However, when kon are fast enough for rebinding to occur, they happen very quickly; thus, it is unclear how much membrane forces could intervene.
The model also assumes that all rebindings occur at the same rate, which neglects any stabilization of binding that may be provided by coreceptors. Stabilization would have the effect of increasing the propensity of rebinding. Furthermore, the model counts only those rebindings that occur almost immediately, before the TCR and pMHC separate by more than a molecular length scale (e.g., 100 Å), on the order of 1 ms using the parameters below. Although the molecular details of TCR activation are not entirely understood (33, 34), TCR activation is not expected to be appreciably reversed on such short time scales.
Within this framework, Bell's result (31) for the total dwell time, summing the duration of any rebindings that occur, is:
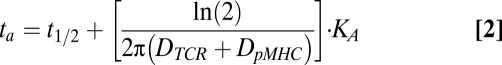 |
The parameters  and
and  represent the diffusivities of TCR and pMHC, respectively. From Bell's result (31), it can be seen that the ta is dependent on the individual t1/2 and KD. The first term in Eq. 2 accounts for the duration of the first binding, whereas the second affinity-dependent term accounts for any subsequent rebindings. Noting that every individual binding event lasts, on average, as long as any other, the expected number of rebindings between a particular pMHC-TCR pair is:
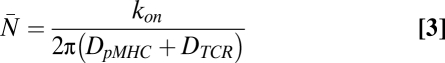 |
The parameter kon denotes the on-rate of the pair on the membrane. The system has qualitatively different dependence on t1/2 and KD when kon are small and large. When kon are fast relative to the diffusion rates, pMHC binds and rebinds the same TCR many times, reaching a quasiequilibrium before diffusing away. As a result, the KD dominates the duration of the interaction when kon are high. However, when kon are slow, srebinding does not occur and t1/2 dominates. Because Eq. 2 can be independently motivated by simple arguments such as these, it is qualitatively robust to the choice of model (SI Text).
More generally, Eq. 3 suggests that there is a threshold kon above which rebindings are relevant:
Whenever the kon exceeds this threshold (Eq. 4; also known as the diffusion-limited rate), at least one rebinding is expected to occur. Importantly, the specific parameter values are important only insofar as they influence this threshold and not the underlying biophysical event (Figs. S5 and S6).
Rebinding of TCRs to pMHCs Uniquely Explains How Fast Kinetic Ligands Induce T-Cell Activation.
To evaluate whether rebinding could have an impact on the dwell time of B3K506 or B3K508 TCRs engaging pMHC ligands, we applied Eq. 2 to our dataset. The diffusivities for a TCR and pMHC were estimated at 0.04 and 0.02 μm2/s, respectively, corresponding to midrange measured values (SI Text). On-rates measured using SPR were converted to kon on the membrane by assuming (i) that koff of membrane-bound TCRs binding pMHCs are identical to SPR measurements and (ii) that the KDs of membrane-bound TCRs engaging pMHCs are proportional to SPR-measured affinities, as done in our analysis of receptor occupancy. Because of limited data, it is generally difficult to convert SPR-measured kon directly to kon on the membrane (35, 36). We discuss sensitivity to the assumptions in SI Text.
Using these parameter values, rebinding likely occurs for TCR-pMHC pairs with fast binding kinetics (Fig. 5). Specifically, this initial model predicts that the threshold on-rate for rebinding is 60,000/M·s. As a result, the expected number of rebindings increases from almost none to 1.7 as the on-rate increases in our sample from 11,000/M·s to 102,000/M·s. Because T-cell activity is generally thought to be very sensitive to t1/2, a factor of 2 or 3 can be important. When rebindings are accounted for, the highly potent B3K506 T-cell ligands 3K, P5R, and P8R change from a t1/2 of 0.9 or 0.8 s to tas of 2.7, 1.9, and 1.8 s and the medium potent P-1A ligand converts from a t1/2 of 0.27 s to a ta of 0.72 s. Importantly, the ta is significantly better at predicting ligand potency than the KD or t1/2 (Fig. 6C and Figs. S4, S7, and S8).
Fig. 5.

Fast kon lead to rebinding. (A) Average number of rebindings predicted by Eq. 3 is plotted vs. the kon. The threshold for rebinding, kon*, separates pairs expected to rebind at least once from those that rarely rebind. (B) Probability of zero, one, two, three, or more than three rebindings between TCRs and pMHCs, according to their on-rate, as predicted from Eq. 2 (SI Text).
Fig. 6.

The ta is the best predictor of ligand potency for 3K-reactive T cells. EC50 values, based on proliferation, are shown with respect to KD (A), t1/2 (B), and ta (C), with the rebinding threshold set at 60,000/M·s, and (D) ta, with rebinding threshold set at 45,000/M·s.
Within the dataset, two groups of high- or medium-potency ligands arise from different TCR-pMHC binding parameters (Table S1). Using these groups, the competing models can be quantitatively evaluated. The four high-potency ligands (3K, P5R, and P8R binding the B3K506 TCR and 3K binding the B3K508 TCR) have KDs and t1/2s that vary widely by factors of 4.0 and 2.7, but tas that vary only by a factor of 1.5 (Fig. 6C). The two ligands in the second most potent group (B3K506 TCR binding P2A and B3K508 TCR binding P5R) have KDs and t1/2s that vary by factors of 3.6 and 2.6, respectively, but tas that are almost identical, varying only by a factor of 1.1.
Although our ta model was generated without empirically fitting the data, our estimate for the rebinding threshold, 60,000/M·s, is near the best fit for minimizing the variation in the tas of the most potent group of ligands (Fig. S5). Quite similarly, for the medium-potent ligands, the best-fit threshold is 45,000/M·s (Fig. 6D). Convergence of the ta model with empirical data suggests that the assumptions and underlying biophysical process are correct.
Discussion
Binding of two proteins is governed by the KD, kon, and t1/2, any two of which suffice to describe the interaction because the three are simply related. Although ligand potency could be dependent on each of these binding characteristics, research over the past two decades has suggested that only the KD or t1/2 matters. Mechanistically, these two mutually exclusive models have been interpreted to mean that T cells are either (i) sensitive to the number of TCRs simultaneously bound to pMHC (3–6) or (ii) sensitive to ligands that produce a long enough interaction to phosphorylate the TCR complex fully (8–11, 13). In seeming contradiction to both theories, data presented here suggest that neither the KD nor t1/2 determines the potency of T-cell ligands.
A plethora of data suggests that T cells are increasingly sensitive to long-lived TCR-pMHC engagements, with a t1/2 of 2 s being near the shortest allowable time (9, 15). Additionally, T-cell responses are dependent on ligand concentration, suggesting that T cells are also responsive to the frequency of these long-lived bonds. With this as a starting point, we asked how changes in the kon or KD might allow T cells to be equally reactive to ligands with a different t1/2. The IAb/3K model system is particularly well suited for this analysis because each of the 3K APLs binds IAb similarly and a relatively large number of TCR-IAb/3K APL pairs contain several that have similar potency, although using different KDs and binding kinetics. These controlled combinations of T cells and pMHC ligands allowed a direct comparison of the different theories of T-cell activation.
Because high-potency T-cell ligands with short t1/2s all have fast kon, we hypothesized that TCR-pMHC interactions may be influenced by diffusion rates. Although rebinding is potentially relevant for any binding event, it will be less important for cytosolic reactions because diffusivities in the cytoplasm are relatively high (31). However, when both the receptor and ligand are anchored on membranes, the rates of diffusion are drastically reduced. A recent study of the interaction between membrane-bound CD2 and CD58 using fluorescence recovery after photobleaching (FRAP) suggests that the fast-binding pair may rebind 100 times before separating, significantly increasing the duration of the bonds (37) and potentially explaining the pair's physiological activity (38).
Modeling TCR-pMHC interactions when both are membrane-bound shows that fast kon allow rebinding to occur. Depending on the kon, this effect can greatly extend bond durations, allowing medium-potency ligands with measured t1/2s of 0.3 and 0.7 s to generate a ta near 1 s. As an independent example, the lymphocytic choriomeningitis virus-specific P14 TCR has been shown to bind its cognate H-2Db-gp33 ligand with a low t1/2 of 0.7 s (21). Because of a fast kon of 400,000/M·s, our rebinding model predicts that the P14 TCR would have a ta of 5.5 s, which is fully consistent with kinetic proofreading models of activation.
Most importantly, a rebinding-mediated ta uniquely predicts ligand potency for B3K506 and B3K508 T cells (Fig. 6). Although our data initially appear to be in conflict with both KD- and t1/2-based activation models, the ta model is consistent with reports that either t1/2 or KD can be the better predictor of ligand potency. T-cell ligands with slow kon are predicted to follow a strict t1/2-based reactivity pattern because rebinding does not occur and the ta is equal to the t1/2 of a single binding event. The canonical t1/2-dependent systems, such as the 2B4-IEk/MCC and 3L.2-IEk/Hb TCR-pMHC pairs, have slow kon compared with the rebinding threshold we have estimated (45,000–60,000/M·s) (10, 11). Because most T-cell activation studies have been done using these systems, t1/2-based models have appeared sufficient and rebindings have not been required to understand ligand potency. For example, the kon for the t1/2-dependent 2B4/MCC system studied by Krogsgaard et al. (10) are all less than 6,670/M·s, such that almost no rebindings (<0.15) are predicted to occur.
In contrast to the canonical t1/2 models, most T-cell activation studies suggesting that KD is a better predictor of ligand potency have kon larger than or close to the rebinding threshold (5, 6). Our data suggest that these correlations with KD occur because of rebinding. For example, the KD dependence of the two peptides studied by Ely et al. (6) is consistent with a dependence on the ta, with the more potent peptide having a 14-fold faster kon and a predicted 1.3- to 1.4-fold longer ta according to our model. Thus, observations that ligand potency is dependent on KD or t1/2 are not in conflict with each other; rather, they are different manifestations of the interaction between the T cell and APC when the kon is very fast or very slow. With the continuing emergence of T-cell ligands with very fast kon (4), our findings are likely to have an impact on a large repertoire of T cells.
On completion of this work, we have become aware of results for CD8+ T cells that are in harmony with our conclusions (39).
Materials and Methods
C57BL/6 mice were purchased from the Jackson Laboratory. Rag1−/− B3K506 and Rag1−/− B3K508 TCR Tg mice have been previously described (22). All mice were maintained in a pathogen-free environment in accordance with institutional guidelines in the Animal Care Facility at the University of Massachusetts Medical School. Peptides were purchased from the Medical Research Council at the National Jewish Medical Center. Additional details are provided in SI Materials and Methods.
Supplementary Material
Acknowledgments
This work was supported by a Beckman Young Investigator and Searle Scholars Award (to E.S.H.), a National Institutes of Health Pioneer Award (to A.K.C.), a National Institutes of Health Biotechnology Training Program grant (to C.C.G.), and National Institutes of Health Grant 1P01AI07/1195/01. E.S.H. is a member of the University of Massachusetts Diabetes Endocrinology Research Center (Grant DK32520).
Footnotes
The authors declare no conflict of interest.
This article is a PNAS Direct Submission. K.C.G. is a guest editor invited by the Editorial Board.
This article contains supporting information online at www.pnas.org/lookup/suppl/doi:10.1073/pnas.1000966107/-/DCSupplemental.
References
- 1.Palmer E. Negative selection—Clearing out the bad apples from the T-cell repertoire. Nat Rev Immunol. 2003;3:383–391. doi: 10.1038/nri1085. [DOI] [PubMed] [Google Scholar]
- 2.Tanchot C, Lemonnier FA, Pérarnau B, Freitas AA, Rocha B. Differential requirements for survival and proliferation of CD8 naïve or memory T cells. Science. 1997;276:2057–2062. doi: 10.1126/science.276.5321.2057. [DOI] [PubMed] [Google Scholar]
- 3.Sykulev Y, Cohen RJ, Eisen HN. The law of mass action governs antigen-stimulated cytolytic activity of CD8+ cytotoxic T lymphocytes. Proc Natl Acad Sci USA. 1995;92:11990–11992. doi: 10.1073/pnas.92.26.11990. [DOI] [PMC free article] [PubMed] [Google Scholar]
- 4.Stone JD, Chervin AS, Kranz DM. T-cell receptor binding affinities and kinetics: Impact on T-cell activity and specificity. Immunology. 2009;126:165–176. doi: 10.1111/j.1365-2567.2008.03015.x. [DOI] [PMC free article] [PubMed] [Google Scholar]
- 5.Tian S, Maile R, Collins EJ, Frelinger JA. CD8+ T cell activation is governed by TCR-peptide/MHC affinity, not dissociation rate. J Immunol. 2007;179:2952–2960. doi: 10.4049/jimmunol.179.5.2952. [DOI] [PubMed] [Google Scholar]
- 6.Ely LK, et al. Antagonism of antiviral and allogeneic activity of a human public CTL clonotype by a single altered peptide ligand: Implications for allograft rejection. J Immunol. 2005;174:5593–5601. doi: 10.4049/jimmunol.174.9.5593. [DOI] [PubMed] [Google Scholar]
- 7.Alam SM, et al. T-cell-receptor affinity and thymocyte positive selection. Nature. 1996;381:616–620. doi: 10.1038/381616a0. [DOI] [PubMed] [Google Scholar]
- 8.Grakoui A, et al. The immunological synapse: A molecular machine controlling T cell activation. Science. 1999;285:221–227. [PubMed] [Google Scholar]
- 9.Qi SY, Krogsgaard M, Davis MM, Chakraborty AK. Molecular flexibility can influence the stimulatory ability of receptor-ligand interactions at cell-cell junctions. Proc Natl Acad Sci USA. 2006;103:4416–4421. doi: 10.1073/pnas.0510991103. [DOI] [PMC free article] [PubMed] [Google Scholar]
- 10.Krogsgaard M, et al. Evidence that structural rearrangements and/or flexibility during TCR binding can contribute to T cell activation. Mol Cell. 2003;12:1367–1378. doi: 10.1016/s1097-2765(03)00474-x. [DOI] [PubMed] [Google Scholar]
- 11.Kersh GJ, Kersh EN, Fremont DH, Allen PM. High- and low-potency ligands with similar affinities for the TCR: The importance of kinetics in TCR signaling. Immunity. 1998;9:817–826. doi: 10.1016/s1074-7613(00)80647-0. [DOI] [PubMed] [Google Scholar]
- 12.Ashton-Rickardt PG, et al. Evidence for a differential avidity model of T cell selection in the thymus. Cell. 1994;76:651–663. doi: 10.1016/0092-8674(94)90505-3. [DOI] [PubMed] [Google Scholar]
- 13.McKeithan TW. Kinetic proofreading in T-cell receptor signal transduction. Proc Natl Acad Sci USA. 1995;92:5042–5046. doi: 10.1073/pnas.92.11.5042. [DOI] [PMC free article] [PubMed] [Google Scholar]
- 14.George AJT, Stark J, Chan C. Understanding specificity and sensitivity of T-cell recognition. Trends Immunol. 2005;26:653–659. doi: 10.1016/j.it.2005.09.011. [DOI] [PubMed] [Google Scholar]
- 15.Altan-Bonnet G, Germain RN. Modeling T cell antigen discrimination based on feedback control of digital ERK responses. PLoS Biol. 2005;3:1925–1938. doi: 10.1371/journal.pbio.0030356. [DOI] [PMC free article] [PubMed] [Google Scholar]
- 16.Kalergis AM, et al. Efficient T cell activation requires an optimal dwell-time of interaction between the TCR and the pMHC complex. Nat Immunol. 2001;2:229–234. doi: 10.1038/85286. [DOI] [PubMed] [Google Scholar]
- 17.Holler PD, Kranz DM. Quantitative analysis of the contribution of TCR/pepMHC affinity and CD8 to T cell activation. Immunity. 2003;18:255–264. doi: 10.1016/s1074-7613(03)00019-0. [DOI] [PubMed] [Google Scholar]
- 18.Sloan-Lancaster J, Allen PM. Altered peptide ligand-induced partial T cell activation: Molecular mechanisms and role in T cell biology. Annu Rev Immunol. 1996;14:1–27. doi: 10.1146/annurev.immunol.14.1.1. [DOI] [PubMed] [Google Scholar]
- 19.Alam SM, et al. Qualitative and quantitative differences in T cell receptor binding of agonist and antagonist ligands. Immunity. 1999;10:227–237. doi: 10.1016/s1074-7613(00)80023-0. [DOI] [PubMed] [Google Scholar]
- 20.Lyons DS, et al. A TCR binds to antagonist ligands with lower affinities and faster dissociation rates than to agonists. Immunity. 1996;5:53–61. doi: 10.1016/s1074-7613(00)80309-x. [DOI] [PubMed] [Google Scholar]
- 21.Boulter JM, et al. Potent T cell agonism mediated by a very rapid TCR/pMHC interaction. Eur J Immunol. 2007;37:798–806. doi: 10.1002/eji.200636743. [DOI] [PMC free article] [PubMed] [Google Scholar]
- 22.Huseby ES, et al. How the T cell repertoire becomes peptide and MHC specific. Cell. 2005;122:247–260. doi: 10.1016/j.cell.2005.05.013. [DOI] [PubMed] [Google Scholar]
- 23.Huseby ES, Crawford F, White J, Marrack P, Kappler JW. Interface-disrupting amino acids establish specificity between T cell receptors and complexes of major histocompatibility complex and peptide. Nat Immunol. 2006;7:1191–1199. doi: 10.1038/ni1401. [DOI] [PubMed] [Google Scholar]
- 24.Liu XQ, et al. Alternate interactions define the binding of peptides to the MHC molecule IA(b) Proc Natl Acad Sci USA. 2002;99:8820–8825. doi: 10.1073/pnas.132272099. [DOI] [PMC free article] [PubMed] [Google Scholar]
- 25.Cemerski S, et al. The stimulatory potency of T cell antigens is influenced by the formation of the immunological synapse. Immunity. 2007;26:345–355. doi: 10.1016/j.immuni.2007.01.013. [DOI] [PMC free article] [PubMed] [Google Scholar]
- 26.Naramura M, et al. c-Cbl and Cbl-b regulate T cell responsiveness by promoting ligand-induced TCR down-modulation. Nat Immunol. 2002;3:1192–1199. doi: 10.1038/ni855. [DOI] [PubMed] [Google Scholar]
- 27.Dushek O, Coombs D. Analysis of serial engagement and peptide-MHC transport in T cell receptor microclusters. Biophys J. 2008;94:3447–3460. doi: 10.1529/biophysj.107.116897. [DOI] [PMC free article] [PubMed] [Google Scholar]
- 28.Dushek O, Das R, Coombs D. A role for rebinding in rapid and reliable T cell responses to antigen. PLOS Comput Biol. 2009;5:e1000578. doi: 10.1371/journal.pcbi.1000578. [DOI] [PMC free article] [PubMed] [Google Scholar]
- 29.Freeman DL, Doll JD. The influence of diffusion on surface-reaction kinetics. J Chem Phys. 1983;78:6002–6009. [Google Scholar]
- 30.Melo E, Martins J. Kinetics of bimolecular reactions in model bilayers and biological membranes. A critical review. Biophys Chem. 2006;123:77–94. doi: 10.1016/j.bpc.2006.05.003. [DOI] [PubMed] [Google Scholar]
- 31.Bell GI. Models for the specific adhesion of cells to cells. Science. 1978;200:618–627. doi: 10.1126/science.347575. [DOI] [PubMed] [Google Scholar]
- 32.Huppa JB, et al. TCR-peptide-MHC interactions in situ show accelerated kinetics and increased affinity. Nature. 2010;463:963–967. doi: 10.1038/nature08746. [DOI] [PMC free article] [PubMed] [Google Scholar]
- 33.Davis SJ, van der Merwe PA. The kinetic-segregation model: TCR triggering and beyond. Nat Immunol. 2006;7:803–809. doi: 10.1038/ni1369. [DOI] [PubMed] [Google Scholar]
- 34.Call ME, Wucherpfennig KW. The T cell receptor: Critical role of the membrane environment in receptor assembly and function. Annu Rev Immunol. 2005;23:101–125. doi: 10.1146/annurev.immunol.23.021704.115625. [DOI] [PubMed] [Google Scholar]
- 35.Dustin ML, Bromley SK, Davis MM, Zhu C. Identification of self through two-dimensional chemistry and synapses. Annu Rev Cell Dev Biol. 2001;17:133–157. doi: 10.1146/annurev.cellbio.17.1.133. [DOI] [PubMed] [Google Scholar]
- 36.Robert P, Benoliel AM, Pierres A, Bongrand P. What is the biological relevance of the specific bond properties revealed by single-molecule studies? J Mol Recognit. 2007;20:432–447. doi: 10.1002/jmr.827. [DOI] [PubMed] [Google Scholar]
- 37.Tolentino TP, et al. Measuring diffusion and binding kinetics by contact area FRAP. Biophys J. 2008;95:920–930. doi: 10.1529/biophysj.107.114447. [DOI] [PMC free article] [PubMed] [Google Scholar]
- 38.Kaizuka Y, Douglass AD, Vardhana S, Dustin ML, Vale RD. The coreceptor CD2 uses plasma membrane microdomains to transduce signals in T cells. J Cell Biol. 2009;185:521–534. doi: 10.1083/jcb.200809136. [DOI] [PMC free article] [PubMed] [Google Scholar]
- 39.Aleksic M, et al. Dependence of T cell antigen recognition on T cell receptor-peptide MHC confinement time. Immunity. 2010;32:163–174. doi: 10.1016/j.immuni.2009.11.013. [DOI] [PMC free article] [PubMed] [Google Scholar]
Associated Data
This section collects any data citations, data availability statements, or supplementary materials included in this article.