Abstract
Background
Diabetic cardiomyopathy (DMCMP) is characterized by myocardial dysfunction regardless of coronary artery disease in diabetic patients. The features of LV dysfunction in rat model of type 1 DM induced by streptozocin, are variable and controversial. Thus, we tested the usefulness of tissue Doppler imaging in the early detection of ventricular dysfunction in a rat model of DMCMP.
Methods
Diabetes was induced by intra-peritoneal injection of streptozocin (70 mg/kg) in 8 weeks of Sprague-Dawley rat. Diagnosis of diabetes was defined as venous glucose level over 350 mg/dL 48 hrs after streptozocin injection. Echocardiography was done at baseline and 10 weeks after diabetes induction both in diabetes group (n=15) and normal control (n=10). After echocardiography at 10 weeks, invasive hemodynamic measurement using miniaturized conductance catheter was done in both groups.
Results
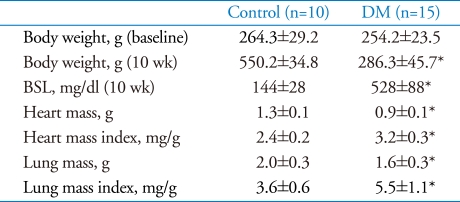
Ten weeks after diabetes induction, heart and lung mass indexes of diabetes were larger than those of normal control (3.2±0.3 vs. 2.4±0.2 mg/g, p<0.001, 5.5±1.1 vs. 3.6±0.6 mg/g, p<0.001, respectively). In echocardiographic data, s' (2.4±0.4 vs. 3.1±0.5 cm/s, p<0.001), e' velocity of mitral annulus (2.9±0.6 vs. 3.8±1.1 cm/s, p<0.001), and E/e' ratio (27.1±5.6 vs. 19.7±2.6, p<0.001) were impaired in diabetes group. In hemodynamic measurement, there were no differences in ejection fraction, peak dP/dt between the diabetic group and normal control. However, load independent indexes of contractility, the slope of the end-systolic pressure volume relation (0.18±0.07 vs. 0.62±0.18 mmHg/µL, p<0.001) and preload recruitable stroke work (51.8±22.0 vs. 90.9±22.5 mmHg, p<0.001) were impaired in diabetic group compared to normal control.
Conclusion
In a rat model of diabetic cardiomyopathy, tissue Doppler imaging of mitral annulus can be a good modality for early detection of myocardial dysfunction.
Keywords: Diabetic cardiomyopathy, Tissue Doppler imaging, Pressure-volume loop
Introduction
The prevalence of diabetes mellitus is continuously increasing. According to the report of World Health Organiztion (WHO), 300 million of subjects will be affected with diabetes by 2025.1) The diabetes causes retinopathy, end-stage renal disease, neuropathy and other complications. Above all, cardiovascular complications are leading cause of mortality and morbidity in subjects with diabetes.2)
Diabetic cardiomyopathy (DMCMP),3) which was first described by Rubler et al.2) over three decades ago, is characterized by ventricular dysfunction regardless of coronary artery disease and hypertension. Diverse pathologic mechanisms, including microangiopathy, myocardial fibrosis, interstitial inflammation, oxidative damage, and abnormalities in calcium homeostasis, are known to contribute for the development of DMCMP.4-9) As a consequence of above pathologic mechanism, functionally, diastolic and systolic functions of ventricle are impaired,10),11) and subsequent structural changes are responsible for increased myocardial fibrosis and stiffness.1),12) After far-advanced structural changes, the impairment of damaged myocardial function may be irreversible. Therefore, detection and treatment at early stage of DMCMP is considered to be important. However, there have been no effective available drugs for the treatment and prevention of ventricular dysfunction in DMCMP.
To develop effective medication and to test for the efficacy of the drug, early detection of myocardial dysfunction using experimental animal model is very important. Although pressure-volume loop achieved by invasive hemodynamic measurement is known as the 'gold standard', it is very hard to operate and it has disadvantage of sacrificing the experimental animal after the operation, and thus, recent attempts on early detection of myocardial dysfunction using echocardiography are being made.
Therefore, we tested the usefulness of tissue Doppler imaging in terms of early detection of ventricular dysfunction in a rat model of DMCMP.
Materials and Methods
Animal model
Eight weeks-aged male Sprague-Dawley (SD) rats were maintained on a 12 h light--dark cycle, with free access to standard chow. Diabetes mellitus was induced by a single intravenous injection of 70 mg/kg streptozocin (STZ) in a 0.1 M citrate buffer solution (Sigma, Munich, Germany), as previously described.13) Forty eight hours after treatment with STZ, tail vein blood glucose samples were measured with One Touch Horizon glucometer (Johnson & Johnson, California, USA) to confirm induction of diabetes (hyperglycemia >350 mg/dL). All rat which did not met diabetes criteria (blood glucose >350 mg/dL) excluded from the study, and thus, 15 diabetes rats (DM, n=15) were fed for 10 weeks. Additionally, sex-age matched SD rat were treated with sodium citrate buffer only, and referred to as the control group (control, n=10).
All of the rats were housed in the Laboratory Animal Facility of the Clinical Research Institute of Seoul National University and the study protocol was approved by Institutional Animal Care and Use Committee of Seoul National University.
Echocardiography
Echocardiography was performed at baseline (before STZ injection), 10 weeks after diabetes induction. The rats were lightly sedated with intraperitoneal zolazepam (25 mg/kg) and xylazine (50 mg/kg). Images were acquired with a 12 MHz transducer connected to a Vivid-i echocardiography machine (GE Medical, Milwaukee, USA). M-mode and 2-dimensional echocardiography images at the papillary muscle level were acquired with a frame rate of 250-300/sec. LV end-diastolic septal and posterior wall thickness (SWT and PWT), LV end diastolic dimension (LVEDD) and LV end systolic dimension (LVESD) were measured. The LV fractional shortening (LV FS) was calculated according to the following formula: FS (%) = (LVEDD-LVESD)/LVEDD.
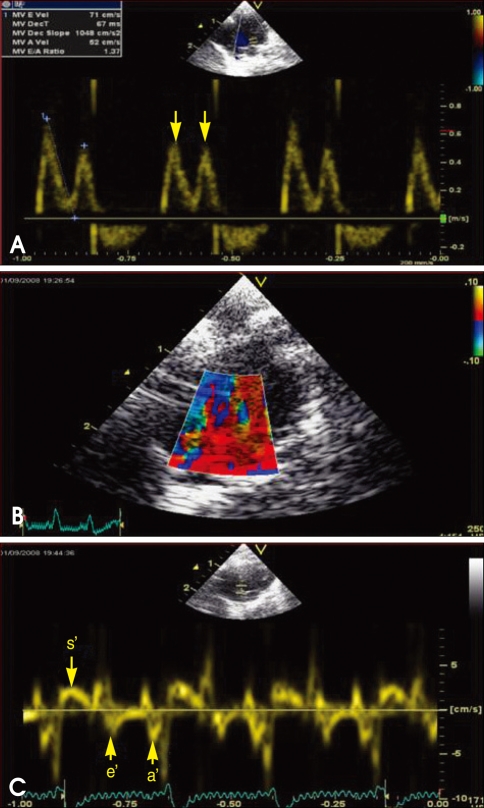
Doppler examination was performed from the apical four chamber view by using a pulsed-wave Doppler with a sample volume of 2 mm to obtain deceleration time (DT), early and late transmitral velocity (E and A wave) and their ratio (Fig. 1). The septal mitral annulus velocities s' and e' were assessed by tissue Doppler imaging with a sample volume of 1.5 mm. All parameters were evaluated on an average of three consecutive beats. A single echocardiographer who was blinded to the treatment information of the animals performed all of the data acquisition.
Fig. 1.
Mitral inflow (A), tissue Doppler imaging of mitral annulus (B), mitral annulus velocity, s', e' and a', respectively (C) (arrow).
Hemodynamic measurements
The rats were anesthetized with intraperitoneal zolazepam (Zoletil, 25 mg/kg) and placed in the recumbent position on a heat pad with a rectal probe connected to a thermoregulator. The animals were intubated with a blunt 16-gauge needle by tracheotomy method and were ventilated with a custom-designed constant-pressure ventilator at 75 breaths/min using room air. An anterior thoracotomy was performed and a small apical stab was made to expose the LV apex. A rat electrocautry was used to minimize the bleeding during the surgical procedure.
After stabbing the apex of LV with a 27-gauge needle, retrograde approach of the microtip P-V catheter (SPR-838, Millar Instruments; Houston, USA) into the LV cavity along the cardiac longitudinal axis was performed until stable P-V loops were obtained.14) Polyethylene catheters (PE-50) were inserted into the right femoral artery for measurement of the mean arterial pressure and the right internal jugular vein was used as a central venous line for fluid administration. The abdominal wall was opened and the inferior vena cava and portal vein exposed. A snare suture was placed to modulate the rapid IVC obstruction. All loops were acquired after 20 minutes of stabilization with the ventilator turned off for 5-10 seconds. The sampling rate was 1,000/s using the ARIA P-V conductance system (Millar Instruments) coupled to a Power Lab/4SP A/D converter (AD Instruments; Mountain View, USA) and a personal computer. After the data were recorded under steady state and during preload reduction by inferior vena cava ligation, parallel conductance (Vp) was obtained by the injection of 500 µL of 15% hypertonic saline into the central venous line.
Volume calibration was performed using aortic flow calibration with a perivascular flow probe and flowmetry (T-106, Transonics Inc., USA) and correction with Vp as previously described.15) Analysis of the loops was performed using a commercially available cardiac P-V analysis program, PVAN 3.5 (Millar Instruments, TX, USA). Heart rate, maximal LV systolic pressure, LVEDP, mean arterial pressure, maximal slope of systolic pressure increment (dP/dt) and diastolic pressure decrement (-dP/dt), time constant of LV pressure decay (τ), EF, stroke volume (SV), end-diastolic volume (EDV), cardiac index (CI), and stroke work (SW) were calculated.
LV P-V relations were measured by transient occlusion of the inferior vena cava with a silk snare suture. Ten to 20 successive cardiac cycles over 5 seconds were obtained, from which the end-systolic pressure volume relation (ESPVR) slope, SW-EDV relation [preload recruitable stroke work (PRSW)], slope of the maximum first derivative of ventricular pressure with respect to time (dP/dtmax)-EDV relation, and the end-diastolic pressure volume relation (EDPVR) slope were derived.
Statistical analysis
The results are expressed as means ± standard deviations. All statistical analyses were performed using SPSS 12.0 (SPSS Inc., Chicago, IL, USA). Normality of all parameters were tested by using Shapiro--Wilk W test (p<0.05). Statistical significance among multiple groups was determined using ANOVA and post hoc analysis with Bonferroni test (pvalues of <0.05 were considered statistically significant). In case that normality was excluded, non-parametric, Mann-Whitney U test was used.
Results
Animal model of diabetic cardiomyopathy
Body weight decreased in diabetes group compared to normal control 10 weeks after diabetes induction, and the body weight of diabetes group was significantly lower than normal control (DM: 286.3±45.7 vs. Control: 550.2±34.9 g, p<0.001).
Blood glucose levels significantly increased in diabetes groups 48 hr after STZ injection compared to normal control (DM: 528±88 vs. control: 144±28 mg/dL, p<0.001). In terms of diabetic conditions, unfluctuating high blood glucose levels were maintained throughout 10 weeks.
The heart mass index was significantly increased in diabetes group compared to control (DM 3.2±0.3 vs. Control 2.4±0.2 g/mg×103, p<0.001). Likewise, lung mass index was significantly elevated in both diabetic groups (DM 5.5±1.1 vs. 3.6±0.6 g/mg×103, p<0.001). Detailed data are presented in Table 1.
Table 1.
Tissue weights and blood sugar levels at 10 week after diabetes induction
*p<0.05 for difference from control. BSL: blood sugar level
Echocardiographic data
There were no differences among groups in baseline systolic and diastolic function parameters measure by echocardiography before STZ injection (Data are not presented).
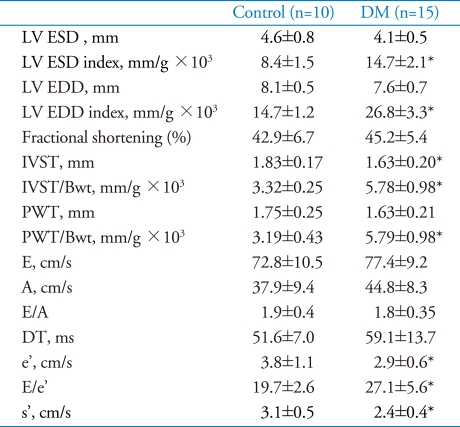
Ten weeks after diabetes induction, LV dimension indexes of diabetes group were significantly dilated compared to control (LV ESD index: 14.7±2.1 vs. 8.4±1.5 mm/g×103, p<0.001 and LV EDD/Bwt: 26.8±3.3 vs. 14.7±1.2 mm/g×103, p<0.001, respectively).LV wall thickness adjusted for body weight were also significantly increased in diabetes groups compared to control (IVST/Bwt 5.78±0.98 vs. 3.32±0.25 mm/g×103, p<0.001).
With regard to systolic functions, there were no differences in fractional shortening between two groups. In contrast, peak systolic mitral annuls velocity (s') was impaired in diabetes group compared to control (2.4±0.4 vs. 3.1±0.5 cm/s, p<0.001).
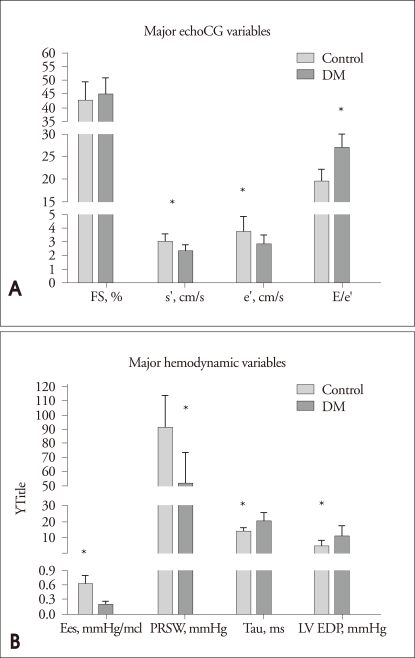
In terms of diastolic functions, diastolic parameters, which were acquired from mitral inflow including E, A velocity, deceleration time and E/A ratio did not significantly differ between two groups. However, early diastolic mitral annulus velocity (e') was impaired in diabetes group compared to control (2.9±0.6 vs. 3.8±1.1, p=0.013). Diabetes group showed a significant elevation of E/e' ratio compared to control (27.1±5.6 vs. 19.7±2.6, p<0.001)(Fig. 2A). Detailed data are presented in Table 2.
Fig. 2.
A: Major echocardiographic variables. B: Bar graphs demonstrate major hemodynamic parameters including Ees, PRSW, tau and LV EDP. *p<0.05 for difference from control. FS: fractional shortening, s': mitral annulus peak systolic velocity, e': mitral annulus early diastolic velocity, a': mitral annulus later diastolic velocity.
Table 2.
Echocardiographic data at 10 weeks after diabetes induction
*p<0.05 for difference from control. LV: left ventricle, ESD: end-systolic dimension, EDD: end-diastolic dimension, E: early diastolic transmitral velocity, A: late diastolic transmitral velocity, e': early diastolic mitral annulus velocity, s': systolic mitral annulus velocity
Invasive Hemodynamic Measurement
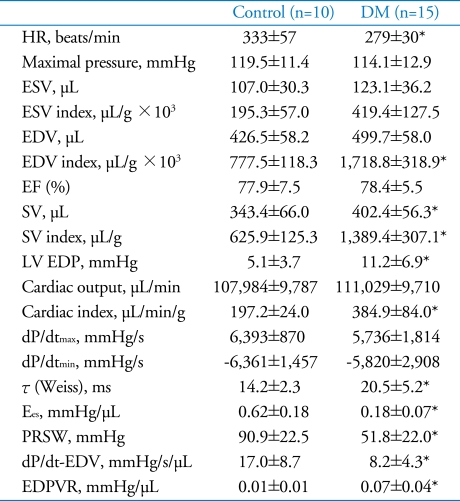
The heart rare was significantly decreased in diabetes group compared to normal control. (DM: 279±30 vs. Control: 333±57 BPM, p=0.007).
Likewise in echocardiography, 10 weeks after diabetes induction, LV volume index of diabetes group were significantly increased compared to normal control (LV ESV index: 419.4±127.5 (DM) vs. 195.3±57.0 µL/g×103 (control), p<0.001 and LV EDV index: 1718.8±318.9 (DM) vs. 777.5±118.3 (control) µL/g×103, p<0.001, respectively).
Stroke volume (1389.4±307.1 vs. 625.9±125.3 µL/g×103, p<0.001) index and cardiac index (384.9±84.0 vs. 197.2±24.0 µL/min/g, p<0.001) increased significantly in diabetes group compared to normal control (SD). With regard to systolic functions, diabetes group did not show differences in ejection fraction and dP/dtmax compared to normal control. Conversely, most of loading condition independent parameters of systolic function were impaired in diabetes group compared with those of normal control: Ees (0.18±0.07 vs. 0.62±0.18 mmHg/µL, p<0.001), PRSW (51.8±22.0 vs. 90.9±22.5 mmHg, p<0.001) and dP/dt-EDV (8.2±4.3 vs. 17.0±8.7 mmHg/s/µL, p<0.001).
As regarding diastolic function parameters, LV end-diastolic pressure (EDP) was significantly elevated (11.2±6.9 vs. 5.1±3.7 mmHg, p=0.015), and time constant of LV pressure decay (τ) was prolonged (20.5±5.2 vs. 14.2±2.3 ms, p=0.002) in diabetes group compared to control. Additionally, the slope of EDPVR was impaired in diabetes group, compared to control (0.07±0.04 vs. 0.01±0.01 mmHg/µL, p<0.001) (Fig. 2B, Table 3).
Table 3.
Hemodynamic parameters at 10 weeks after diabetes induction
Means±SDs. *p<0.05 for difference from control. HR: heart rate, ESV: end-systolic volume, EDV: end-diastolic volume, EF: ejection fraction, SV: stroke volume, LV EDP: LV end diastolic pressure, ESPVR: end systolic pressure volume relationship, PRSW: preload recruitable stroke work, EDPVR: end diastolic pressure volume relationship
Discussion
In this study, we tried to re-establish the rat model of type 1 DM induced by streptozocin because the results were conflicting between different authors. Ten weeks after diabetes induction in SD rats, there were no differences in fractional shortening, E/A ratio of mitral inflow and deceleration time. However, peak systolic mitral annuls velocity (s'), early diastolic mitral annulus velocity (e') and E/e' ratio measured by tissue Doppler imaging were different. Moreover, these differences were consistent with invasively measured parameters. One big advantage of our study was that we tried to validate these differences detected by tissue Doppler imaging against those from LV conductance catheter known as the reference method.
The features of LV dysfunction in rat model of type 1 DM, which is induced by streptozocin, are variable and controversial. Several researchers have reported reduced fractional shortening and impaired dP/dtmax within 10 weeks after diabetes induction.7),9),16),17) In contrast, in this study, there were no impairment in fractional shortening and ejection faction, which are most widely used parameters for assessing systolic function of ventricle. Moreover, decrease in dP/dtmax, which was acquired from invasive pressure measurement and one of the good parameters reflecting contractility, was not demonstrated. The values of ejection fraction and dP/dtmax are well known to be dependent on loading conditions. In this study, end-diastolic volume, stroke volume and cardiac output, when they were indexed to body weight, were significantly increased in diabetes group compared to normal control. These findings indicate that 10 week old diabetes rats were in the early stage of heart failure, maintaining cardiac output by increasing preloads.
Therefore, one key finding of current study is the possibility of echocardiography as a non-invasive testing for early detection of LV dysfunction in diabetic rat. Yoon et al.18) evaluated the natural course of streptozocin induced diabetic SD rat by serial echocardiography over 12 months, and found that 2-3 month after diabetes induction, diastolic dysfunction was prevalent in all diabetic rat, and the average time from induction of DM to development of HF, defined by both systolic and diastolic dysfunction, was 9.2 months. However, they defined LV dysfunction using fractional shortening and parameters from mitral inflow, and thus, subclinical LV dysfunction both in systolic and diastole might have been overlooked. Although there were no differences in fractional shortening and parameters derived from mitral inflow between diabetes and normal control, s' velocity of mitral annulus was impaired in diabetes group compared to the control group. Furthermore, e' velocity was reduced and E/e' ratio, which is known to reflect LV filling pressure19) even in rat,20),21) was elevated. Therefore, there are possibilities that tissue Doppler imaging22) could replace invasive hemodynamic measurement for early detection and determination of therapeutic effect, but further studies should be carried out. In addition, current study provides a clue for further studies in terms of early detection using far advanced technologies such as speckle tracking imaging or velocity vector imaging.
As a matter of fact, in small-animal model like rats, survival of the animals after the invasive hemodynamic measurement is practically impossible, and thus, follow up of the hemodynamic variables are also impracticable. On top of that, invasive hemodynamic measurement requires surgical technique and a considerable time is necessary in learning variable analysis.15)
Taken together, use of non-invasive method can be a useful modality for serial follow up of cardiac functions in development of treatment for DMCMP and we expect that this will be helpful in saving tremendous cost and time for the development of medication for DMCMP.
Acknowledgements
This study was supported by grant from Korea Research Foundation (KRF, E00217) and grant from the SNUH research fund (03-2007-0240).
References
- 1.Marwick TH. Diabetic heart disease. Heart. 2006;92:296–300. doi: 10.1136/hrt.2005.067231. [DOI] [PMC free article] [PubMed] [Google Scholar]
- 2.Rubler S, Dlugash J, Yuceoglu YZ, Kumral T, Branwood AW, Grishman A. New type of cardiomyopathy associated with diabetic glomerulosclerosis. Am J Cardiol. 1972;30:595–602. doi: 10.1016/0002-9149(72)90595-4. [DOI] [PubMed] [Google Scholar]
- 3.Boudina S, Abel ED. Diabetic cardiomyopathy revisited. Circulation. 2007;115:3213–3223. doi: 10.1161/CIRCULATIONAHA.106.679597. [DOI] [PubMed] [Google Scholar]
- 4.Zarich SW, Nesto RW. Diabetic cardiomyopathy. Am Heart J. 1989;118:1000–1012. doi: 10.1016/0002-8703(89)90236-6. [DOI] [PubMed] [Google Scholar]
- 5.Cai L, Kang YJ. Oxidative stress and diabetic cardiomyopathy: a brief review. Cardiovasc Toxicol. 2001;1:181–193. doi: 10.1385/ct:1:3:181. [DOI] [PubMed] [Google Scholar]
- 6.Fiordaliso F, Li B, Latini R, Sonnenblick EH, Anversa P, Leri A, Kajstura J. Myocyte death in streptozotocin-induced diabetes in rats in angiotensin II- dependent. Lab Invest. 2000;80:513–527. doi: 10.1038/labinvest.3780057. [DOI] [PubMed] [Google Scholar]
- 7.Tschöpe C, Walther T, Königer J, Spillmann F, Westermann D, Escher F, Pauschinger M, Pesquero JB, Bader M, Schultheiss HP, Noutsias M. Prevention of cardiac fibrosis and left ventricular dysfunction in diabetic cardiomyopathy in rats by transgenic expression of the human tissue kallikrein gene. FASEB J. 2004;18:828–835. doi: 10.1096/fj.03-0736com. [DOI] [PubMed] [Google Scholar]
- 8.Tschöpe C, Spillmann F, Rehfeld U, Koch M, Westermann D, Altmann C, Dendorfer A, Walther T, Bader M, Paul M, Schultheiss HP, Vetter R. Improvement of defective sarcoplasmic reticulum Ca2+ transport in diabetic heart of transgenic rats expressing the human kallikrein-1 gene. FASEB J. 2004;18:1967–1969. doi: 10.1096/fj.04-1614fje. [DOI] [PubMed] [Google Scholar]
- 9.Westermann D, Rutschow S, Jäger S, Linderer A, Anker S, Riad A, Unger T, Schultheiss HP, Pauschinger M, Tschöpe C. Contributions of inflammation and cardiac matrix metalloproteinase activity to cardiac failure in diabetic cardiomyopathy: the role of angiotensin type 1 receptor antagonism. Diabetes. 2007;56:641–646. doi: 10.2337/db06-1163. [DOI] [PubMed] [Google Scholar]
- 10.Boyer JK, Thanigaraj S, Schechtman KB, Pérez JE. Prevalence of ventricular diastolic dysfunction in asymptomatic, normotensive patients with diabetes mellitus. Am J Cardiol. 2004;93:870–875. doi: 10.1016/j.amjcard.2003.12.026. [DOI] [PubMed] [Google Scholar]
- 11.Fang ZY, Yuda S, Anderson V, Short L, Case C, Marwick TH. Echocardiographic detection of early diabetic myocardial disease. J Am Coll Cardiol. 2003;41:611–617. doi: 10.1016/s0735-1097(02)02869-3. [DOI] [PubMed] [Google Scholar]
- 12.Candido R, Forbes JM, Thomas MC, Thallas V, Dean RG, Burns WC, Tikellis C, Ritchie RH, Twigg SM, Cooper ME, Burrell LM. A breaker of advanced glycation end products attenuates diabetes-induced myocardial structural changes. Circ Res. 2003;92:785–792. doi: 10.1161/01.RES.0000065620.39919.20. [DOI] [PubMed] [Google Scholar]
- 13.Tschöpe C, Walther T, Yu M, Reinecke A, Koch M, Seligmann C, Heringer SB, Pesquero JB, Bader M, Schultheiss H, Unger T. Myocardial expression of rat bradykinin receptors and two tissue kallikrein genes in experimental diabetes. Immunopharmacology. 1999;44:35–42. doi: 10.1016/s0162-3109(99)00109-5. [DOI] [PubMed] [Google Scholar]
- 14.Georgakopoulos D, Mitzner WA, Chen CH, Byrne BJ, Millar HD, Hare JM, Kass DA. In vivo murine left ventricular pressure-volume relations by miniaturized conductance micromanometry. Am J Physiol. 1998;274:H1416–H1422. doi: 10.1152/ajpheart.1998.274.4.H1416. [DOI] [PubMed] [Google Scholar]
- 15.Pacher P, Nagayama T, Mukhopadhyay P, Bátkai S, Kass DA. Measurement of cardiac function using pressure-volume conductance catheter technique in mice and rats. Nat Protoc. 2008;3:1422–1434. doi: 10.1038/nprot.2008.138. [DOI] [PMC free article] [PubMed] [Google Scholar]
- 16.Van Linthout S, Riad A, Dhayat N, Spillmann F, Du J, Dhayat S, Westermann D, Hilfiker-Kleiner D, Noutsias M, Laufs U, Schultheiss HP, Tschöpe C. Anti-inflammatory effects of atorvastatin improve left ventricular function in experimental diabetic cardiomyopathy. Diabetologia. 2007;50:1977–1986. doi: 10.1007/s00125-007-0719-8. [DOI] [PubMed] [Google Scholar]
- 17.Westermann D, Van Linthout S, Dhayat S, Dhayat N, Escher F, Bücker-Gärtne C, Spillmann F, Noutsias M, Riad A, Schultheiss HP, Tschöpe C. Cardioprotective and anti-inflammatory effects of interleukin converting enzyme inhibition in experimental diabetic cardiomyopathy. Diabetes. 2007;56:1834–1841. doi: 10.2337/db06-1662. [DOI] [PubMed] [Google Scholar]
- 18.Yoon YS, Uchida S, Masuo O, Cejna M, Park JS, Gwon HC, Kirchmair R, Bahlman F, Walter D, Curry C, Hanley A, Isner JM, Losordo DW. Progressive attenuation of myocardial vascular endothelial growth factor expression is a seminal event in diabetic cardiomyopathy: restoration of microvascular homeostasis and recovery of cardiac function in diabetic cardiomyopathy after replenishment of local vascular endothelial growth factor. Circulation. 2005;111:2073–2085. doi: 10.1161/01.CIR.0000162472.52990.36. [DOI] [PubMed] [Google Scholar]
- 19.Nagueh SF. Tissue Doppler imaging for the assessment of left ventricular diastolic function. J Cardiovasc Ultrasound. 2008;16:76–79. [Google Scholar]
- 20.Ommen SR, Nishimura RA, Appleton CP, Miller FA, Oh JK, Redfield MM, Tajik AJ. Clinical utility of Doppler echocardiography and tissue Doppler imaging in the estimation of left ventricular filling pressures: A comparative simultaneous Doppler-catheterization study. Circulation. 2000;102:1788–1794. doi: 10.1161/01.cir.102.15.1788. [DOI] [PubMed] [Google Scholar]
- 21.Prunier F, Gaertner R, Louedec L, Michel JB, Mercadier JJ, Escoubet B. Doppler echocardiographic estimation of left ventricular end-diastolic pressure after MI in rats. Am J Physiol Heart Circ Physiol. 2002;283:H346–H352. doi: 10.1152/ajpheart.01050.2001. [DOI] [PubMed] [Google Scholar]
- 22.Kim YJ. Doppler Tissue Imaging. J Korean Soc Echocardiogr. 2003;11:63–69. [Google Scholar]


