Abstract
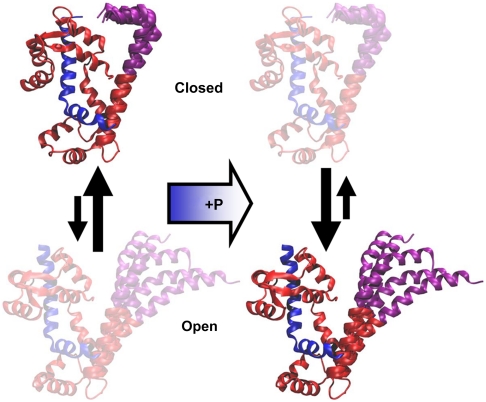
We have performed complementary time-resolved fluorescence resonance energy transfer (TR-FRET) experiments and molecular dynamics (MD) simulations to elucidate structural changes in the phosphorylation domain (PD) of smooth muscle regulatory light chain (RLC) bound to myosin. PD is absent in crystal structures, leaving uncertainty about the mechanism of regulation. Donor-acceptor pairs of probes were attached to three site-directed di-Cys mutants of RLC, each having one Cys at position 129 in the C-terminal lobe and the other at position 2, 3, or 7 in the N-terminal PD. Labeled RLC was reconstituted onto myosin subfragment 1 (S1). TR-FRET resolved two simultaneously populated structural states of RLC, closed and open, in both unphosphorylated and phosphorylated biochemical states. All three FRET pairs show that phosphorylation shifts the equilibrium toward the open state, increasing its mol fraction by ∼20%. MD simulations agree with experiments in remarkable detail, confirming the coexistence of two structural states, with phosphorylation shifting the system toward the more dynamic open structural state. This agreement between experiment and simulation validates the additional structural details provided by MD simulations: In the closed state, PD is bent onto the surface of the C-terminal lobe, stabilized by interdomain salt bridges. In the open state, PD is more helical and straight, resides farther from the C-terminal lobe, and is stabilized by an intradomain salt bridge. The result is a vivid atomic-resolution visualization of the first step in the molecular mechanism by which phosphorylation activates smooth muscle.
Keywords: fluorescence resonance energy transfer, FRET, molecular dynamics, molecular dynamics simulation, time-resolved fluorescence
Smooth muscle myosin (SMM) is a member of the myosin superfamily of motor proteins, which use chemical energy from ATP hydrolysis to perform mechanical work on actin. Motor properties of myosin are activated by Ca2+. In skeletal muscle, Ca2+ moves actin-bound inhibitory proteins to allow active myosin-actin interaction. In smooth muscle, activation requires phosphorylation of regulatory light chain (RLC) (Fig. 1), which is distant from the myosin active site on the catalytic domain (Fig. 1). Unphosphorylated SMM is auto-inhibited by interactions between the two catalytic domains (1, 2) that are relieved by RLC phosphorylation (3, 4). Although regulation requires both heads of myosin (5–8), phosphorylation of one RLC is sufficient to activate both heads (9, 10).
Fig. 1.
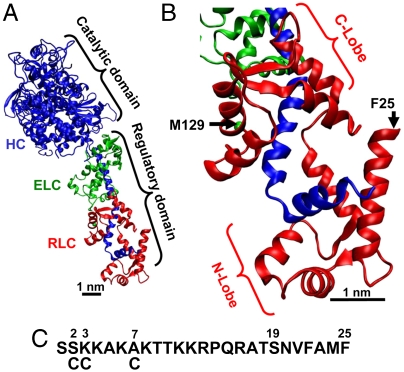
(A) Crystal structure of myosin S1 (11), with heavy chain (HC, blue), essential light chain (ELC, green), and regulatory light chain (RLC, red). (B) Homology-modeled structure of SMM RLC (12). (C) Sequence of PD, the N-terminal portion of SMM RLC (absent in crystal structure). Di-Cys mutants are made by mutating M129 (B) and either residue 2, 3, or 7 (C). RLC is phosphorylated at S19.
The structural mechanism by which phosphorylation of RLC at S19 activates SMM is a mystery, primarily because there is no high-resolution structure of any myosin that contains the N-terminal 24 residues of RLC (Fig. 1). Site-directed spin labeling demonstrated that this N-terminal segment acts as a coherent domain in response to phosphorylation, so it is now referred to as the phosphorylation domain (PD) (11). Removal of PD abolishes regulation, but charge replacement or deletion of PD causes only partial activation (12, 13), suggesting that full activation requires specific structural changes within PD. Fluorescence studies on the structurally homologous skeletal RLC suggest that the N terminus extends away from the C lobe of RLC (14, 15). Cross-linking within heavy meromyosin (HMM, a two-headed fragment of SMM) suggests that a portion of PD can interact with the C lobe of its partner RLC, whereas phosphorylation decreases this interaction (16). This head–head interaction is probably responsible for allosteric nucleotide effects on PD (17).
An important step toward a high-resolution structure of PD, and thus the entire RLC, came from the above-mentioned site-directed spin labeling study (11). A spin label was attached to a series of single-Cys mutants of PD on HMM, and electron paramagnetic resonance (EPR) spectra showed that phosphorylation increases helicity within PD, while increasing its solvent accessibility and rotational mobility. Subsequent MD simulations on the isolated PD confirmed the disorder-to-order transition and provided a more detailed atomic structural explanation—PD is disordered from K11 to Q15, and phosphorylation at S19 allows a salt bridge to form with R16, stabilizing the α-helical secondary structure N terminal to R16 (18, 19). The favorable enthalpy change arising from electrostatic interactions is balanced by a loss of configurational entropy, minimizing the change in free energy of ordering due to phosphorylation (19).
In the present study, we have addressed the phosphorylation-induced structural transition in PD of SMM by using two complementary approaches: fluorescence experiments and molecular dynamics (MD) simulations. We performed time-resolved fluorescence resonance energy transfer (TR-FRET) within three di-Cys mutant RLCs reconstituted into SMM subfragment 1 (S1). The single-headed S1 was used to avoid complexities introduced by head-head interactions. Although enzymatic properties of S1 are insensitive to phosphorylation (7), RLC bound to S1 undergoes similar phosphorylation-dependent structural changes as in two-headed SMM (11, 20). TR-FRET results were validated and illuminated with all-atom MD simulations of both unphosphorylated and phosphorylated biochemical states of RLC bound to the 36 amino acid segment (IQ) of the SMM heavy chain. This combined approach allowed us to resolve distinct structural states of this system and to construct a detailed atomic-level model for the phosphorylation-dependent structural changes that trigger the activation of smooth muscle.
Results
Labeling and Phosphorylation.
Each Escherichia-coli-expressed RLC di-Cys mutant was first labeled with donor (5-({2-[(iodoacetyl)amino]ethyl}amino)naphthalene-1-sulfonic acid)) at a small fraction (approximately 30%) of sites, then labeled with excess acceptor fluorescein maleimide (SI Methods), ensuring that most donors have acceptor bound to the same RLC. Both donor-only and donor-acceptor RLC were thiophosphorylated. Mass spectrometry confirmed that virtually all Cys residues were labeled and that virtually all labeled RLCs were phosphorylated (Fig. S1A). Fluorescently labeled di-Cys RLCs were exchanged onto S1, and actin-activated ATPase activities were nearly identical to that of unlabeled S1 (Fig. S1B).
TR-FRET Reveals Open and Closed Structural States of RLC.
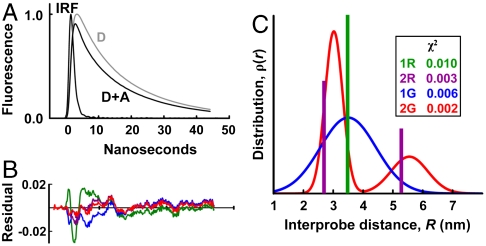
Steady-state fluorescence intensity provides little or no resolution of populations. Time-resolved FRET provides direct and independent information about the mol fractions and interprobe distances represented by distinct populations. Using the instrumentation described in Methods, TR-FRET was performed on 10 μM S1, with RLC labeled either with donor only (D) or with donor plus acceptor (D + A), in a solution containing 150 mM NaCl, 25 mM Tris, pH 7.5 (25 °C). First, the fluorescence of each donor-only sample, FD(t), was fitted by a multiexponential function (Methods, Eq. 1), with three exponentials required for an optimal fit (Fig. S2 and Table S1). These preexponential factors and lifetimes were used to constrain FRET fits (Eq. 2). For each of the three doubly labeled mutants (S2C/M129C, K3C/M129C, and A7C/M129C), FD+A(t) shows an increase in the rate of fluorescence decay, as shown in Fig. 2 for one of the mutants. Time resolution is particularly important in the present FRET study, because there is a significant fraction of RLC that contains only donor, and time-resolved data allow us to correct quantitatively for this component of the waveform (Eq. 3). We tested several different models for the distance distribution ρ(R) (Eqs. 2–4), including a single FRET distance (“1R”), a single Gaussian distribution (“1G”), two discrete distances (“2R”), and two Gaussian distributions (“2G”). As exemplified in Fig. 2, the two-component models (2R, 2G) were clearly superior, with χ2 values 3–5 times less than for one-component models. The 2G model (Eq. 4) was selected, not only because of its superior statistics (lowest χ2), but also because it is physically more realistic than 2R and is more consistent with MD simulations (discussed below). Consequently, fluorescence waveforms from all three di-Cys mutants were fitted by the model described by (Eqs. 2–4), which accounts for the fraction of uncoupled donor (XD) and determines the centers (R1, R2), widths FWHM1,FWHM2, and mol fractions (X1, X2 = 1-X1) of each population (Eq. 4).
Fig. 2.
Time-resolved fluorescence of S2C/M129C-RLC on SMM S1. (A) Fluorescence waveforms of both donor (D) and donor-acceptor (D + A), and the IRF. (B) Residual, (data - fit)/(maximum fit value), for three different distance distribution models shown in C. A two-Gaussian distance model (red, 2G) gives the best fit to the data (lowest residual amplitude and χ2 values) when compared to a single Gaussian (blue, 1G), two discrete distances (purple, 2R), or a single discrete distance (green, 1R).
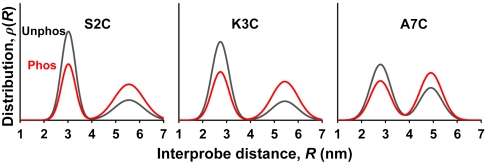
All FRET datasets were fitted well by this model, producing two populations having short and long distances. These distances were determined by assuming κ2 = 2/3 in the calculation of R0 (4.62 nm) (Eq. S7), which is a safe assumption, since time-resolved fluorescence anisotropy showed that probes on PD are nearly isotropic, implying that probe orientation does not significantly affect the accuracy of FRET analysis (Table S2 and Eq. S5). For each mutant, both biochemical states (phosphorylated and unphosphorylated) of RLC yielded similar mean distances and widths for the two structural states (Fig. S3), and in each case, phosphorylation increased the mol fraction in the long-distance population. Indeed, when the datasets were fitted globally (Fig. 3), assuming that the same two structural states were present in both biochemical states (unphosphorylated and phosphorylated) for a given mutant, the quality of the fit was just as good as when the distance distributions were allowed to vary independently (Fig. S3). These results strongly support a model in which RLC has two fundamental structural states, closed and open (corresponding to short and long FRET distances, respectively), with phosphorylation shifting the equilibrium toward the open state.
Fig. 3.
Distance distributions determined by TR-FRET between M129C and three mutants in PD, for RLC bound to S1.
This model is supported further by the observation that the mol fractions of the two states, and their dependence on phosphorylation, are similar for all three mutants (Table 1), which are thus detecting independently the same fundamental equilibrium between closed and open structural states. Phosphorylation shifts the equilibrium populations toward the open state by about 23% (Table 1).
Table 1.
Mol fraction of the open structural state
| Unphosphorylated | Phosphorylated | |||
| S2C | 0.32 | ± 0.01 | 0.57 | ± 0.02 |
| K3C | 0.29 | ± 0.10 | 0.54 | ± 0.04 |
| A7C | 0.39 | ± 0.05 | 0.56 | ± 0.04 |
| Average | 0.33 | ± 0.04 | 0.56 | ± 0.03 |
| Average from MD | 0.18 | 0.59 | ||
Molecular Dynamics Simulations Confirm FRET Results and Reveal Unique Structural Details.
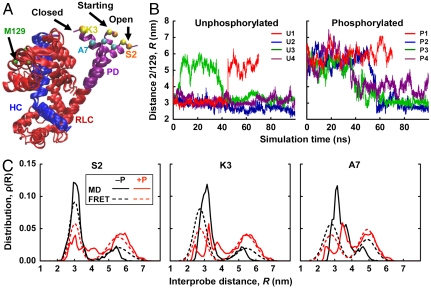
Eight MD simulations were performed on unphosphorylated and phosphorylated RLC (residues 1–165) bound to an IQ of the smooth muscle myosin heavy chain (residues 815–850) (Fig. 4A). The starting structure for these simulations was based on homology modeling from crystal and EM structures, with PD starting as an idealized helix (Methods). Distances were measured between Cα atoms of the same pairs of residues used in FRET experiments. Trajectories (Fig. 4B) show that both unphosphorylated and phosphorylated biochemical states occupy two structural states, open (distance ∼3 nm) and closed (Fig. 4A), demonstrated by bimodal distance distributions in all three mutants (Fig. 4C, solid), which are remarkably similar to those observed by TR-FRET (Fig. 4C, dashed). Both simulations and experiments show that the mean probe separation is 2–3 nm greater in the open state, where the amplitude of fluctuations (distribution width) is also greater in most cases. The pattern is similar for all three mutants, showing that PD acts as a coherent domain. Upon phosphorylation, simulations (Fig. 4C, solid) confirm emphatically the shift toward the open state observed by experiments (Fig. 4C, dashed): Simulations show a shift from 18% to 59% open; experiments from 33% to 56% (Table 1). Simulations also show that phosphorylation produces more interdomain disorder in both structural states, producing broader and more heterogeneous distance distributions (Fig. 4C, solid red) and greater rmsd fluctuations (Fig. S5). RLC approaches steady-state rmsd levels within a few nanoseconds, with values substantially greater with phosphorylation (0.3–0.9 nm) than without (0.2–0.6 nm) (Fig. S5A). Root-mean-square deviation levels, and the amplitude of fluctuations in these levels, are generally greater when the entire RLC is included (Fig. S5A) than when each domain is analyzed separately, aligned to itself (Fig. S5 B and C), demonstrating that a major source of structural fluctuations is interdomain movement of PD relative to the rest of RLC.
Fig. 4.
Atomic-resolution model of open and closed states from MD simulations. (A) Snapshots of the starting, closed, and open states found in SMM RLC (red, with PD in purple) bound to the IQ segment (blue, residues 815–850, to which the three structures were aligned) of the SMM heavy chain. The four labeling sites are shown. (B) Trajectories of the distance between Cα of S2 and M129 over the 70 (red) and 100-ns (blue, green, and purple) trajectories. Trajectories for the other two mutants (K3, A7) are quite similar (Fig. S4). (C) Comparison of the simulated distance distributions (solid lines) with those from TR-FRET experiments (dashed lines), for unphosphorylated (black) and phosphorylated (red) biochemical states. Simulated distributions are the average of histograms from the 70 ns and three 100 ns trajectories, which were constructed by allocating Cα–Cα distances to 0.1-nm bins. Distributions shown are the weighted averages from all simulations; distributions from individual simulations are shown in Fig. S4.
Discussion
Complementary Experimental and Computational Methodologies.
We used two complementary approaches, TR-FRET experiments and MD simulations, to construct an atomic-resolution structural model of the complete RLC bound to myosin heavy chain (Figs. 4A and 5). Both approaches provide evidence of two coexisting RLC structural states (closed and open) in each of the two biochemical states (unphosphorylated and phosphorylated), with a population shift toward the open state upon phosphorylation (Fig. 4C). This combined approach is particularly effective because the limitations of one method are compensated by the other. FRET, like other ensemble spectroscopic methods, samples an enormous set of molecular conformations and times, so convergence is not in doubt, whereas MD simulations deal with one molecule at a time, and convergence is particularly problematic when large-scale conformational transitions are observed between long-lived states (Fig. 4B and Fig. S6). However, FRET is limited to the observation of two sites at a time using loosely coupled probes, whereas MD simulations include all atoms and show details of secondary structure and tertiary interactions. Fortunately, TR-FRET provides enough structural resolution to compare the distance distributions directly with those of MD simulations, and these distributions are in remarkable agreement, showing similar means, widths, and bimodal character (Fig. 4C and Table 1). Thus the two approaches validate each other. Although our most secure conclusions are those that are accessible from both techniques (Fig. 4C), the validated MD simulations allow us to extrapolate beyond experiment and gain more detailed structural insight, as discussed below.
Fig. 5.
Model of structural changes within RLC. Phophorylation shifts the equilibrium from a compact closed structural state toward an open state in which PD (purple) is more helical (increased secondary order) but also more globally flexible (decreased tertiary order).
Phosphorylation Shifts the RLC Structural Equilibrium.
EPR data (11) showed that, upon phosphorylation, PD of SMM RLC exhibits an increase in helicity, solvent accessibility, and rotational mobility, consistent with the more open structure indicated by the present study. The increase in helicity was confirmed in previous MD simulations on the isolated PD, regardless of whether the CMAP correction [used in the present simulation; sometimes reputed to overestimate helicity (21)] was employed (18, 19). But the current results provide much more than confirmation—they provide the added dimension of structural resolution (Fig. 5). Both experiments and simulations show that phosphorylation shifts a preexisting equilibrium between two resolved structural states (closed and open) toward the open state, which exhibits increased secondary (helical) order within PD but decreased tertiary order of the entire RLC. Table 2 shows that helicity is greater in the open structural state, with phosphorylation shifting the equilibrium toward this state and thus increasing helicity. However, the open structural state has a wider distance distribution (Fig. 4C) and larger rmsd fluctuations (Fig. S5) giving rise to a more dynamic and disordered tertiary structure (Fig. 5).
Table 2.
Fraction helix in closed and open structural states of RLC
| In closed structural state | In open structural state | Total | Isolated PD‡ |
|||
| Mol fraction* | Helix fraction† | Mol fraction* | Helix fraction† | Helix fraction | ||
| Unphos. | 0.82 | 0.90 | 0.18 | 0.94 | 0.91 | 0.91 |
| Phos. | 0.41 | 0.89 | 0.59 | 0.99 | 0.95 | 0.99 |
*Mol fraction was calculated by integrating the simulated S2-M129 Cα distance distribution (Fig. 4C) from 1–4.5 nm (closed) and 4.5–7.5 nm (open).
†Helix fraction is the average fraction of time each residue in PD was helical in a given structural state, as determined with the STRIDE algorithm (24) in visual molecular dynamics. All 370 ns of the simulations were included.
‡See ref. 21.
Interdomain and Intradomain Salt Bridges.
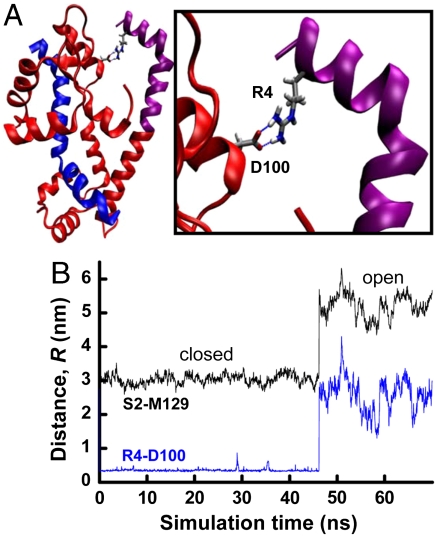
MD simulations suggest that the tertiary order of the closed state is stabilized by interdomain salt bridges between basic residues in PD and acidic residues in the C lobe, as exemplified in Fig. 6A. Fig. 6B shows a trajectory in which the R4-D100 salt bridge is present throughout the closed period and is immediately lost in the closed-to-open transition. Fig. S7 shows that these closed-state salt bridges are three times more prevalent in the absence than in the presence of phosphorylation. It is not likely that the particular salt bridge depicted in Fig. 6 is essential for formation of the closed state, because deletion of the first 10 residues of PD has little effect on the function of smooth muscle myosin (13). Nevertheless, such a deletion would still leave a cluster of basic residues (K11, K12, and R13) at the N terminus, at an appropriate location to interact with several acidic residues on the C lobe. Salt bridges also stabilize the open state, but in this case they are intradomain. Our previous MD simulations showed that the R16-pS19 salt bridge functions as a switch that increases helical order within PD (18). We find that this phosphorylation-dependent salt bridge is formed during 93% of the simulation, correlating with destabilization of the R4-D100/E99 salt bridge (Fig. S7, red), thereby introducing tertiary disorder of RLC (Fig. 5).
Fig. 6.
Closed state stabilized by interdomain salt bridge. (A) Salt bridge between R4 of PD and D100 of the C lobe. (B) Distance trajectory from unphosphorylated RLC (from U1 simulation of Fig. 4B). Black trace: interprobe trajectory from Fig. 4B, showing transition from closed to open state at 47 ns. Blue trace: distance between guanidino nitrogens of R4 and the carbonyl oxygens of D100.
Mechanism of Regulation.
The principal mystery in smooth muscle regulation is how phosphorylation of PD on RLC relieves inhibitory head–head interactions, resulting in functional changes 8–10 nm away at the ATP- and actin-binding sites of myosin (1, 2, 22). Because the present study deals with a single myosin head and focuses on the RLC, we cannot directly address this entire puzzle. However, it is plausible that a compact inhibited structure of the entire myosin molecule is initiated on a smaller scale by the compact closed structure that is predominant in the unphosphorylated RLC (Fig. 5). This could be explained by direct RLC–RLC interactions (16), or by less direct effects that propagate through the heavy chain (20). If changes in RLC order are transmitted to the tightly coupled heavy chain, then the more flexible RLC (more populated open state) after phosphorylation would allow greater flexibility of the heavy chain, allowing the entire myosin molecule to become more open and active (20). Further studies involving site-directed spectroscopy and simulations on two-headed myosin will be needed to test these hypotheses.
Relationship to Other Systems.
There are several other examples of muscle protein systems in which high-resolution spectroscopy, sensitive to dynamics and disorder and supported by MD simulations, has revealed the coexistence of two structural states within a single biochemical state, with a biochemical transition shifting this population. EPR and TR-FRET have shown this in the heavy chain of myosin, with biochemical states defined by nucleotides at the active site. EPR (23–25) and NMR have shown it in phospholamban, with biochemical states defined by phosphorylation (26, 27). In contrast to RLC, phospholamban undergoes an order-to-disorder transition in secondary structure upon phosphorylation, due to the formation of a helix-stabilizing salt bridge involving P-Ser (28).
Conclusion
TR-FRET experiments show that myosin-bound RLC occupies two distinct structural states (open and closed) in both biochemical states. Phosphorylation shifts this equilibrium toward the open state. Experimental results agree remarkably well with MD simulations, allowing us to explain our spectroscopic observations with an atomic-resolution model, including specific intramolecular contacts and dynamics. The closed state shows more tertiary order, due to interdomain salt bridges, and phosphorylation produces an intradomain PD salt bridge that stabilizes its secondary (helical) order but destabilizes the closed state. The combination of MD simulations and TR-FRET experiments is a powerful approach that should be widely applicable to other systems. When the distance distributions of an MD trajectory are validated by FRET, the detailed and dynamic atomic model provided by the MD trajectory provides mechanistic insight far beyond the capability of any experimental technique.
Methods
Methods for protein preparations, labeling, thiophosphorylation, mass spectrometry, and S1 exchange are in SI Text.
TR-FRET.
Fluorescence waveforms were detected using a fluorometer built in collaboration with Fluorescence Innovations, Inc., using a passively Q-switched frequency-tripled neodymium-doped yttrium/aluminum-garnet laser that delivers narrow, highly reproducible, and high-energy pulses (∼1 μJ) with a 10 kHz repetition rate. A full fluorescence emission waveform was detected in response to each laser pulse (every 0.1 ms) using a photomultiplier tube (Hamamatsu) and a transient Digitizer (Acqiris). Each reported waveform is an average of 950 individual waveforms (experiment complete in ∼0.1 s), each of which consists of 500 points (0.125 ns per point), digitized with 10-bit resolution. Waveforms were analyzed with a program written by Igor Negrashov, Fargofit, which supports global nonlinear fitting.
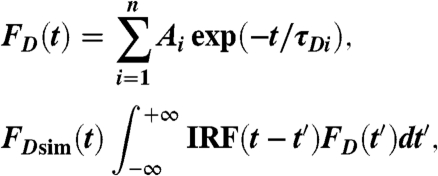
The observed donor-only waveform FDobs(t) was fitted by a simulation FDsim(t), consisting of a multiexponential decay FD(t) convolved with the instrument response function (IRF) (from water light scatter),
 |
[1] |
where τDi are donor-only fluorescence lifetimes. The best fit was obtained with n = 3 in Eq. 1 (Fig. S2). The waveform of donor–acceptor labeled myosin before convolution, FDA(t), was fitted assuming that the acceptor increases the decay rate due to energy transfer (Eq. S6). In the most general case, a distribution of donor–acceptor distances ρ(r) was assumed:
 |
[2] |
and the observed waveform FD+Aobs(t) was fitted by FD+Asim(t):
 |
[3] |
where XD is the fraction of proteins labeled only with donor.
Several functional forms of ρ(R) were tested: single discrete distance (1R), two discrete distances (2R), single Gaussian (1G), and two Gaussian components (2G). The best fits (indicated by residual plots and χ2) were consistently obtained for the 2G model (Fig. 2),
 |
[4] |
Each fit yielded five independent parameters of ρ(R): centers R1 and R2, widths FWHM1 and FWHM2, and mol fraction X1.
Molecular Dynamics Simulations.
The base RLC structure was obtained by homology modeling, using as a template the crystal structure of scallop myosin regulatory domain, which lacks the first 24 residues (PD) (29). Based on EPR data (11) and MD simulations (18, 19), we reconstructed PD by assigning an ideal α-helix, using Swiss Protein Data Bank (PDB) Viewer. It is unlikely that an unfolded domain would undergo phosphorylation-induced folding in these simulations because the folding of the fastest isolated peptides requires several microseconds (30). The model was refined by 500 cycles of energy minimization. In order to map RLC onto IQ coordinates (PDB 1I84), α-carbon coordinates of RLC were aligned to those found in the cryo-EM structure (1), and this model was subjected to several rounds of energy minimization.
Phosphorylation at S19 was assigned using the PSFGEN utility of NAMD 2.6 (31). Phosphate was assigned a charge of -2, based on pKa = 6.5 for phosphoserine and pH > 7 in smooth muscle (32) and our FRET experiments. A pH of 7.5 was assigned by adjusting side-chain ionization states of RLC using the PROPKA utility of VMD (33). The system was embedded in TIP3P water boxes with a minimum distance of 2 nm between the protein and the edges of the periodic box. Na+ and Cl- ions were added to neutralize charge and produce an ion concentration of approximately 150 mM, as in experiments. Topologies and parameters were used according to the CHARMM22 force field (34, 35) with CMAP correction. To improve conformational sampling, we performed four independent MD simulations for each system, phosphorylated and unphosphorylated, with randomly selected initial atomic velocities (36). The systems were warmed to 310 K and equilibrated for 1 ns. MD simulations used NAMD 2.6 (31) with periodic boundary conditions (37), particle mesh Ewald (38, 39), a nonbonded cutoff of 0.9 nm, and an integration step of 2 fs.
Supplementary Material
Acknowledgments.
TR-FRET hardware and software were by Igor Negrashov, in collaboration with Gregory Gillispie (Fluorescence Innovations, Inc.). This work was supported by a grant to D.D.T. from National Institutes of Health (AR32961). D.K. was supported by the National Institutes of Health Training Program for Muscle Research (T32 AR07612) and the Victor Bloomfield Fellowship. L.M.E.-F. was supported in part by Consejo Nacional de Ciencia y Technología. We used the Center for Mass Spectrometry and Proteomics and the Supercomputing Institute at the University of Minnesota.
Footnotes
The authors declare no conflict of interest.
This article is a PNAS Direct Submission.
This article contains supporting information online at www.pnas.org/lookup/suppl/doi:10.1073/pnas.1001941107/-/DCSupplemental.
References
- 1.Wendt T, Taylor D, Trybus KM, Taylor K. Three-dimensional image reconstruction of dephosphorylated smooth muscle heavy meromyosin reveals asymmetry in the interaction between myosin heads and placement of subfragment 2. Proc Natl Acad Sci USA. 2001;98:4361–4366. doi: 10.1073/pnas.071051098. [DOI] [PMC free article] [PubMed] [Google Scholar]
- 2.Liu J, Wendt T, Taylor D, Taylor K. Refined model of the 10S conformation of smooth muscle myosin by cryo-electron microscopy 3D image reconstruction. J Mol Biol. 2003;329:963–972. doi: 10.1016/s0022-2836(03)00516-3. [DOI] [PubMed] [Google Scholar]
- 3.Sellers JR. Mechanism of the phosphorylation-dependent regulation of smooth muscle heavy meromyosin. J Biol Chem. 1985;260:15815–15819. [PubMed] [Google Scholar]
- 4.Ellison PA, Sellers JR, Cremo CR. Kinetics of smooth muscle heavy meromyosin with one thiophosphorylated head. J Biol Chem. 2000;275:15142–15151. doi: 10.1074/jbc.275.20.15142. [DOI] [PubMed] [Google Scholar]
- 5.Sata M, Matsuura M, Ikebe M. Characterization of the motor and enzymatic properties of smooth muscle long S1 and short HMM: Role of the two-headed structure on the activity and regulation of the myosin motor. Biochemistry. 1996;35:11113–11118. doi: 10.1021/bi960435s. [DOI] [PubMed] [Google Scholar]
- 6.Konishi K, et al. Two new modes of smooth muscle myosin regulation by the interaction between the two regulatory light chains, and by the S2 domain. J Biochem–Tokyo. 2001;129:365–372. doi: 10.1093/oxfordjournals.jbchem.a002866. [DOI] [PubMed] [Google Scholar]
- 7.Ikebe M, Hartshorne DJ. Proteolysis of smooth muscle myosin by Staphylococcus aureus protease: Preparation of heavy meromyosin and subfragment 1 with intact 20000-dalton light chains. Biochemistry. 1985;24:2380–2387. doi: 10.1021/bi00330a038. [DOI] [PubMed] [Google Scholar]
- 8.Cremo CR, Wang F, Facemyer K, Sellers JR. Phosphorylation-dependent regulation is absent in a nonmuscle heavy meromyosin construct with one complete head and one head lacking the motor domain. J Biol Chem. 2001;276:41465–41472. doi: 10.1074/jbc.M107103200. [DOI] [PubMed] [Google Scholar]
- 9.Walcott S, Fagnant PM, Trybus KM, Warshaw DM. Smooth muscle heavy meromyosin phosphorylated on one of its two heads supports force and motion. J Biol Chem. 2009;284:18244–18251. doi: 10.1074/jbc.M109.003293. [DOI] [PMC free article] [PubMed] [Google Scholar]
- 10.Rovner AS, Fagnant PM, Trybus KM. Phosphorylation of a single head of smooth muscle myosin activates the whole molecule. Biochemistry. 2006;45:5280–5289. doi: 10.1021/bi060154c. [DOI] [PMC free article] [PubMed] [Google Scholar]
- 11.Nelson WD, Blakely SE, Nesmelov YE, Thomas DD. Site-directed spin labeling reveals a conformational switch in the phosphorylation domain of smooth muscle myosin. Proc Natl Acad Sci USA. 2005;102:4000–4005. doi: 10.1073/pnas.0401664102. [DOI] [PMC free article] [PubMed] [Google Scholar]
- 12.Sweeney HL, Yang Z, Zhi G, Stull JT, Trybus KM. Charge replacement near the phosphorylatable serine of the myosin regulatory light chain mimics aspects of phosphorylation. Proc Natl Acad Sci USA. 1994;91:1490–1494. doi: 10.1073/pnas.91.4.1490. [DOI] [PMC free article] [PubMed] [Google Scholar]
- 13.Ikebe M, et al. Function of the NH2-terminal domain of the regulatory light chain on the regulation of smooth muscle myosin. J Biol Chem. 1994;269:28173–28180. [PubMed] [Google Scholar]
- 14.Wolff-Long VL, Saraswat LD, Lowey S. Cysteine mutants of light chain-2 form disulfide bonds in skeletal muscle myosin. J Biol Chem. 1993;268:23162–23167. [PubMed] [Google Scholar]
- 15.Saraswat LD, Lowey S. Subunit interactions within an expressed regulatory domain of chicken skeletal myosin. Location of the NH2 terminus of the regulatory light chain by fluorescence resonance energy transfer. J Biol Chem. 1998;273:17671–17679. doi: 10.1074/jbc.273.28.17671. [DOI] [PubMed] [Google Scholar]
- 16.Wahlstrom JL, et al. Structural model of the regulatory domain of smooth muscle heavy meromyosin. J Biol Chem. 2003;278:5123–5131. doi: 10.1074/jbc.M206963200. [DOI] [PubMed] [Google Scholar]
- 17.Mazhari SM, Selser CT, Cremo CR. Novel sensors of the regulatory switch on the regulatory light chain of smoothmuscle Myosin. J Biol Chem. 2004;279:39905–39914. doi: 10.1074/jbc.M407062200. [DOI] [PubMed] [Google Scholar]
- 18.Espinoza-Fonseca LM, Kast D, Thomas DD. Molecular dynamics simulations reveal a disorder-to-order transition on phosphorylation of smooth muscle myosin. Biophys J. 2007;93:2083–2090. doi: 10.1529/biophysj.106.095802. [DOI] [PMC free article] [PubMed] [Google Scholar]
- 19.Espinoza-Fonseca LM, Kast D, Thomas DD. Thermodynamic and structural basis of phosphorylation-induced disorder-to-order transition in the regulatory light chain of smooth muscle myosin. J Am Chem Soc. 2008;130:12208–12209. doi: 10.1021/ja803143g. [DOI] [PMC free article] [PubMed] [Google Scholar]
- 20.Rosenfeld SS, et al. Structural and kinetic studies of phosphorylation-dependent regulation in smooth muscle myosin. J Biol Chem. 1998;273:28682–28690. doi: 10.1074/jbc.273.44.28682. [DOI] [PubMed] [Google Scholar]
- 21.Best RB, Buchete NV, Hummer G. Are current molecular dynamics force fields too helical? Biophys J. 2008;95:L07–09. doi: 10.1529/biophysj.108.132696. [DOI] [PMC free article] [PubMed] [Google Scholar]
- 22.Alamo L, et al. Three-dimensional reconstruction of tarantula myosin filaments suggests how phosphorylation may regulate myosin activity. J Mol Biol. 2008;384:780–797. doi: 10.1016/j.jmb.2008.10.013. [DOI] [PMC free article] [PubMed] [Google Scholar]
- 23.Agafonov RV, et al. Structural dynamics of the myosin relay helix by time-resolved EPR and FRET. Proc Natl Acad Sci USA. 2009;106:21625–21630. doi: 10.1073/pnas.0909757106. [DOI] [PMC free article] [PubMed] [Google Scholar]
- 24.Agafonov RV, Nesmelov YE, Titus MA, Thomas DD. Muscle and nonmuscle myosins probed by a spin label at equivalent sites in the force-generating domain. Proc Natl Acad Sci USA. 2008;105:13397–13402. doi: 10.1073/pnas.0801342105. [DOI] [PMC free article] [PubMed] [Google Scholar]
- 25.Klein JC, et al. Actin-binding cleft closure in myosin II probed by site-directed spin labeling and pulsed EPR. Proc Natl Acad Sci USA. 2008;105:12867–12872. doi: 10.1073/pnas.0802286105. [DOI] [PMC free article] [PubMed] [Google Scholar]
- 26.Karim CB, Zhang Z, Howard EC, Torgersen KD, Thomas DD. Phosphorylation-dependent conformational switch in spin-labeled phospholamban bound to SERCA. J Mol Biol. 2006;358:1032–1040. doi: 10.1016/j.jmb.2006.02.051. [DOI] [PubMed] [Google Scholar]
- 27.Metcalfe EE, Traaseth NJ, Veglia G. Serine 16 phosphorylation induces an order-to-disorder transition in monomeric phospholamban. Biochemistry. 2005;44:4386–4396. doi: 10.1021/bi047571e. [DOI] [PubMed] [Google Scholar]
- 28.Paterlini MG, Thomas DD. The alpha-helical propensity of the cytoplasmic domain of phospholamban: A molecular dynamics simulation of the effect of phosphorylation and mutation. Biophys J. 2005;88:3243–3251. doi: 10.1529/biophysj.104.054460. [DOI] [PMC free article] [PubMed] [Google Scholar]
- 29.LaConte LE, Voelz V, Nelson W, Enz M, Thomas DD. Molecular dynamics simulation of site-directed spin labeling: Experimental validation in muscle fibers. Biophys J. 2002;83:1854–1866. doi: 10.1016/S0006-3495(02)73950-7. [DOI] [PMC free article] [PubMed] [Google Scholar]
- 30.Kubelka J, Hofrichter J, Eaton WA. The protein folding ‘speed limit’. Curr Opin Struct Biol. 2004;14:76–88. doi: 10.1016/j.sbi.2004.01.013. [DOI] [PubMed] [Google Scholar]
- 31.Phillips JC, et al. Scalable molecular dynamics with NAMD. J Comput Chem. 2005;26:1781–1802. doi: 10.1002/jcc.20289. [DOI] [PMC free article] [PubMed] [Google Scholar]
- 32.Aickin CC. Regulation of intracellular pH in smooth muscle cells of the guinea-pig femoral artery. J Physiol. 1994;479(Pt 2):331–340. doi: 10.1113/jphysiol.1994.sp020299. [DOI] [PMC free article] [PubMed] [Google Scholar]
- 33.Li H, Robertson AD, Jensen JH. Very fast empirical prediction and rationalization of protein pKa values. Proteins. 2005;61:704–721. doi: 10.1002/prot.20660. [DOI] [PubMed] [Google Scholar]
- 34.MacKerell JAD, et al. All-atom empirical potential for molecular modeling and dynamics studies of proteins. J Phys Chem B. 1998;102:3586–3616. doi: 10.1021/jp973084f. [DOI] [PubMed] [Google Scholar]
- 35.MacKerell AD, Jr, Feig M, Brooks CL., 3rd Improved treatment of the protein backbone in empirical force fields. J Am Chem Soc. 2004;126:698–699. doi: 10.1021/ja036959e. [DOI] [PubMed] [Google Scholar]
- 36.Caves LS, Evanseck JD, Karplus M. Locally accessible conformations of proteins: Multiple molecular dynamics simulations of crambin. Protein Sci. 1998;7:649–666. doi: 10.1002/pro.5560070314. [DOI] [PMC free article] [PubMed] [Google Scholar]
- 37.Weber W, Hünenberger PH, McCammon JA. Molecular dynamics simulations of a polyalanine octapeptide under Ewald boundary conditions: Influence of artificial periodicityon peptide conformation. J Phys Chem B. 2000;104:3668–3675. [Google Scholar]
- 38.Darden T, York D, Pedersen L. Particle mesh Ewald: An N·log(N) method for Ewald sums in large systems. J Chem Phys. 1993;98:10089–10092. [Google Scholar]
- 39.Essmann U, Perera L, Berkowitz ML. A smooth particle mesh Ewald method. J Chem Phys. 1995;103:8577–8593. [Google Scholar]
Associated Data
This section collects any data citations, data availability statements, or supplementary materials included in this article.


