

Abstract
Molecular motors move many intracellular cargos along microtubules. Recently it has been hypothesized that in vivo cargo velocity can be used to determine the number of engaged motors. We use theoretical and experimental approaches to investigate these assertions, and find that this hypothesis is inconsistent with previously described motor behavior, surveyed and re-analyzed in this paper. Studying lipid droplet motion in Drosophila embryos, we compare transport in a mutant, Δ(halo), with that in wild-type embryos. The minus-end moving cargos in the mutant appear to be driven by more motors (based on in vivo stall force observations). Periods of minus-end motion are indeed longer than in wild-type embryos but the corresponding velocities are not higher. We conclude that velocity is not a definitive read-out of the number of motors propelling a cargo.
Keywords: kinesin, dynein, molecular motors, intracellular transport, bi-directional transport, lipid droplets
Introduction
Intracellular transport along microtubules is wide-spread among eukaryotic organisms and transports both molecules and organelles. Moving cargos are typically driven by multiple motors [1–4]. Much of this transport is bi-directional [5, 6], including mRNA particles [7], mitochondria [2, 8], virus particles [9, 10], neuronal vesicles [11], etc. Typically, travel in a given direction (a “run”) is short (1–2 μm) [1] though longer runs (~10 μm) are observed in some systems [10, 12, 13]. This observation is surprising since in vitro work suggests that when cargos are moved by multiple motors, they have very long run lengths [6, 14, 15]. In vivo, net transport of bi-directional cargos is ultimately controlled by the direction-switching rate[16, 17], which is used to control how much time a cargo spends moving toward the plus versus minus-end of the microtubules.
Mechanistically, how runs end is still unclear. Bi-directionally moving cargos may control run length via a ‘switching’ mechanism that coordinates opposite polarity motors by turning off the engaged set and turning on the resting set [18]. No physical mechanism has been established for such a switch. One hypothesis proposes that opposing load exerted on the cargo decreases both the cargo’s run length and velocity, and that other potential velocity regulation pathways, e.g. biochemical regulation, are of secondary importance. This proposal stems from in vitro observations [19–21] showing that load on a motor decreases its processivity and velocity. Thus, if motors share the load opposing cargo motion, then removal of a motor from the engaged motor pool will increase load on a per-motor basis, and thus decrease cargo velocity. In general, then, determining changes in the number of engaged motors is of interest in clarifying the regulatory process controlling how far cargos move.
Three studies [3, 4, 22] suggest that cytosolic viscous drag experienced by moving cargos is the dominant contributor to load opposing the motion of the cargos, and of sufficient magnitude to significantly slow down the motors. If so, a cargo could only speed up due to an increase in propulsion force. Therefore, observed velocity changes of the cargo should reflect the number of engaged motors. We refer to this model as Velocity Evinces Number of Motors (VENoM) model for saltatory motion. From this model it follows that faster cargos should have higher stall forces. If an additional mechanism terminating runs is not proposed, it is assumed that runs end due to random detachment of motors, where the viscous-drag induced load decreases the individual motors’ processivity, promoting their detachment. Then, it is expected that more motors would take longer to detach, so cargos moved by more motors (at higher velocities) should travel greater distances. Similarly, due to the random gradual detachment, the velocity at the end of a run should be lower due to the motor disengagement that leads to the run termination.
Here we investigate whether the general VENoM model provides a consistent picture of in vivo transport, and also the applicability of the more specialized model that postulates stochastic run termination. First, we survey existing studies of in vivo cargo velocity distributions, and use these results with the VENoM model to derive the in vivo load-velocity relationship for molecular motors. Strikingly, the derived load-velocity relationships are qualitatively—as well as quantitatively—inconsistent with known motor behavior. We also present a combined biophysical/genetic study to test both the prediction the general VENoM model, as well as the more limited model described above.
Comparing motion in Halo mutant and wild-type backgrounds, we find that cargos moved on average by more motors do not move faster, thus invalidating the general VENoM model hypothesizing that changes in transport velocities are primarily due to changes in the number of engaged motors. This agrees with recent work that demonstrates other sources of variation in cargo velocity. The more specific model–that there is significant load, and that runs end by random detachment of motors—is unlikely because runs that travel longer distances do not have a higher velocity. Further, at least for plus-end moving cargos, run velocities do not decrease close to the end. We end by considering what can be learned from a careful analysis of cargo velocity.
Methods
Oregon-R was the wild-type stock; the Δ(halo) stock was described previously[23]. Real-time bi-directional movement of lipid droplets along microtubules in Drosophila embryos is measured at 30 fps. Droplets appear as distinct shadowed circles in DIC images (Fig. 2A, arrow). Here, motion is analyzed in phase II of development [1] when lipid droplets move on average towards the plus ends of microtubules. Each unidirectional run may be ended by a reversal in the direction of motion, or by the lack of motion when the cargo pauses (Fig. 2B). We developed a program that parses the time series of droplet positions into a sequence of runs and pauses [14, 24].
Figure 2.
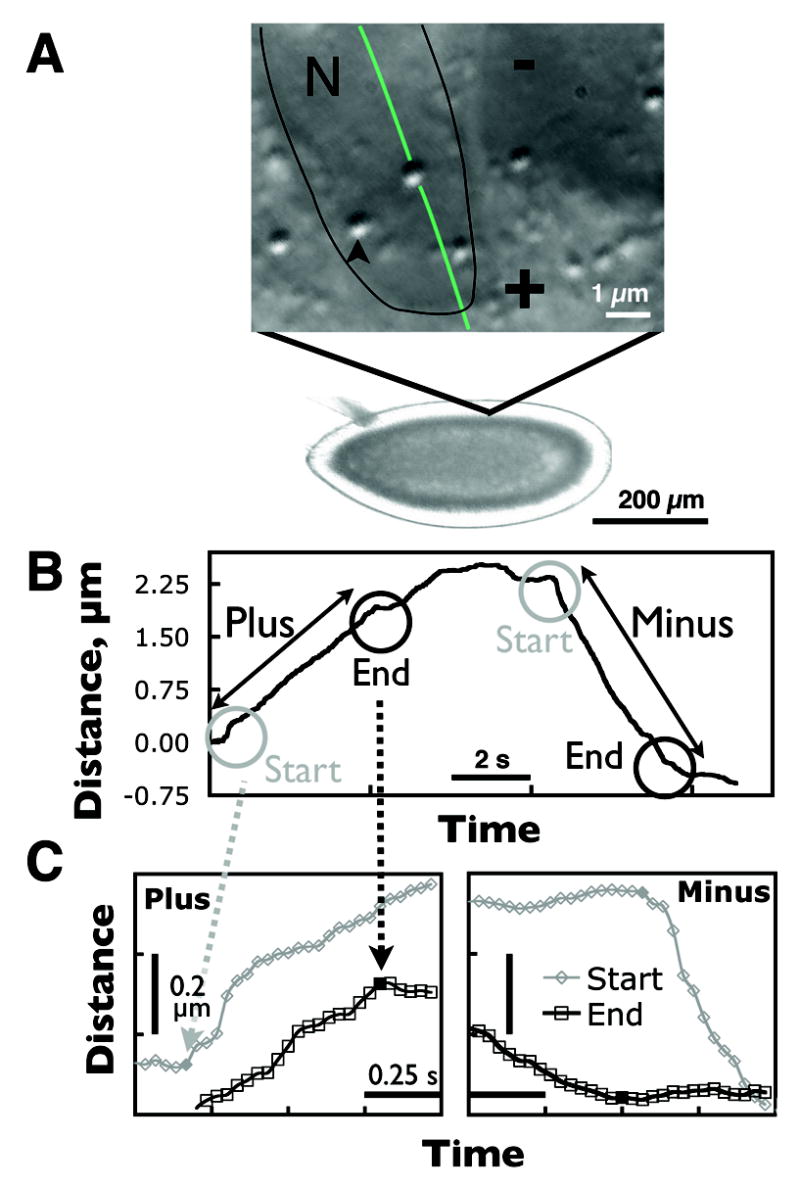
(A) A brightfield image of a developing Drosophila embryo with a high magnification DIC image showing the lipid droplets (arrow). Lipid droplets move along microtubules surrounding the nuclei (N, outlined in black). The direction of motion of a lipid droplet along such a microtubule is shown in green. (B) An example of a lipid droplet track with a long plus and a long minus run separated by a sequence of shorter runs and pauses. The detailed view in (C) shows the start and end of the plus and minus runs. The start and end points are highlighted by filled points. Minus runs exhibit distinct slow-down at the ends of runs.
Particle tracking
As described[1], dechorionated embryos were flattened into halocarbon oil. The data presented here is from analysis of 13 wild-type and 7 Δ(halo) embryos [1, 23]. Video-enhanced differential interference contrast (DIC) microscopy recordings of moving droplets were acquired onto videotape with a 100x 1.4 NA plan-apo objective and a 2.5x magnifying lens in front of the video camera [1, 16, 25]. Sequences from the recording (usually of approximately 1.5 minute duration) were then analyzed. Location of individual droplets as a function of time was determined with few nanometer-level resolution [25] using centroid analysis for droplets that traveled a minimum distance of 0.5 μm perpendicular to the apical edge of the embryo. See Supplement for further details.
Results and Discussion
Force-velocity relationship in vivo: survey of existing results
The general VENoM model is that the primary source of load opposing motion comes from cytoplasmic viscous drag, and that this load is the primary regulator of cargo velocity. A more specialized version of the model further proposes that run lengths are determined by random detachment of engaged motors, promoted by this load. As mentioned above, in vitro molecular motor studies have shown that motor velocity depends on load [19–21] such that motors move faster when under less load. Further, there is evidence that when multiple motors work together under negligible opposing load, the catalytic rate of each individual motor is not altered [26]. Let us put the in vitro observations in the context of the VENoM models. Consider a cargo being moved by a few motors and opposed by some viscous drag. An increase in the number of engaged motors would then result in the total load being shared between more motors. This would lower the load experienced by each engaged motor and thus allow an increase in velocity of each motor (and hence the cargo). Conversely, a decrease in the number of engaged motors would lead to higher load per motor and hence lower cargo velocity. We now proceed to develop a mathematical implementation of the VENoM model.
We first assume that total load exerted on the cargo (F) is transmitted and shared equally between all N engaged motors [22]. The load per motor (L) is then:
| (1) |
The VENoM model assumes that viscous drag, as defined by Stokes law, is the biggest contributor to total opposing load. Incorporating this into (1) gives:
| (2) |
Here η is the viscosity of the medium in which the cargo with radius r moves at velocity v(N). We assume that viscosity and radius remain constant. Thus, L depends only on the number of engaged motors and the velocity at which they move. We can therefore define the relative load per motor (ℓ) as:
| (3) |
Note that the relative load per motor captures the shape of the force-velocity curve (FVC) for the engaged motors and, therefore, facilitates comparison between model systems.
To obtain the form of the in vivo FVCs of molecular motors we calculated the relative load per motor (Supplemental Table 1) using data from three different reports [3, 4, 22]. For neuronal vesicle transport velocities were normalized on a per-run basis by the authors. For the general VENoM model to be viable, the FVCs obtained in this fashion should at least satisfy one well-established property of molecular motors: a decrease in load should correspond to an increase in velocity [19–21]. Figure 1 shows the various velocities as a function of the relative load per motor - the predicted in vivo FVC. All of the predicted FVCs have in common that cargo velocity can increase while load per motor remains constant. This result is inconsistent with the known behavior of molecular motors where there is a one-to-one correspondence between load and velocity. This therefore suggests that the VENoM model for saltatory motion does not correctly describe the molecular events responsible for discrete changes in velocity during cargo transport.
Figure 1.
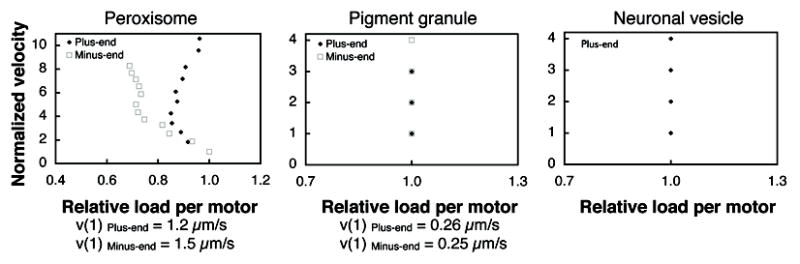
Normalized velocity as a function of relative load per motor due to viscous load (ℓ, Equation 3) from three studies of saltatory motion of intracellular cargos (Supplementary Table 1). Sustained velocities as a function of relative load per motor for plus and minus-end transport of Drosophila peroxisomes (left) [3] and Xenopous pigment organelles (center) [4] and plus-end vesicle transport in PC12 neurites [22]. In all cases, the load per motor given by the VENoM model does not appear to correlate with cargo velocity. The peroxisome and pigment organelle velocities were normalized by the velocity attributed to a single motor (v(1)). The neuronal vesicle transport was reported [26] already normalized on a per-run basis by the lowest motion velocity of each run (this was reported to be broadly distributed around v=0.44±0.009 μm/s).
More motors move cargos farther… but can be slower
Previously, we had investigated motion of lipid droplets in wild-type and mutant Drosophila embryos [1, 16, 18, 23]. Of particular interest for this work is the lipid droplet motion in mutant embryos where the Halo protein is absent [23]. Halo is a small, basic protein that is expressed zygotically in phase II of development of wild-type embryos. Our previously published force measurements in phase II of embryo development suggest that in the Δ(halo) background the number of minus-end motors moving lipid droplets is higher than in wild-type [23]. Furthermore, in wild-type embryos, there is net plus-end droplet transport in phase II, but the absence of the Halo protein results instead in net minus-end droplet transport during phase II. Past work indicated that this was due in large part to longer minus-end runs [23]. Cargo travel distances in in vitro model systems are known to increase as the average number of engaged motors increases [14, 15, 27]. The two above-mentioned observations (more engaged minus-end motors and longer minus-end run lengths) are consistent.
Crucially, the general VENoM model would further predict that velocities attained by more motors would also be higher. Therefore, according to the model, lipid droplets in Δ(halo) embryos are expected to move faster towards the minus-end compared with similar lipid droplet motion in wild-type embryos. We observe the exact opposite: the average velocities of minus-end runs are lower in Δ(halo) compared to wild-type (probability of 99.996% using a two-sided t-test) (Fig. 3). This result explicitly contradicts the VENoM model. It is important to note that if the load per motor is not significant, there in principle should be no correlation between the number of engaged motors and the cargo velocity, and to the extent that the motors’ enzymatic cycles are not perfectly synchronized, more motors ought to move more slowly1. It is these long runs that were used for force measurements.
Figure 3.
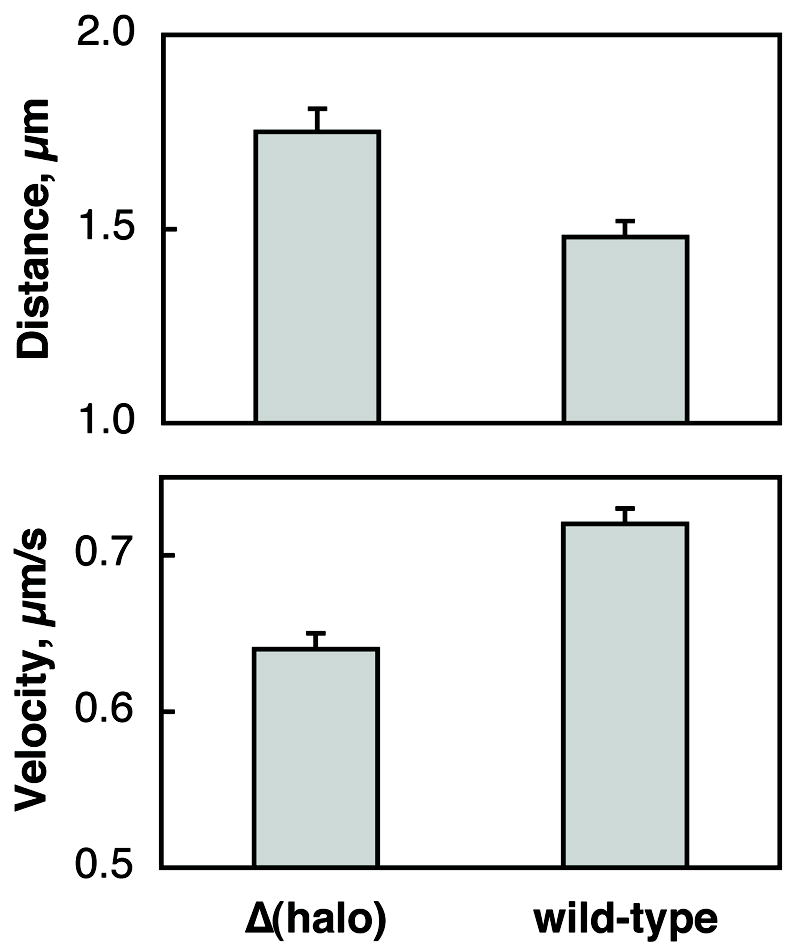
Average run-lengths and velocities in the minus-end directions. Δ(halo) minus runs are longer and slower than wild-type (two sided Student’s t test, p-value ≤ 10−4). These velocities are higher than previously reported because in this analysis we only used long runs ( ≥ 0.5 μm) [23].
The significance of changes in in vivo cargo velocity
Multiple factors can influence cargo velocity. First, blockages or alteration of the microtubule surface (via MAPs) or post-translational modifications could alter the motor velocity. Indeed, when blockages are present on a MT, it can alter how fast other motors move, and MT acetylation can alter velocity as well [27, 28]. Second, there could be alteration of a motor’s enzymatic cycle via phosphorylation, or accessory proteins. This has been suggested, e.g. for dynein’s ATPase being altered by Lis-1 [29]. Finally, large variations in average velocity are observed for quantum dots moving in the cytosol, even though the dots are small and are moved by only a single kinesin [30]. In conclusion, then, many factors in addition to changes in the number of motors can contribute significantly to the travel velocity of a cargo in vivo.
However, an evaluation of changes in cargo velocity throughout a run can clarify the extent to which there are stereotypical variations in motor function. So far, little is known about runs—is motor activity uniform throughout the run, or is there some set of changes that occur as the run progresses, ultimately favoring run termination? To investigate this possibility, we started with a visual screening of our data-set of runs similar to those in Figure 2. In many minus-end runs, the end appeared to have a period of velocity lower than the mean run velocity, and the start appeared to have a period of velocity higher than the mean run velocity.
To quantify the velocities at the beginning and end of runs, we needed a group of runs whose start and end were well defined. Thus, among the runs identified by the parsing program we only used the ones that were 0.5 μm or longer and were distinctly flanked by at least 0.3 s of opposite direction motion or a pause (see Supplement). These runs were then inspected to ensure that the parsing program correctly identified the run endpoints and, if necessary, the endpoints were readjusted. These criteria yielded 72 minus-end and 73 plus-end directed wild-type runs. To avoid artifacts due to possible imprecise endpoint determination we calculated the velocity over a sliding window of 0.3 s that moved from an end point, either start or end, into the run (Fig. 4A). The velocities obtained from the starts and ends were then compared to the overall mean velocity of the corresponding runs (Fig. 4B) using a one sided Student’s t-test.
Figure 4.
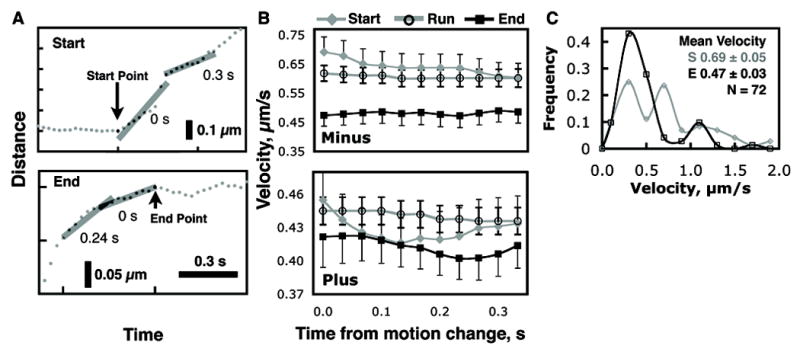
Thorough quantification of velocities at the start and end of runs reveals that velocities at the ends of minus runs are consistently lower up to 0.33 s from the endpoint. (A) The start and end velocities were calculated for a window 0.3 sec in duration that was made to slide into the run for a total of 0.3 sec as illustrated. (B) Mean start, end, and overall run velocities are compared for minus and plus runs. This procedure was followed to avoid artifacts resulting from imprecise determination of endpoints. In general, end velocities are lower than start and overall average run velocities. All end velocities of minus runs are statistically different from corresponding group velocities (one sided t-test, p-value ≤ 0.01). All start and end plus velocities are within measurement error of mean run velocity. Error bars are drawn on one side for clarity. (The number of runs used for this Figure ranged from 72 to 59 for minus-end motion and from 71 to 67 for plus-end motion). (C) Velocity distributions for the start and end of minus runs show a shift towards lower velocities at the ends of the runs.
This analysis confirmed our initial impression: minus runs end at velocities that are statistically significantly lower—over a period of 0.33 s from the endpoint—than the mean run velocity (Fig. 4B), and in addition velocities are slightly higher at the start of runs. This was not true for plus-end runs, which have velocities that are statistically indistinguishable from the mean velocities of the corresponding runs (however this may be due to our limited temporal resolution). Note that the latter negative result suggests that our minus-end observations are not an artifact of our analysis. Another control using artificially generated data is presented in Supplement Fig. S1. In addition to the changing average velocity, we found that the shape of the distribution of velocities is different (ANOVA p = 0.0009, Chi2 p = 0.002) at the start and end of runs (Fig. 4C). At the start, there can be significant variation in the catalytic rate of the engaged motors, but at the ends of runs function is more homogenous, with a prominent peak at 0.3 μm/s. Combined, these measurements suggest an evolution of motor function from start to end of minus-end runs, favoring the hypothesis that there is a sequence of events involved in favoring run termination, as opposed to a single event that occurs and immediately results in the run ending. Obviously, the nature of the sequence of events remains to be investigated, e.g. through the use of different mutants that alter motor function. The significant differences observed between plus-end and minus-end run evolution are intriguing, and are discussed more in the supplement.
Conclusion
Previous studies proposed that discrete peaks in cargo velocity distributions are due to different numbers of engaged molecular motors moving a cargo against viscous drag. The model used in those studies (the VENoM model) relies on two major assumptions. First, that effective viscosity is independent of cargo velocity and second, that changes in cargo velocity can be directly attributed to the changes in the number of engaged motors. We implemented this model mathematically to calculate the load per motor for reported discrete transport velocities and the corresponding number of motors. With this data we obtained the shape of the force-velocity curves of the molecular motors in vivo and found that it was inconsistent with known molecular motor behavior. Clearly, either one or both of the above assumptions need to be reconsidered to provide a plausible theory describing existing observations.
Further, from analysis of lipid droplet transport in wild-type and Δ(halo) embryos, we find that cargo velocity need not correlate with either cargo travel length or the number of engaged motors contrary to the VENoM model prediction. Taken together, this suggests that the VENoM model is likely in need of substantial revision.
Our additional studies on details of velocity changes suggest that minus-end motor function changes significantly throughout the course of runs, so that the run process itself is not stationary. This is intriguing, because motors moving cargos in vitro are stationary, so this observation suggests fundamental differences between motor function in vitro and in vivo. The observation of dynamic changes over such a short time is an exciting avenue for future research.
Supplementary Material
Acknowledgments
This work was supported by National Institute of General Medical Sciences (NIGMS) grant GM 64624-01. J.E.M. was supported by the Ford Foundation Predoctoral Fellowship and the Alliance for Graduate Education and the Professoriate (AGEP). G.T.S. is a Paul Sigler/Agouron Fellow of the Helen Hay Whitney Foundation. M.D.V. is supported by NIH Ruth L. Kirschstein NRSA postdoctoral fellowship.
We thank Dimitri Petrov for his help in generating the simulated data and in the use of the parsing program. We also thank Michael Welte for providing the Δ(halo) stock.
Footnotes
Note that the velocities reported here are higher than those previously presented by Gross et al. [23] because those measurements reflect the velocity of ALL minus-end motion, and in this analysis we are only examining long runs (referred to as long-fast runs in the previous study).
Publisher's Disclaimer: This is a PDF file of an unedited manuscript that has been accepted for publication. As a service to our customers we are providing this early version of the manuscript. The manuscript will undergo copyediting, typesetting, and review of the resulting proof before it is published in its final citable form. Please note that during the production process errors may be discovered which could affect the content, and all legal disclaimers that apply to the journal pertain.
References
- 1.Welte MA, et al. Developmental regulation of vesicle transport in Drosophila embryos: forces and kinetics. Cell. 1998;92(4):547–57. doi: 10.1016/s0092-8674(00)80947-2. [DOI] [PubMed] [Google Scholar]
- 2.Gennerich A, Schild D. Finite-particle tracking reveals submicroscopic-size changes of mitochondria during transport in mitral cell dendrites. Phys Biol. 2006;3:1–9. doi: 10.1088/1478-3975/3/1/005. [DOI] [PubMed] [Google Scholar]
- 3.Kural C, et al. Kinesin and dynein move a peroxisome in vivo: a tug-of-war or coordinated movement? Science. 2005;308(5727):1469–72. doi: 10.1126/science.1108408. [DOI] [PubMed] [Google Scholar]
- 4.Levi V, et al. Organelle transport along microtubules in Xenopus melanophores: evidence for cooperation between multiple motors. Biophys J. 2006;90(1):318–27. doi: 10.1529/biophysj.105.067843. [DOI] [PMC free article] [PubMed] [Google Scholar]
- 5.Welte MA. Bidirectional transport along microtubules. Curr Biol. 2004;14(13):R525–37. doi: 10.1016/j.cub.2004.06.045. [DOI] [PubMed] [Google Scholar]
- 6.Gross SP. Hither and yon: a review of bi-directional microtubule-based transport. Phys Biol. 2004;1(1–2):R1–11. doi: 10.1088/1478-3967/1/2/R01. [DOI] [PubMed] [Google Scholar]
- 7.Bullock SL, Zicha D, Ish-Horowicz D. The Drosophila hairy RNA localization signal modulates the kinetics of cytoplasmic mRNA transport. Embo J. 2003;22(10):2484–94. doi: 10.1093/emboj/cdg230. [DOI] [PMC free article] [PubMed] [Google Scholar]
- 8.Morris RL, Hollenbeck PJ. Axonal transport of mitochondria along microtubules and F-actin in living vertebrate neurons. J Cell Biol. 1995;131(5):1315–26. doi: 10.1083/jcb.131.5.1315. [DOI] [PMC free article] [PubMed] [Google Scholar]
- 9.McDonald D, et al. Visualization of the intracellular behavior of HIV in living cells. J Cell Biol. 2002;159(3):441–52. doi: 10.1083/jcb.200203150. [DOI] [PMC free article] [PubMed] [Google Scholar]
- 10.Smith GA, Gross SP, Enquist LW. Herpesviruses use bidirectional fast-axonal transport to spread in sensory neurons. Proc Natl Acad Sci U S A. 2001;98(6):3466–70. doi: 10.1073/pnas.061029798. [DOI] [PMC free article] [PubMed] [Google Scholar]
- 11.Leopold PL, et al. Nucleotide specificity for the bidirectional transport of membrane-bounded organelles in isolated axoplasm. Cell Motil Cytoskeleton. 1990;15(4):210–9. doi: 10.1002/cm.970150404. [DOI] [PubMed] [Google Scholar]
- 12.Smith GA, et al. Local modulation of plus-end transport targets herpesvirus entry and egress in sensory axons. Proc Natl Acad Sci U S A. 2004;101(45):16034–9. doi: 10.1073/pnas.0404686101. [DOI] [PMC free article] [PubMed] [Google Scholar]
- 13.Enquist LW, et al. Directional spread of an alpha-herpesvirus in the nervous system. Vet Microbiol. 2002;86(1–2):5–16. doi: 10.1016/s0378-1135(01)00486-2. [DOI] [PubMed] [Google Scholar]
- 14.Mallik R, et al. Building complexity: an in vitro study of cytoplasmic dynein with in vivo implications. Curr Biol. 2005;15(23):2075–85. doi: 10.1016/j.cub.2005.10.039. [DOI] [PubMed] [Google Scholar]
- 15.Vershinin M, et al. Multiple-motor based transport and its regulation by Tau. Proc Natl Acad Sci U S A. doi: 10.1073/pnas.0607919104. in press. [DOI] [PMC free article] [PubMed] [Google Scholar]
- 16.Gross SP, et al. Dynein-mediated cargo transport in vivo. A switch controls travel distance. J Cell Biol. 2000;148(5):945–56. doi: 10.1083/jcb.148.5.945. [DOI] [PMC free article] [PubMed] [Google Scholar]
- 17.Rodionov V, et al. Switching between microtubule- and actin-based transport systems in melanophores is controlled by cAMP levels. Curr Biol. 2003;13(21):1837–47. doi: 10.1016/j.cub.2003.10.027. [DOI] [PubMed] [Google Scholar]
- 18.Gross SP, et al. Coordination of opposite-polarity microtubule motors. J Cell Biol. 2002;156(4):715–24. doi: 10.1083/jcb.200109047. [DOI] [PMC free article] [PubMed] [Google Scholar]
- 19.Toba S, et al. Overlapping hand-over-hand mechanism of single molecular motility of cytoplasmic dynein. Proc Natl Acad Sci U S A. 2006;103(15):5741–5. doi: 10.1073/pnas.0508511103. [DOI] [PMC free article] [PubMed] [Google Scholar]
- 20.Visscher K, Schnitzer MJ, Block SM. Single kinesin molecules studied with a molecular force clamp. Nature. 1999;400(6740):184–9. doi: 10.1038/22146. [DOI] [PubMed] [Google Scholar]
- 21.Svoboda K, Block SM. Force and velocity measured for single kinesin molecules. Cell. 1994;77(5):773–84. doi: 10.1016/0092-8674(94)90060-4. [DOI] [PubMed] [Google Scholar]
- 22.Hill DB, et al. Fast vesicle transport in PC12 neurites: velocities and forces. Eur Biophys J. 2004;33(7):623–32. doi: 10.1007/s00249-004-0403-6. [DOI] [PubMed] [Google Scholar]
- 23.Gross SP, et al. A determinant for directionality of organelle transport in Drosophila embryos. Curr Biol. 2003;13(19):1660–8. doi: 10.1016/j.cub.2003.08.032. [DOI] [PubMed] [Google Scholar]
- 24.Petrov, et al. in preparation. [Google Scholar]
- 25.Carter BC, Shubeita GT, Gross SP. Tracking single particles: a user-friendly quantitative evaluation. Phys Biol. 2005;2(1–2):60–72. doi: 10.1088/1478-3967/2/1/008. [DOI] [PubMed] [Google Scholar]
- 26.Howard J, Hudspeth AJ, Vale RD. Movement of microtubules by single kinesin molecules. Nature. 1989;342(6246):154–8. doi: 10.1038/342154a0. [DOI] [PubMed] [Google Scholar]
- 27.Reed NA, et al. Microtubule acetylation promotes Kinesin-1 binding and transport. Curr Biol. 2006;16(21):2166–72. doi: 10.1016/j.cub.2006.09.014. [DOI] [PubMed] [Google Scholar]
- 28.Seitz A, Surrey T. Processive movement of single kinesins on crowded microtubules visualized using quantum dots. Embo J. 2006;25(2):267–77. doi: 10.1038/sj.emboj.7600937. [DOI] [PMC free article] [PubMed] [Google Scholar]
- 29.Mesngon MT, et al. Regulation of cytoplasmic dynein ATPase by Lis1. J Neurosci. 2006;26(7):2132–9. doi: 10.1523/JNEUROSCI.5095-05.2006. [DOI] [PMC free article] [PubMed] [Google Scholar]
- 30.Courty S, et al. Tracking individual kinesin motors in living cells using single quantum-dot imaging. Nano Lett. 2006;6(7):1491–5. doi: 10.1021/nl060921t. [DOI] [PubMed] [Google Scholar]
Associated Data
This section collects any data citations, data availability statements, or supplementary materials included in this article.