Abstract
We report that the K12G mutation at triosephosphate isomerase (TIM) from Saccharomyces cerevisiae results in: (1) A ca. 50-fold increase in Km for the substrate glyceraldehyde 3-phosphate (GAP) and a 60-fold increase in Ki for competitive inhibition by the intermediate analog 2-phosphoglycolate, resulting from the loss of stabilizing ground state interactions between the alkylammonium side chain of Lys-12 and the ligand phosphodianion group. (2) A 12,000-fold decrease in kcat for isomerization of GAP, suggesting a tightening of interactions between the side chain of Lys-12 and the substrate on proceeding from the Michaelis complex to the transition state. (3) A 6 × 10⁵-fold decrease in kcat/Km, corresponding to a total 7.8 kcal/mol stabilization of the transition state by the cationic side chain of Lys-12. The yields of the four products of the K12G TIM-catalyzed isomerization of GAP in D2O were quantified as: dihydroxyacetone phosphate (DHAP), 27%; [1(R)-2H]-DHAP, 23%; [2(R)-2H]-GAP, 31%; and 18% methylglyoxal from an enzyme-catalyzed elimination reaction. The K12G mutation has only a small effect on the relative yields of the three products of proton transfer to the TIM-bound enediol(ate) intermediate in D2O, but it strongly favors catalysis of the elimination reaction to give methylglyoxal. The K12G mutation also results in a ≥ 14-fold decrease in kcat/Km for isomerization of bound glycolaldehyde (GA), although the dominant observed product of the mutant enzyme-catalyzed reaction of [1-13C]-GA in D2O is [1-13C, 2,2-di-2H]-GA from a nonspecific protein-catalyzed reaction. The observation that the K12G mutation results in a large decrease in kcat/Km for the reactions of both GAP and the neutral truncated substrate [1-13C]-GA provides evidence for a stabilizing interaction between the cationic side chain of Lys-12 and negative charge that develops at the enolate-like oxygen in the transition state for deprotonation of the sugar substrate "piece".
Triosephosphate isomerase (TIM) 1 catalyzes the stereospecific, reversible, 1,2-hydrogen shift at dihydroxyacetone phosphate (DHAP) to give (R)-glyceraldehyde 3-phosphate (GAP) by a single-base (Glu-165) proton transfer mechanism through an enzyme-bound cis-enediol(ate) intermediate (Scheme 1) (1, 2). The enzyme's low molecular weight (dimer, 26 kDa/subunit), high cellular abundance (3), and the centrality of proton transfer at carbon in metabolic processes (4–6) have made TIM a prominent target for studies on the mechanism of enzyme action (1, 7–10).
Scheme 1.
Deprotonation of the truncated neutral substrate (R)-glyceraldehyde by TIM is ca. 109-fold slower than the partly diffusion-controlled (11) turnover of the natural phosphorylated substrate GAP (12). We showed previously that more than 80% of the 4 × 10¹⁰-fold enzymatic rate acceleration for carbon deprotonation of GAP is derived from the 12 kcal/mol "intrinsic phosphate binding energy" (13) of the small nonreacting phosphodianion group of the substrate (12, 14). Similar intrinsic phosphate binding energies of 12 kcal/mol are observed for the decarboxylation reaction catalyzed by orotidine 5'-monophosphate decarboxylase (15) and the hydride transfer reaction catalyzed by glycerol 3-phosphate dehydrogenase (16).
We want to understand the source of the large 12 kcal/mol intrinsic phosphate binding energy for TIM. X-ray crystallographic analyses of TIM complexed with DHAP (7) or 2-phosphoglycolate (PGA) (10, 17) reveal interactions between the ligand phosphodianion group 6 and the backbone amide NH groups of Ser-211 in loop 7, Gly-232 and Gly-233 in loop 8, and of Gly-171 in the flexible "phosphate gripper" loop 6 (18).2 There should be little or no enthalpic advantage to stabilization of a TIM-bound ligand by hydrogen bonds between backbone amide NH groups and the ligand phosphodianion group, relative to its stabilization in aqueous solution by hydrogen bonding to water (19, 20). However, there is probably a significant entropic advantage to formation of a network of four effectively intramolecular hydrogen bonds to a TIM-bound ligand relative to formation of four intermolecular hydrogen bonds in aqueous solution, because the latter is accompanied by the loss in translational and rotational entropy of four water molecules (19, 20). Furthermore, hydrogen bonding to the backbone amide NH groups of Gly-232 and Gly-233 may be enhanced because these residues lie at the N-terminal end of a short α-helix that has its positive dipole directed toward the substrate phosphodianion group (18). We note however that it is difficult to examine by experiment the contribution of individual hydrogen bonds between substrate and backbone amide NH groups to the rate acceleration for TIM.
A major source of the intrinsic phosphate binding energy for TIM is the interaction between the substrate phosphodianion and the cationic alkylammonium side chain of Lys-12. The K12M mutant of yeast TIM was prepared in earlier work, but the effect of the mutation on the kinetic parameters could not be determined because the observed activity was due to contaminating wildtype TIM (21). This wildtype contaminant was presumed (21) to form as a result of rare errors in translation of the methionine codon (AUG) to give the product of translation of the closely related lysine codon (AAG). The observation of respectable activities for both the K12R and K12H mutants of yeast TIM, along with a distinctive pH-rate profile for 7 the K12H mutant, showed that a positively charged side chain at position 12 of TIM is required for the observation of robust enzymatic activity (21).
Electrostatic potential maps calculated from X-ray crystallographic data showed that the surface of the active site pocket for wildtype yeast TIM is cationic, while the corresponding surface for the K12M mutant is almost entirely anionic (22). These maps provided evidence that the cationic side chain of Lys-12 stabilizes the enzyme bound substrate phosphodianion. However, it is not clear whether this interaction is expressed entirely at the Michaelis complex (Km effect) or if it strengthens on proceeding to the transition state for deprotonation of bound substrate (kcat effect). We therefore aimed to characterize and quantify the effect of removal of the cationic side chain of Lys-12 on the activity of TIM, by substituting glycine for lysine at position 12. We have constructed the K12G mutant of yeast TIM by changing the native AAA lysine codon at position 12 to GGC coding for glycine. This substitution effectively eliminates the possibility of contamination by wildtype enzyme.
We report here the preparation of K12G mutant yeast TIM and determination of the effect of this mutation on both the kinetic parameters and the product distribution for the turnover of the natural substrate GAP and of the truncated neutral substrate [1-13C]-glycolaldehyde ([1-13C]-GA). A comparison of the kinetic parameters for the wildtype and K12G TIM-catalyzed reactions of GAP shows that the alkylammonium side chain of Lys-12 stabilizes the transition state for isomerization of GAP by 7.8 kcal/mol. Around 30% of this interaction is expressed at the Michaelis complex with GAP, but ca. 70% (5.6 kcal/mol) is expressed specifically at the transition state for deprotonation of GAP (kcat effect). We also observe a sizeable effect of the K12G mutation on the kinetic parameters for isomerization of the truncated substrate [1-13C]-GA to give [2-13C]-GA, which provides strong evidence for a stabilizing interaction between the cationic side chain of Lys-12 and negative charge that develops at the enolate-like oxygen in the transition state for deprotonation of this sugar substrate "piece".
MATERIALS AND METHODS
Materials
Glycerol 3-phosphate dehydrogenase from rabbit muscle (GPDH) and glycylglycine were from United States Biochemical. Bovine serum albumin (BSA) was from Roche. D,L-Glyceraldehyde 3-phosphate diethyl acetal (barium salt), dihydroxyacetone phosphate (lithium salt), 2-(N-morpholino)ethanesulfonic acid (MES), 3-(cyclohexylamino)-2-hydroxy-1-propanesulfonic acid (CAPSO), NADH (disodium salt) and Dowex 50WX4-200R were from Sigma. Triethanolamine hydrochloride (TEA.HCl) and imidazole were from Aldrich. 3-(N-Morpholino)propanesulfonic acid (MOPS) and ethylamine hydrochloride were from Fluka. Sodium phosphite (dibasic, pentahydrate) was from Riedel-de Haën (Fluka). [1-13C]-Glycolaldehyde (99% enriched with 13C at C-1, 0.09 M in water) was from Omicron Biochemicals. Deuterium oxide (99.9% D) and deuterium chloride (35% w/w, 99.9% D) were from Cambridge Isotope Laboratories. DEAE Sepharose (fast flow) was from GE Healthcare. Water was obtained from a Milli-Q Academic purification system. Imidazole was recrystallized from benzene. All other commercially available chemicals were reagent grade or better and were used without further purification.
2-Phosphoglycolic acid was prepared according to a literature procedure (23). The barium salt of D-glyceraldehyde 3-phosphate diethyl acetal was prepared by Dr. James Tait according to a literature procedure (24).
Preparation of Wildtype and K12G Mutant Yeast TIM
The plasmid containing the gene for wildtype TIM from Saccharomyces cerevisiae (25) and Escherichia coli strain DF502 (strepR, tpi−, and his−) whose DNA lacks the gene for TIM (26) were generous gifts from Professor Nicole Sampson.
Site-directed mutagenesis of yeast TIM to introduce the K12G mutation was carried out using Pfu Ultra High Fidelity DNA polymerase following the Stratagene protocol. The starting plasmid DNA (30 ng) was placed into a PCR reaction mixture containing 5 µL of 10x Pfu ultra buffer, 125 ng each of the forward and reverse mutagenesis primers, 5 µL of a 2 mM dNTP mixture and 2.5 units of Pfu Ultra High Fidelity DNA polymerase in a final volume of 50 µL. The parameters for the PCR were: 45 s at 95 °C followed by 17 cycles of 45 s at 95 °C, 1.5 min at 55 °C and 10 min at 68 °C. The primer used to introduce the K12G mutation, in which the altered codon is underlined, was:
5'-CT-TTC-TTT-GTC-GGT-GGT-AAC-TTT-GGC-TTA-AAC-GGT-TCC-AAA-CAA-TCC-3'
After completion of the PCR reaction, 30 units of DpnI were added to 30 µL of the reaction mixture followed by incubation for 1 h at 37 °C, in order to degrade the methylated template DNA. E. coli strain K802 was transformed with 1 µL of the DpnI digested PCR product. Several colonies containing possible mutants were picked and the plasmid DNA was purified using the QIAprep Miniprep Kit from Qiagen. The presence of the gene for K12G mutant TIM was verified by sequencing at the Roswell Park Cancer Institute (Buffalo, NY).
E. coli strain DF502 was transformed with the plasmid containing the gene for wildtype or K12G mutant yeast TIM and the proteins were expressed and purified according to published procedures, with ion exchange chromatography performed using DEAE Sepharose (27, 28). The purity of the protein in the individual column fractions was determined by gel electrophoresis. Fractions containing the desired TIM at better than ca. 95% purity were pooled and dialyzed against 20 mM TEA (pH 7.5).
Preparation of Solutions
Solution pH or pD was determined at 25 °C using an Orion model 720A pH meter equipped with a Radiometer pHC4006-9 combination electrode that was standardized at pH 7.00 and 4.00 or 10.00 at 25 °C. Values of pD were obtained by adding 0.40 to the observed reading of the pH meter (29).
[1-13C]-Glycolaldehyde (1 mL of a 90 mM solution in H2O) was reduced to a volume of ca. 100 µL by rotary evaporation. 5 mL of D2O was added and the volume was again reduced to ca. 100 µL by rotary evaporation. This procedure was repeated twice more and 900 µL of D2O was added to the final solution to give a volume of ca. 1 mL. The stock solution of [1-13C]-GA in D2O was stored at room temperature to minimize the content of glycolaldehyde dimer (30). The concentration of [1-13C]-GA in the stock solution was determined by 1H NMR spectroscopy, as described previously (28, 30, 31).
Solutions of GAP in D2O and of D,L-glyceraldehyde 3-phosphate (D,L-GAP) in H2O were prepared by hydrolysis of the corresponding diethyl acetals, as described previously (28, 32). The resulting solutions were stored at −20 °C. These solutions were adjusted to the appropriate pD or pH using 1 M NaOD or 1 M NaOH before use, after which they were again stored at −20 °C. The stock solution of PGA was prepared in D2O and was adjusted to pD 6.9 with 1 M NaOD before use. The concentration of PGA in the stock solution was determined by 1H NMR as follows: An aliquot (50 µL) of the stock solution of PGA was added to 700 µL of 30 mM imidazole buffer (pD 7.0, 20% free base). Comparison of the integrated areas of the signals due to the C-(4,5) protons of imidazole and the C-2 protons of PGA gave the concentration of PGA in the stock solution as 42 mM.
Buffered solutions of TEA, MES, MOPS, glycylglycine and carbonate in H2O were prepared by neutralization of the acidic form with sufficient 1 M NaOH to give the desired pH. Buffered solutions of acetate and CAPSO in H2O were prepared addition of sufficient 1 M HCl to the sodium salt to obtain the desired pH.
Before preparation of solutions in D2O, the bulk of the water of crystallization of Na2HPO3•5H2O was removed by drying in vacuo as described previously (30). The acidic protons of ethylamine hydrochloride were exchanged for deuterium by repeated dissolution in D2O followed by removal of the solvent under reduced pressure and drying in vacuo. The stock solution of EtND3+Cl− in D2O was adjusted to pD 6.7 using 1 M NaOD. Buffered solutions of imidazole and phosphite in D2O were prepared by dissolving the basic form, and where appropriate NaCl, followed by the addition of a measured amount of a stock solution of DCl to give the desired buffer ratio.
Enzyme Assays
All enzyme assays were carried out at 25 °C. One unit is the amount of enzyme that converts 1 µmol of substrate to product in 1 min under the specified conditions. Changes in the concentration of NADH were calculated using an extinction coefficient of 6220 M−1 cm−1 at 340 nm. GPDH was dialyzed at 4 °C against 20 mM TEA (pH 7.5) and was assayed by monitoring the oxidation of NADH by DHAP at 340 nm, as described previously (28). Dilute solutions of TIM were stabilized by the inclusion of 0.01% (0.1 mg/mL) BSA. The subunit concentration of wildtype or K12G yeast TIM in stock solutions was determined from the absorbance at 280 nm using an extinction coefficient of 2.55 × 10⁴ M−1 cm−1 that was calculated using the ProtParam tool available on the ExPASy server (33, 34). The concentration of GAP in stock solutions of GAP in D2O or of D,L-GAP in H2O was determined from the amount of NADH consumed during quantitative TIM-catalyzed isomerization of GAP to form DHAP that was coupled to the oxidation of NADH using GPDH.
The activities of wildtype and K12G mutant yeast TIM were determined by coupling the isomerization of GAP to form DHAP to the oxidation of NADH using GPDH (35). The standard assay mixture (1.0 mL) contained 30 mM TEA at pH 7.5, 0.2 mM NADH, 5 mM D,L-GAP (2.5 mM GAP) and ca. 1 unit of GPDH at I = 0.10 (NaCl). A low background velocity vo that is due mainly to the isomerization of GAP catalyzed by TIM that was present as an impurity in the commercial preparation of GPDH was determined over a period of 2 – 4 min. An aliquot of wildtype or K12G TIM was then added, and the total initial velocity vobsd was determined by monitoring the reaction for an additional 5 – 10 min. The initial velocity of the TIM-catalyzed reaction was then calculated as vi = vobsd − vo, where vo generally represented ≤ 2% of vobsd.
Values of Ki for competitive inhibition of wildtype and K12G mutant yeast TIM by PGA at pH 7.5 (30 mM TEA), 25 °C and I = 0.10 (NaCl) were determined using several concentrations of PGA up to 130 µM for wildtype or 2.1 mM for K12G mutant TIM.
pH-Rate Profile for Turnover of GAP by K12G TIM
The pH-dependence of kcat/Km for isomerization of GAP catalyzed by K12G mutant yeast TIM at 25 °C was determined using the 13 following buffers: pH 5.1, acetate; pH 5.6 and 6.3, MES; pH 7.1, MOPS; pH 7.5, TEA; pH 8.3, glycylglycine; pH 8.9, CAPSO; and pH 9.9, carbonate. The standard assay mixture (1.0 mL) contained 30 mM buffer, 0.2 mM NADH, 0.8 – 6 mM D,L-GAP (0.4 – 3 mM GAP) and ca. 1 unit of GPDH. The relative specific activity of the coupling enzyme GPDH was determined at each pH, and the amount used was adjusted so that the velocity of consumption of NADH was independent of the concentration of the coupling enzyme (35).
1H NMR Analyses
1H NMR spectra at 500 MHz were recorded in D2O at 25 °C using a Varian Unity Inova 500 spectrometer that was shimmed to give a line width of ≤ 0.7 Hz for each peak of the doublet due to the C-1 proton of GAP hydrate, or ≤ 0.5 Hz for the downfield peaks of the double triplet due to the C-1 proton of [1-13C]-GA hydrate. Spectra (16 – 64 transients) were obtained using a sweep width of 6000 Hz, a pulse angle of 90° and an acquisition time of 4 – 6 s, with zero-filling of the data to 128 K. To ensure accurate integrals for the protons of interest, a relaxation delay between pulses of 120 s (> 8T1) was used. Baselines were subjected to a first-order drift correction before determination of integrated peak areas. Chemical shifts are reported relative to HOD at 4.67 ppm.
K12G TIM-Catalyzed Reaction of GAP in D2O Monitored by 1H NMR
K12G TIM was exhaustively dialyzed at 4 °C against 10 mM imidazole (pD 7.9, 70% free base) in D2O at I = 0.10 (NaCl). The reaction of GAP (10 mM) in the presence of K12G TIM in D2O at pD 7.9 (10 mM imidazole), 25 °C and I = 0.15 (NaCl) was monitored by 1H NMR spectroscopy, as described in earlier work (32). The fraction of the remaining substrate GAP (fGAP) and the fraction of GAP converted to the products DHAP (fDHAP), d-DHAP (fd-DHAP), d-GAP (fd-GAP) and methylglyoxal (MG, fMG) at time t were determined from the integrated areas of the relevant 1H NMR signals (normalized using the signal due to the C-(4,5) protons of imidazole as an internal standard), as described previously (32). A control experiment was carried out in order to monitor the rate of the nonenzymatic elimination reaction of GAP (10 mM) to give methylglyoxal (14) in D2O at pD 7.9 (10 mM imidazole), 25 °C and I = 0.15 (NaCl).
K12G TIM-Catalyzed Reactions of [1-13C]-GA in D2O Monitored by 1H NMR
K12G TIM was exhaustively dialyzed at 4 °C against 30 mM imidazole (pD 7.0, 20% free base) in D2O at I = 0.10 (NaCl) for reactions in the absence of phosphite and/or EtND3+, or at I = 0.024 for reactions in their presence.
The K12G TIM-catalyzed reaction of [1-13C]-GA in D2O at pD 7.0 (Reaction 1) was initiated by adding 650 µL of enzyme (ca. 13 mg/mL) to 350 µL of a solution containing [1-13C]-GA and NaCl to give final concentrations of 20 mM [1-13C]-GA, 20 mM imidazole and 240 µM K12G TIM in D2O at pD 7.0 and I = 0.10 (NaCl). The K12G TIM-catalyzed reaction of [1-13C]-GA in D2O at pD 7.0 in the presence of 100 mM EtND3+ (Reaction 2) was initiated by adding 650 µL of enzyme (ca. 13 mg/mL) to 350 µL of a solution containing [1-13C]-GA and EtND3+ to give final concentrations of 20 mM [1-13C]-GA, 20 mM imidazole, 100 mM EtND3+ and 310 µM K12G TIM in D2O at pD 7.0 and I = 0.12. The K12G TIM-catalyzed reaction of [1-13C]-GA in D2O at pD 7.0 in the presence of 50 mM EtND3+ and 10 mM phosphite dianion (20 mM total phosphite) (Reaction 3) was initiated by adding 600 µL of enzyme (ca. 9 mg/mL) to 250 µL of a solution containing [1-13C]-GA, phosphite buffer (50% free base) and EtND3+ to give final concentrations of 20 mM [1-13C]-GA, 20 mM imidazole, 50 mM EtND3+, 10 mM phosphite dianion (20 mM total phosphite) and 290 µM K12G TIM in D2O at pD 7.0 and I = 0.12.
In each case, 750 µL of the reaction mixture was transferred to an NMR tube and 1H NMR spectra (32 transients) at 25 °C were recorded over a period of 4 – 7 days. The remaining portion of the reaction mixture was incubated at 25 °C and the activity of K12G TIM was monitored by periodic standard assay (see above). For Reaction 1 there was a ca. 20% drop in the activity of K12G TIM during 78 h at 25 °C. For Reactions 2 and 3 there was a ca. 40% drop in the activity of K12G TIM during 7 days at 25 °C.
The fraction of the remaining substrate [1-13C]-GA, fS, and the fraction of [1-13C]-GA converted to the identifiable products [1-13C, 2-2H]-GA and [1-13C, 2,2-di-2H2]-GA were determined from the integrated areas of the relevant 1H NMR signals (normalized using the signal due to the C-(4,5) protons of imidazole as an internal standard), as described previously (28).
Observed first-order rate constants, kobsd, for the disappearance of [1-13C]-GA were determined from the slopes of linear semi-logarithmic plots of reaction progress against time according to eq 1. Observed second-order rate constants for the total protein-catalyzed reactions of [1- 13C]-GA were calculated using eq 2, where fcar = 0.061 is the fraction of GA present in the reactive carbonyl form (30, 31) and [E] is the concentration of K12G TIM.
| (1) |
| (2) |
RESULTS
K12G TIM-Catalyzed Reaction of GAP in D2O
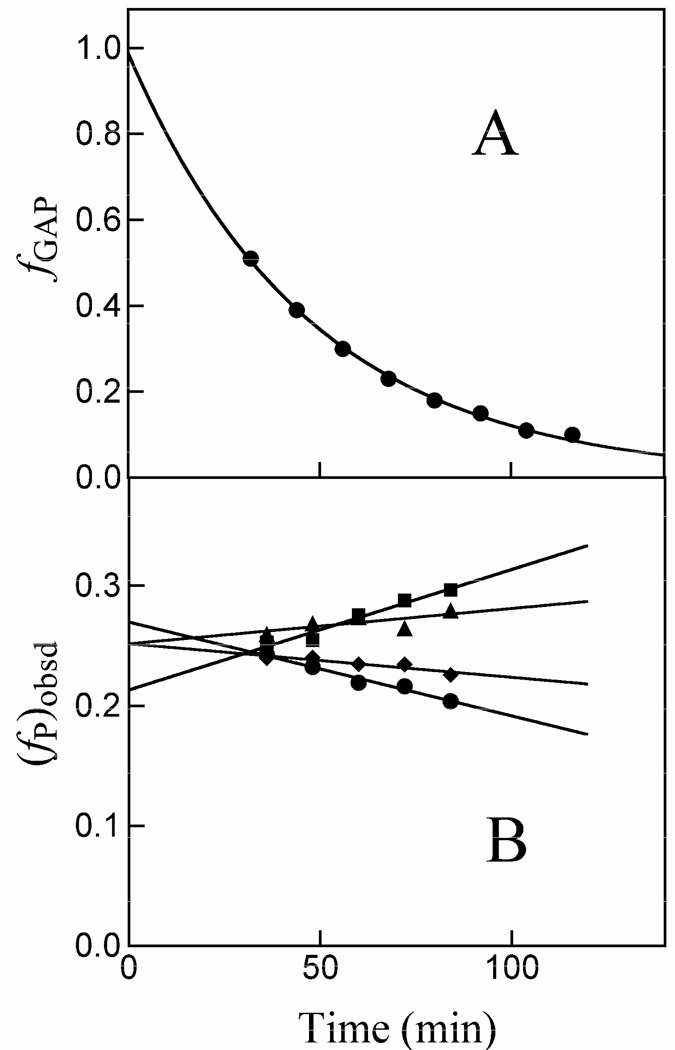
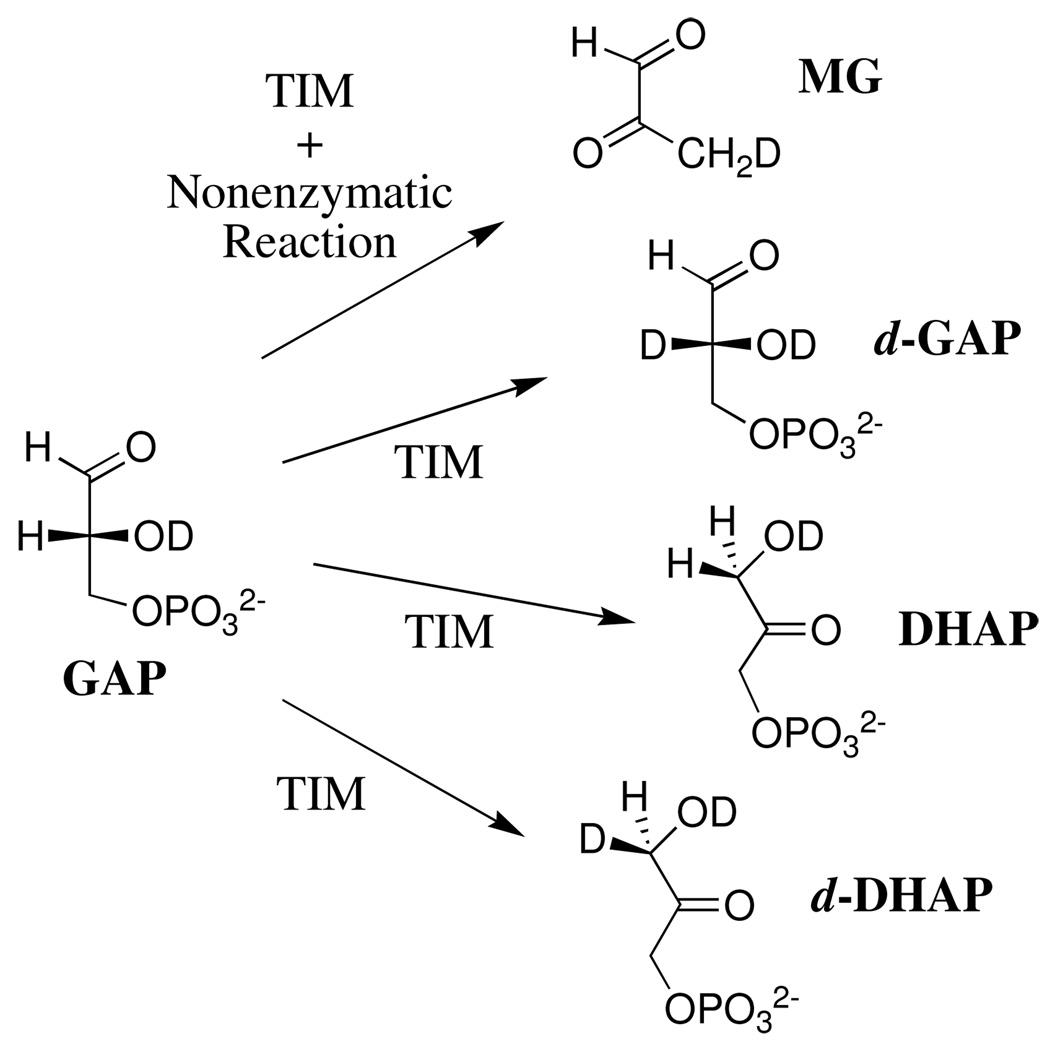
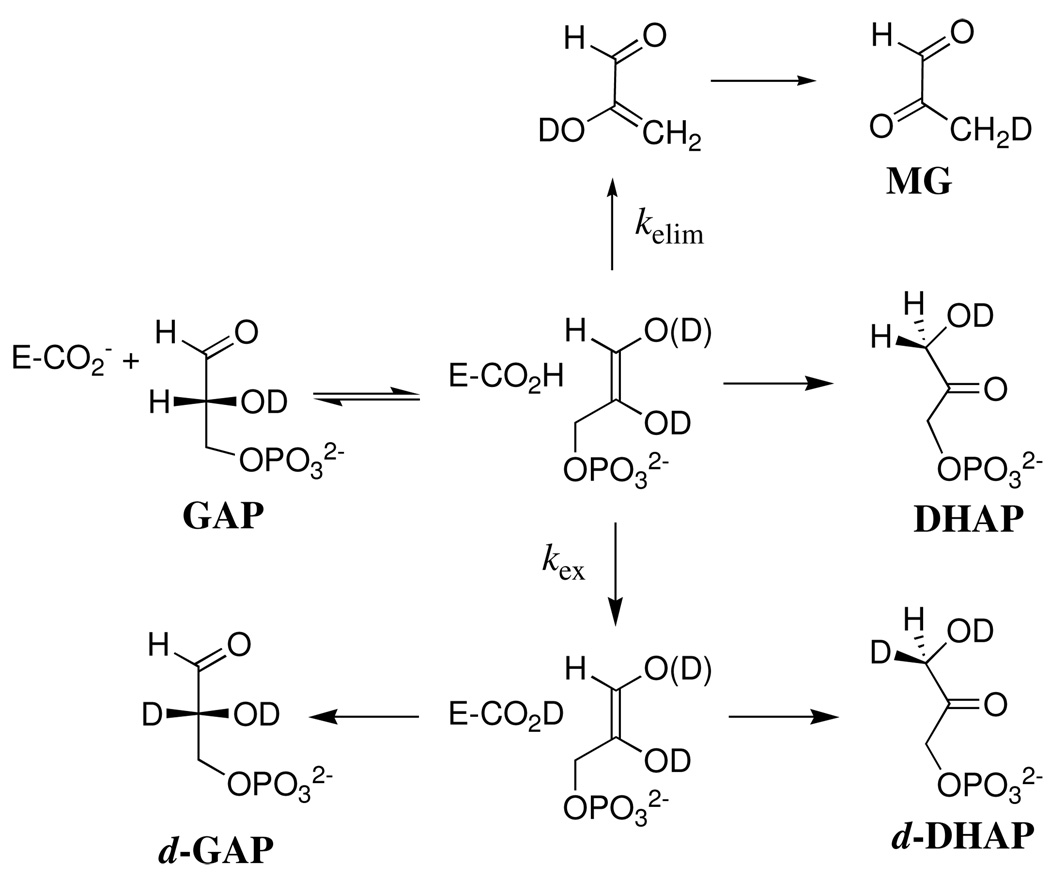
The disappearance of the substrate and the appearance of the products of the nonenzymatic and K12G TIM-catalyzed reactions of GAP in D2O was monitored by 1H NMR spectroscopy, as described in previous work (32). Figure 1A shows the time course for the disappearance of GAP (10 mM) catalyzed by 85 µM K12G TIM in D2O at pD 7.9 (10 mM imidazole), 25 °C and I = 0.15 (NaCl). The solid line shows the nonlinear least-squares fit of the experimental data to a single exponential which gave kobsd = 3.6 × 10⁻⁴ s−1 as the observed rate constant for disappearance of GAP (Table 1). Figure 1B shows the time dependence of the observed fractional yields of the four products of this reaction, (fP)obsd (P = DHAP, d-DHAP, d-GAP or MG). These fractional yields were calculated from the fraction of the particular product P (see Materials and Methods) and the sum of the fractions of all the products of both the enzymatic and nonenzymatic reactions of GAP using eq 3 (Scheme 2). There is no significant change in (fP)obsd for DHAP with time, but the changes with time in the observed fractional yields of d-DHAP (increasing) and d-GAP (decreasing) result from enzyme-catalyzed isomerization of d-GAP to give the thermodynamically favored product d-DHAP (32). Table 1 reports the initial fractional product yields, (fP)o for DHAP, d-DHAP and d-GAP, or (fMG)tot for MG, that were determined by extrapolation of the observed product yields (fP)obsd to zero time (intercepts in Figure 1B).
| (3) |
| (4) |
| (5) |
Figure 1.
Data for the reaction of GAP (10 mM) in the presence of 85 µM K12G TIM in D2O at pD 7.9 (10 mM imidazole), 25 °C and I = 0.15 (NaCl) monitored by 1H NMR spectroscopy. A. Timecourse for the first-order disappearance of the substrate GAP. B. Dependence of the observed fractional yields of the products on time. Extrapolation of these data to zero time (solid lines) gave the initial fractional yields of the products of the enzyme-catalyzed and nonenzymatic reactions of GAP, (fP)o or (fMG)tot = (fMG)N + (fMG)E reported in Table 1. (◆), Methylglyoxal; (■), d-DHAP; (▲), DHAP; (●), d-GAP.
Table 1.
Fractional Product Yields for the Reaction of (R)-Glyceraldehyde 3-Phosphate in the Presence of K12G Mutant Yeast Triosephosphate Isomerase in D2O.a
| [K12G TIM] |
kobsd (s −1)b |
MG (fMG)totc |
MG (fMG)Nd |
MG (fMG)Ee |
d-GAP (fP)of |
DHAP (fP)of |
d-DHAP (fP)of |
|
|---|---|---|---|---|---|---|---|---|
| 85 µM | 3.6 × 10⁻⁴ | 0.25 | 0.05 | 0.20 | 0.27 | 0.25 | 0.21 | |
| fEg | 0.21 | 0.28 | 0.26 | 0.22 | ||||
| (fE)PTh | 0.35 | 0.33 | 0.28 | |||||
| 12 µM | 8.2 × 10⁻⁵ | 0.34 | 0.21 | 0.13 | 0.26 | 0.22 | 0.19 | |
| fEg | 0.16 | 0.33 | 0.28 | 0.24 | ||||
| (fE)PTh | 0.40 | 0.33 | 0.29 | |||||
| Average Values | fEg | 0.18 ± 0.02 | 0.31 ± 0.03 | 0.27 ± 0.01 | 0.23 ± 0.01 | |||
| (fE)PTh | 0.38 (0.21)i |
0.33 (0.49)i |
0.29 (0.31)i |
|||||
Product distributions for the reaction of GAP (10 mM) at pD 7.9 (10 mM imidazole), 25 °C and I = 0.15 (NaCl) were determined by 1H NMR spectroscopy as described previously (32)
Observed first-order rate constant for disappearance of GAP in the presence of the indicated concentration of K12G TIM.
Total initial fractional yield of methylglyoxal determined by extrapolation of (fP)obsd to zero time (intercept in Figure 1B).
Initial fractional initial yield of methylglyoxal from the competing nonenzymatic reaction of GAP, calculated using eq 4.
Initial fractional yield of methylglyoxal from the enzymatic reaction of GAP, calculated using eq 5.
Initial fractional product yields determined by extrapolation of (fP)obsd to zero time (intercepts in Figure 1B).
Normalized fractional yields of the products of the enzymatic reaction of GAP, calculated using eq 9.
Normalized fractional yields of the three products of proton transfer to the enzyme-bound enediolate intermediate, calculated using eq 10.
Data for the wildtype enzyme from chicken muscle taken from previous work (32).
Scheme 2.
In a control experiment the nonenzymatic elimination reaction of GAP (10 mM) to form methylglyoxal (14) in D2O at pD 7.9 (10 mM imidazole), 25 °C and I = 0.15 (NaCl) was monitored by 1H NMR spectroscopy (32). The fit of the data to a single exponential gave the observed first-order rate constant for disappearance of GAP as kN = 1.7 × 10⁻⁵ s−1. This was combined with kobsd = 3.6 × 10⁻⁴ s−1 for the reaction of GAP in the presence of 85 µM K12G TIM, according to eq 4, to give the calculated fractional yield of methylglyoxal from the nonenzymatic elimination reaction in this experiment as (fMG)N = 0.05 (Table 1). The total initial fractional yield of methylglyoxal (fMG)tot = 0.25 (Table 1) is five-fold larger than (fMG)N because, unlike wildtype TIM, K12G TIM also catalyzes the elimination reaction of GAP to give methylglyoxal. The initial fractional yield of methylglyoxal from the K12G TIM-catalyzed reaction (fMG)E = 0.20 (Table 1) was calculated using eq 5.
K12G TIM-Catalyzed Reaction of [1-13C]-GA in D2O
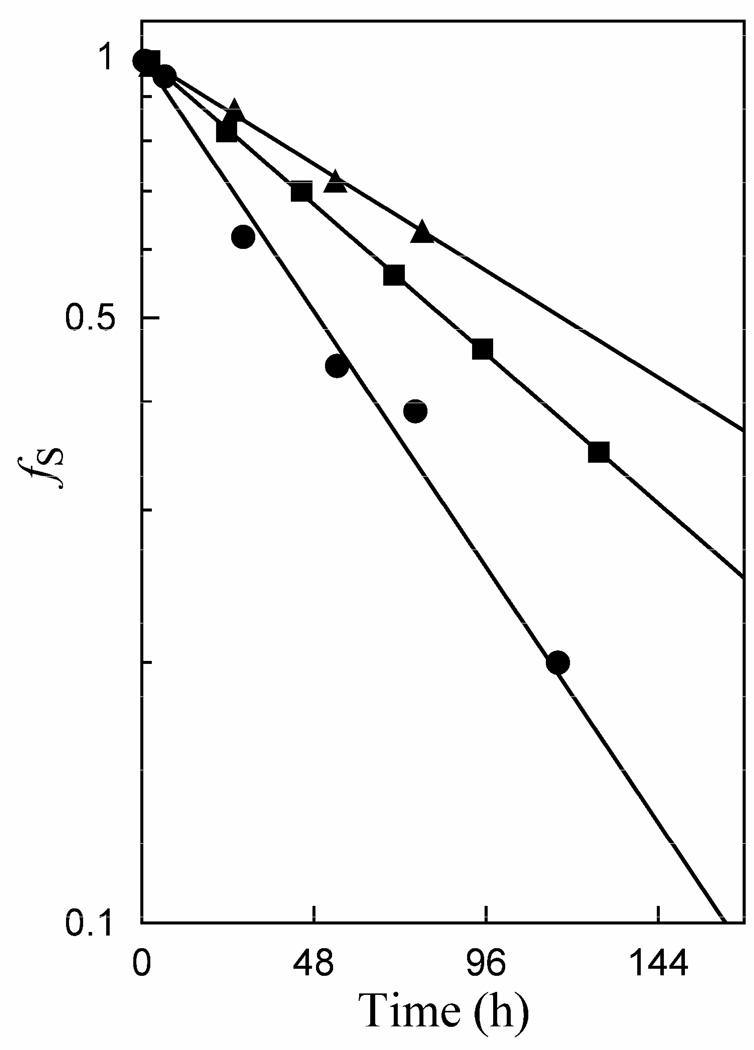
Figure 2 shows semi-logarithmic plots according to eq 1 of the time course for the disappearance of [1-13C]-GA in D2O at pD 7.0 (20 mM imidazole) and 25 °C, monitored by 1H NMR spectroscopy (28), in the presence of K12G TIM, K12G TIM and 100 mM EtND3+, or K12G TIM, 50 mM EtND3+ and 10 mM phosphite dianion (20 mM total phosphite). Table 2 gives the observed-first order rate constants for these reactions that were calculated from the slopes of these linear correlations that covered 1 – 2 half-times.
Figure 2.
Semi-logarithmic plots of the fraction of remaining substrate against time for the reaction of [1-13C]-glycolaldehyde in the presence of K12G TIM in D2O at pD 7.0 (20 mM imidazole) and 25 °C. The observed rate constants were determined from the slopes according to eq 1. (▲) 240 µM K12G TIM at I = 0.10; (■) 310 µM K12G TIM and 100 mM EtND3+ at I = 0.12; (●) 290 µM K12G TIM, 50 mM EtND3+ and 10 mM HPO32− at I = 0.12.
Table 2.
Rate and Product Data for the Reactions of [1-13C]-GA in the Presence of K12G Mutant Yeast Triosephosphate Isomerase and the Potential Activators EtND3+ and Phosphite Dianion in D2O.a
| Fractional Product Yield | ||||||||
|---|---|---|---|---|---|---|---|---|
| [K12G TIM] | Activator | kobsdb | (kcat/Km)obsdc | (kcat/Km)isod |
[2-13C]- GA |
[1-13C,2- 2H]-GA |
[1-13C, 2,2- di-2H2]-GA |
Totale |
| (s−1) | (M−1 s−1) | (M−1 s−1) | ||||||
| 240 µM | None f | 1.6 × 10⁻⁶ | 0.11 | ≤ 7 × 10⁻⁴ | ≤ 0.006 g | small | 0.56 | 0.56 |
| 310 µM | 100 mM EtND3+h | 2.3 × 10⁻⁶ | 0.12 | none detected |
0.10 | 0.20 | 0.30 | |
| 290 µM | 50 mM EtND3+ + 10 mM HPO32−h |
3.8 × 10⁻⁶ | 0.22 | none detected |
0.14 | 0.19 | 0.32 | |
Product distributions for the reaction of [1-13C]-GA (20 mM) at pD 7.0 (20 mM imidazole) and 25 °C were determined by 1H NMR spectroscopy as described previously (28)
Observed first-order rate constant for the disappearance of [1-13C]-GA.
Total observed second-order rate constant for the specific and nonspecific protein-catalyzed reactions.
Second-order rate constant for the specific K12G TIM-catalyzed isomerization of [1-13C]-GA to give [2-13C]-GA, calculated as the product of (kcat/Km)obsd = 0.11 M−1 s−1 and 0.006 as the upper limit on the fractional yield of [2-13C]-GA.
Total fractional yield of the identifiable products.
At I = 0.10 (NaCl).
Upper limit on the fractional yield of [2-13C]-GA, see text.
At I = 0.12 (NaCl).
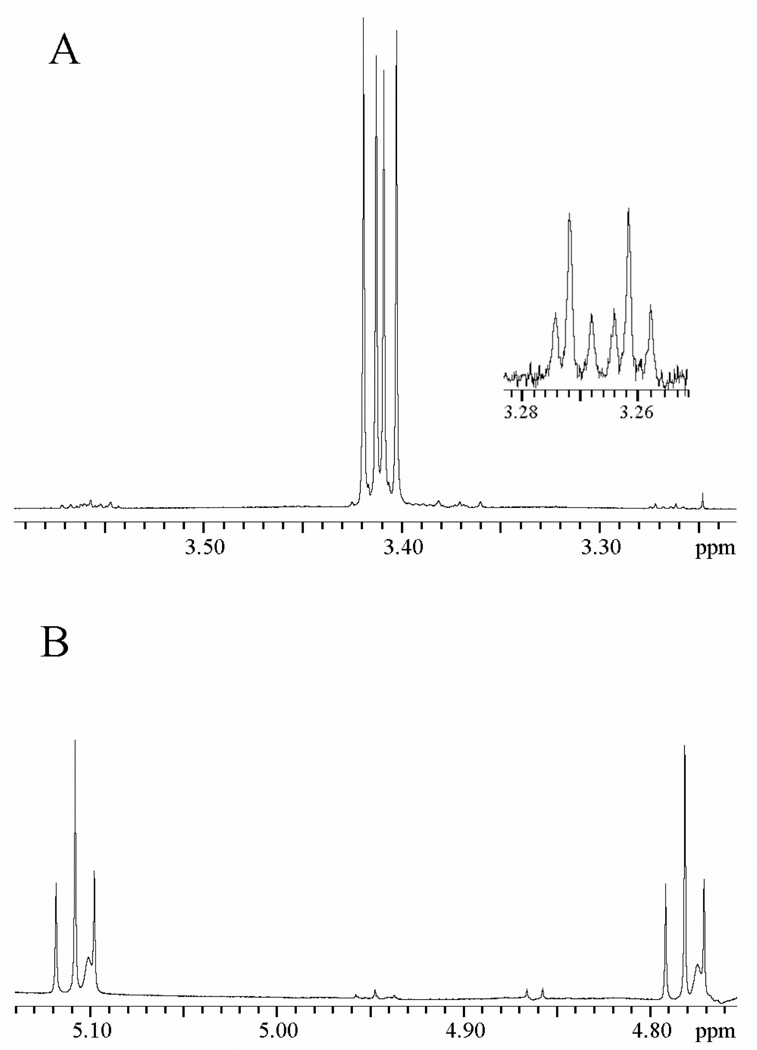
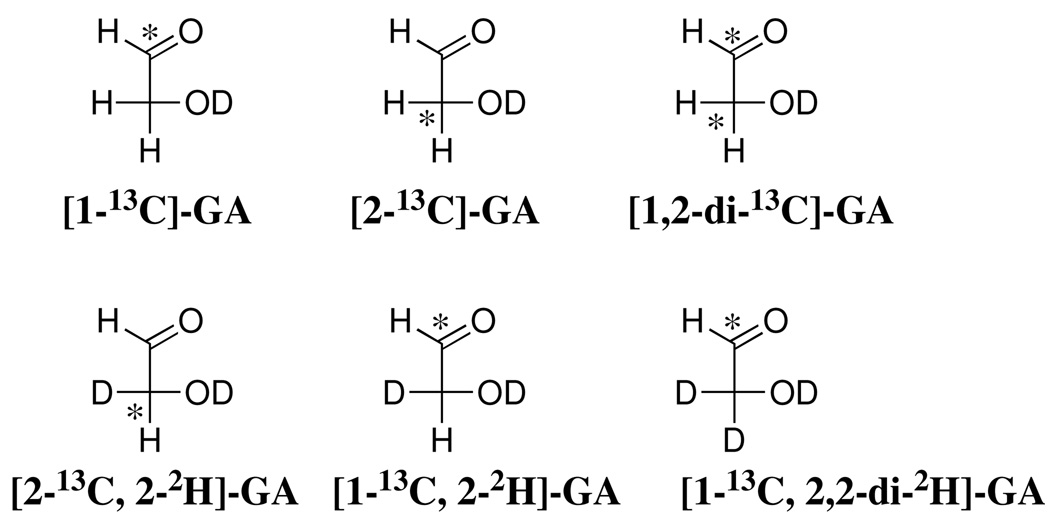
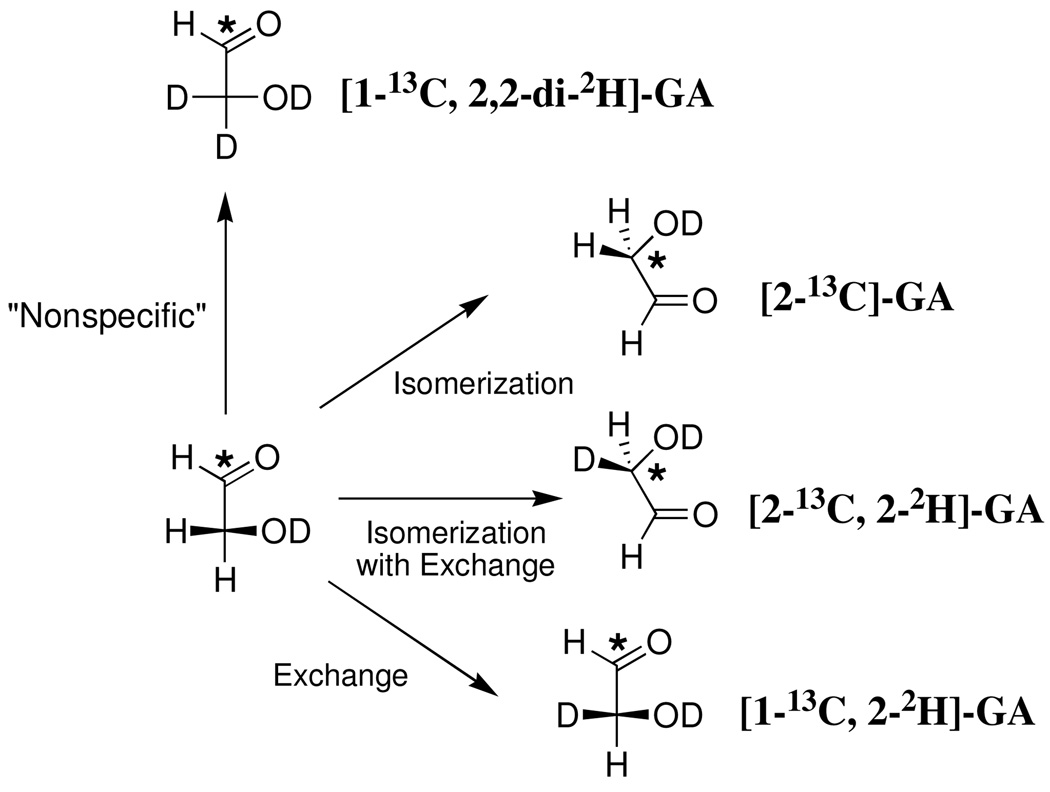
Figure 3 shows portions of the 1H NMR spectrum at 500 MHz of the reaction mixture obtained from the reaction of [1-13C]-GA for 78 h in the presence of 240 µM K12G TIM in D2O at pD 7.0 and 25 °C. Under our reaction conditions glycolaldehyde exists as 93.9%% hydrate and 6.1% free carbonyl form (30, 31) and the following chemical shifts refer to the hydrates of the isotopomers shown in Chart 1. The signal due to the C-1 proton of [1-13C]-GA appears as a double triplet at 4.945 ppm (1JHC = 163 Hz, 3JHH = 5 Hz) (Figure 3B). The signal due to the C-1 proton of [1-13C, 2,2-di-2H]-GA appears as a broad doublet (1JHC = 163 Hz) at 4.930 ppm that is shifted 0.015 ppm upfield from the double triplet due to the C-1 proton of [1-13C]-GA as a result of the two β-deuteriums (Figure 3B). The signal due to the C-2 protons of [1-13C]-GA appears as a double doublet at 3.410 ppm (2JHC = 3 Hz, 3JHH = 5 Hz) (Figure 3A). The signals due to the C-2 protons of [2-13C]-GA and [1,2-di-13C]-GA, present initially at 0.8% and 0.9%, respectively, in our commercial [1- 13 C]-GA, appear at 3.410 ppm as a double doublet (1JHC= 142 Hz, 3JHH = 5 Hz) and a double double doublet (1JHC = 142 Hz, 2JHC = 3 Hz, 3JHH = 5 Hz), respectively. Figure 3A (inset) shows the upfield peaks of these signals; the corresponding downfield peaks appear along with other small peaks for unidentified reaction products.
Figure 3.
Portions of the 1H NMR spectrum at 500 MHz of the reaction mixture obtained from the reaction of [1-13C]-GA (20 mM) for 78 h in the presence of 240 µM K12G TIM in D2O at pD 7.0, 25 °C and I = 0.10 (NaCl). A. The spectrum in the region of the C-2 hydron(s) of the isotopomers of GA. B. The spectrum in the region of the C-1 hydron of the isotopomers of GA.
Chart 1.
We observe that the major identifiable product of the reaction of [1- 13C]-GA in the presence of K12G mutant TIM in D2O is the doubly deuteriated isotopomer [1- 13C, 2,2-di- 2H-GA] which is formed in a nonspecific reaction occurring outside the active site (28). The fractional yield of this product, f P = 0.56 (Table 2), was calculated from the normalized peak area for its C-1 proton, AP, and the difference in the normalized peak area for the C-1 proton of the substrate [1- 13C]-GA at time zero, (AS)o, and at time t, AS, according to eq 6. The signal due to the C-2 proton of the product of isomerization with deuterium exchange, [2- 13 C, 2- 2H]-GA, would appear as a double double triplet at 3.389 ppm (1 JHC = 142 Hz, 3JHH = 5 Hz, 2JHD≈ 2 Hz) shifted 0.021 ppm upfield of the double doublet due to the C-2 protons of [2- 13C]-GA as a result of the α-deuterium (28). However, this signal was not observed in the spectrum shown in Figure 3A.
| (6) |
During the reaction of [1- 13C]-GA catalyzed by wildtype TIM in D2O we observed that enzyme-catalyzed isomerization of the substrate results in an increase in the peak area of the signals due to [2- 13C]-GA (28). By contrast, we observe here that the peak area of the signal due to the C-2 protons of [2- 13C]-GA (initially present as 0.8% of total GA) decreases during the reaction of [1- 13C]-GA for 78 h in the presence of 240 µM K12G mutant TIM in D2O. However, during this time there is a small increase in the ratio of the peak areas of the signals due to the C-2 protons of [2-13C]-GA and [1-13C]-GA from 0.008 to 0.010, but no change in the ratio (0.009) of the peak areas of the signals due to the C-2 protons of [1,2-di-13C]-GA and [1-13C]-GA. These changes in relative peak areas are consistent with essentially equal velocities of conversion of the three starting isotopomers to their corresponding C-2 doubly deuteriated analogs, for which there are no 1H NMR signals in the C-2 region, along with a very slow enzyme-catalyzed isomerization of [1-13C]-GA to give [2-13C]-GA. These data are consistent with conversion of ≤ 0.2% of [1-13C]-GA to [2-13C]-GA that accompanies the much faster conversion of 20% of [1-13C]-GA to [1-13C, 2,2-di-2H]-GA during this 78 hour reaction. Therefore, the fractional yield of [2-13C]-GA (≤ 0.006, Table 2) from the K12G TIM-catalyzed isomerization of [1-13C]-GA is estimated to be at least 100-fold smaller than the fractional yield of [1-13C, 2,2-di-2H]-GA (0.56).
Table 2 also gives the fractional yields of the identifiable products of the K12G TIM-catalyzed reactions of [1-13C]-GA in the presence of 100 mM EtND3+ or 50 mM EtND3+ and 10 mM phosphite dianion. These yields were calculated from the normalized peak areas of the signals due to these products using eq 6. In all cases, the sum of the fractional yields of the products of these slow reactions of [1-13C]-GA is well under 100% (28). No attempt was made to identify the other pathways for the slow reactions [1-13C]-GA in the presence of K12G TIM.
Kinetic Parameters and pH-Rate Profile for Isomerization of GAP by K12G TIM
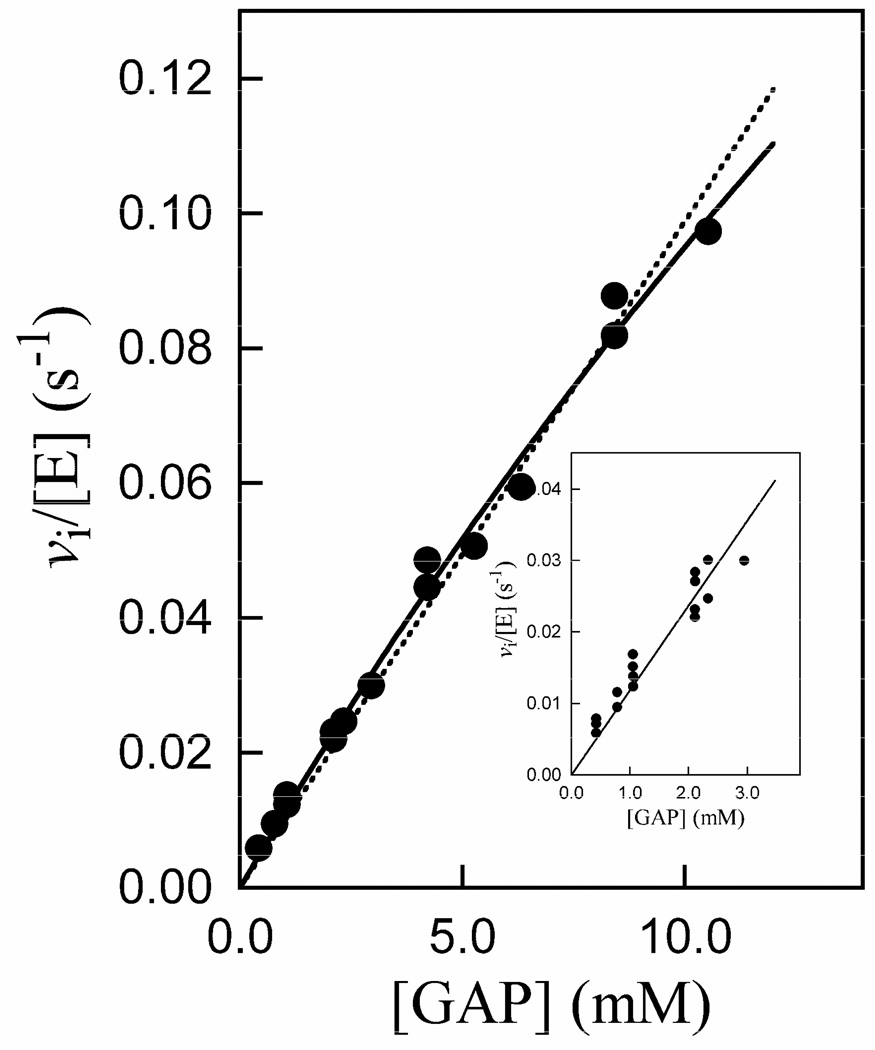
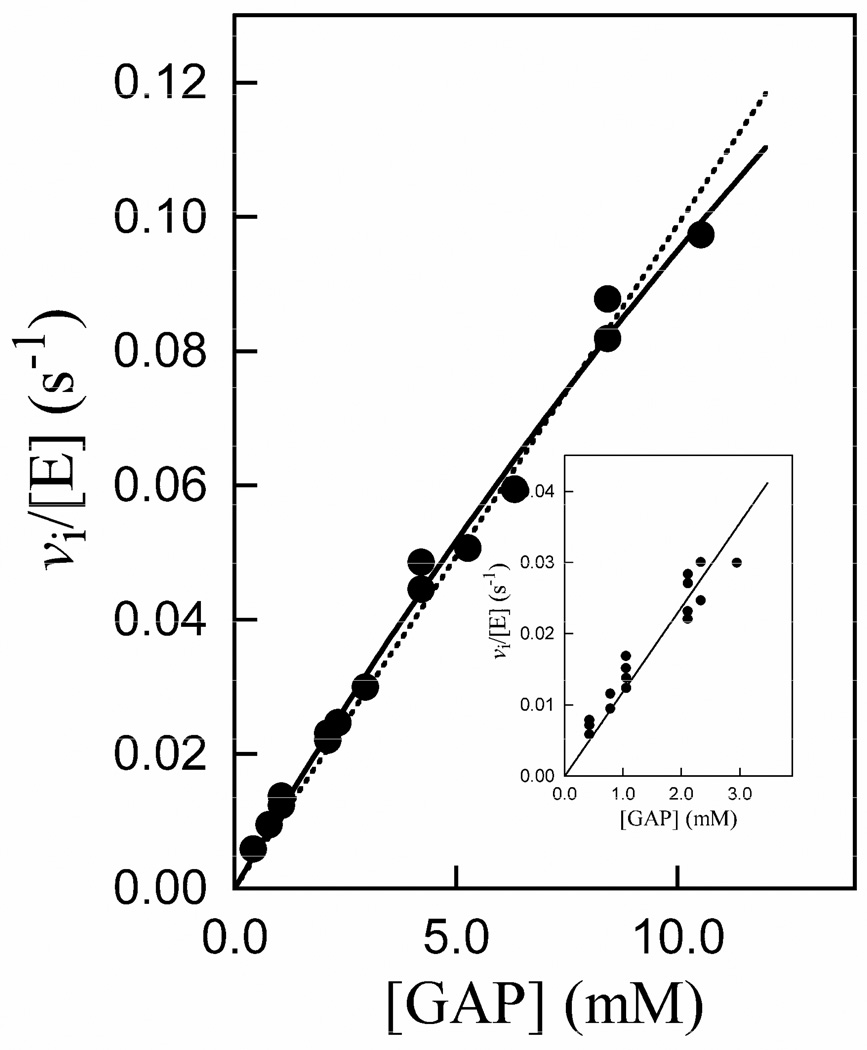
Figure 4 shows the Michaelis-Menten plot for the isomerization of GAP catalyzed by K12G mutant yeast TIM at pH 7.5 (30 mM TEA), 25 °C and I = 0.10 (NaCl). The solid line shows the nonlinear least squares fit of these data to the Michaelis-Menten equation which gave kcat = 0.6 ± 0.2 s−1 and Km = 50 ± 20 mM (Table 3); the dashed line is the linear relationship for the case [GAP] ≪ Km. Table 3 also gives the much more reliable value of kcat/Km = 12 ± 0.4 M−1 s−1 that was determined as the slope of the linear correlation of the data at [GAP] ≤3 mM (Figure 4, inset).
Figure 4.
Michaelis-Menten plot of initial velocity data for the isomerization of GAP catalyzed by K12G TIM at pH 7.5 (30 mM TEA), 25 °C and I = 0.10 (NaCl). The solid line is the fit of the data to the Michaelis-Menten equation, and the dashed line is the linear relationship for the case [GAP] ≪ Km. The inset shows the linear correlation of the data for [GAP] ≤ 3 mM, the slope of which gives kcat/Km = 12 M−1 s−1.
Table 3.
Kinetic Parameters for Isomerization of GAP by Wildtype and K12G Mutant Yeast Triosephosphate Isomerase.a
| Yeast TIM |
kcatb S−1 |
Kmb mM |
kcat/Km M−1 s−1 |
Ki for PGA mM |
|---|---|---|---|---|
| Wildtype | 7300 ± 400 | 1.1 ± 0.2 | 6.6 × 10⁶c | 0.019 ± 0.004d |
| K12G | 0.6 ± 0.2 | 50 ± 20 | 12 ± 0.4 e | 1.1 ± 0.2f |
| Effect g | 1.2 × 10⁴ | 50 | 5.5 × 10⁵ | 60 |
| ΔΔG or ΔΔG‡ kcal/mol |
5.6 | 2.3 | 7.8 | 2.4 |
At pH 7.5 (30 mM TEA), 25 °C and I = 0.10 (NaCl). Quoted errors are standard errors obtained from least squares analysis.
Determined from the fit of initial velocity data to the Michaelis-Menten equation.
Calculated as the ratio of the values of kcat and Km
Determined by global nonlinear least squares analysis of initial velocity data in the presence of zero, 21 and 130 µM PGA.
Determined as the slope of the plot of vi/[E] against [GAP] for [GAP] ≤ 3 mM (Figure 4, inset).
The effect of the K12G mutation on the kinetic parameter.
Figure 5 shows the dependence of apparent the second-order rate constant (kcat/Km)app for K12G TIM-catalyzed isomerization of GAP (determined as the slopes of plots of vi/[E] against [GAP]) on the concentration of 2-phosphoglycolate (PGA) at pH 7.5, 25 °C and I = 0.10 (NaCl). The value of Ki = 1.1 mM (Table 3) was determined from the nonlinear least squares fit of these data to eq 7 with kcat/Km = 12 M−1 s−1 in the absence of PGA.
| (7) |
Figure 5.
The dependence of the apparent second-order rate constant (kcat/Km)app for the isomerization of GAP catalyzed by K12G mutant yeast TIM on the concentration of 2-phosphoglycolate at pH 7.5 (30 mM TEA), 25 °C and I = 0.10 (NaCl).
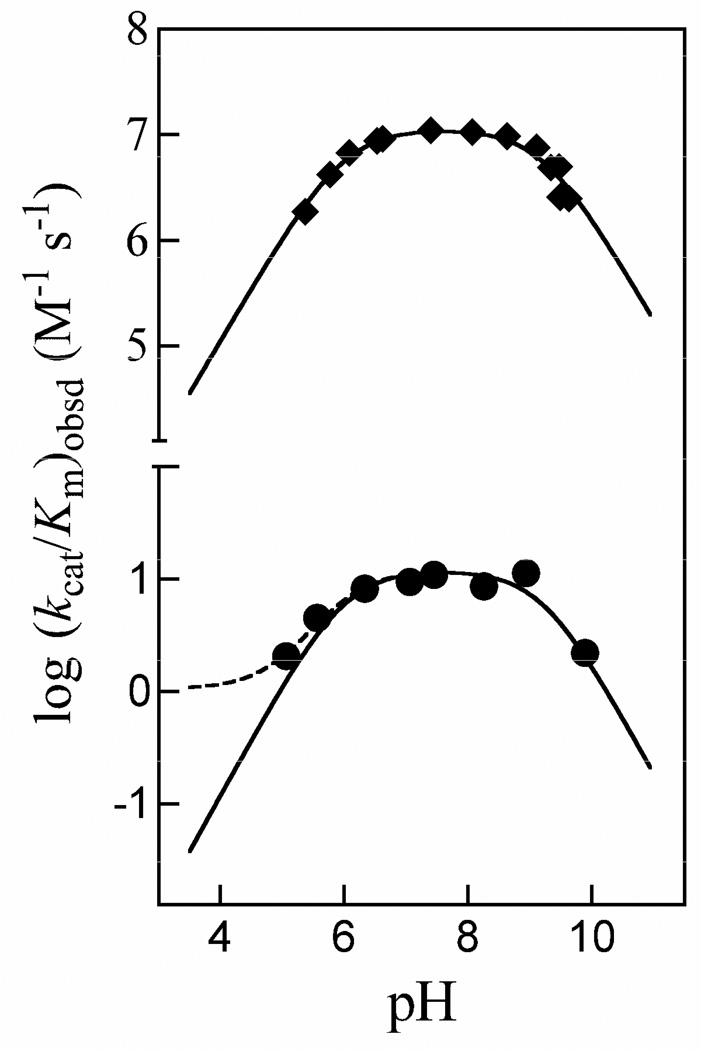
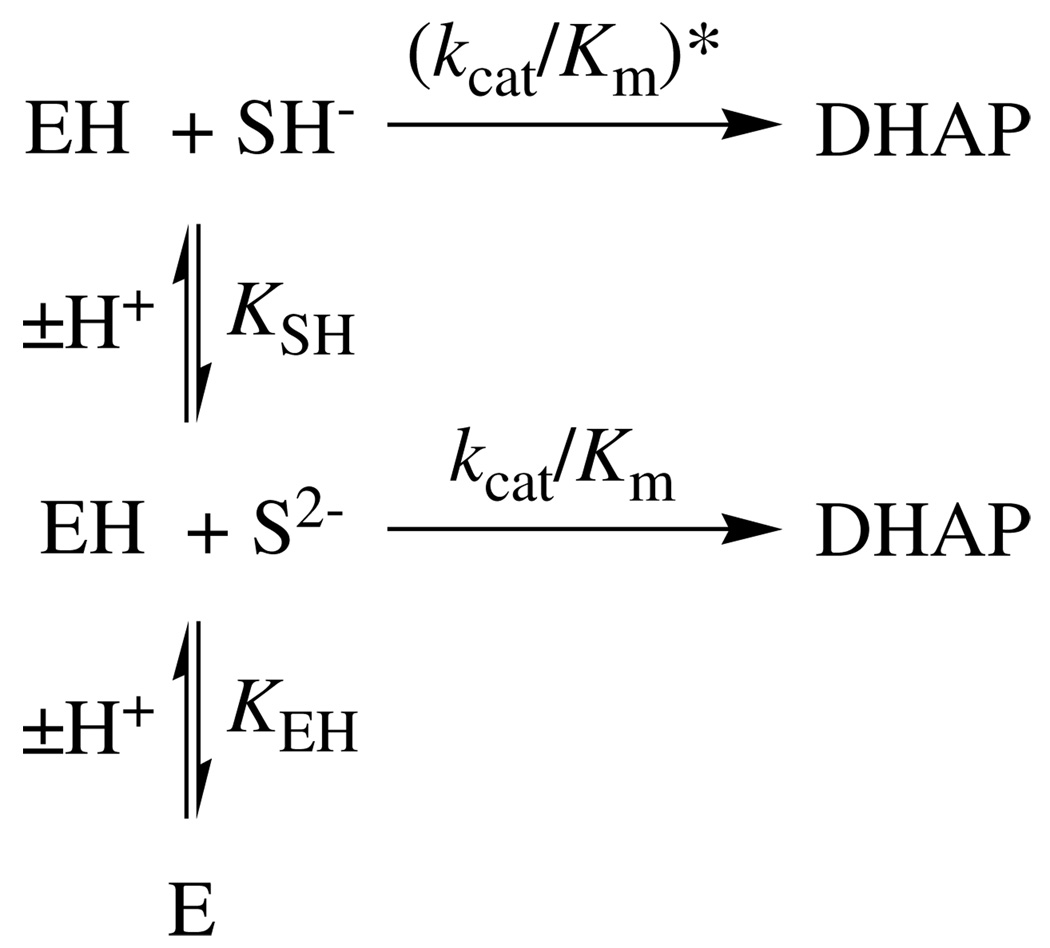
Figure 6 shows pH-rate profiles of the observed second-order rate constants (kcat/Km)obsd for the isomerization of GAP catalyzed by wildtype TIM from chicken muscle (data of Plaut & Knowles (35)) and by K12G mutant yeast TIM (data from this work). The literature data for wildtype TIM were fit to eq 8, derived for Scheme 3, using values of (kcat/Km)* = 0, pKSH = 6.0 for ionization of the phosphodianion group of GAP and pKEH = 9.2 for ionization of an essential residue at TIM (35). The solid and dashed lines through the data for K12G yeast TIM compare the fit obtained using kcat/Km = 12 M−1 s−1 (Table 3), pKSH = 6.0, p KEH = 9.2 and (kcat/Km)* = 0 (solid line) with that using (kcat/Km)* = 1.1 M−1 s−1 (dashed line) that was obtained from least-squares analysis that included (kcat/Km)* as an additional parameter.
| (8) |
Figure 6.
The pH dependence of the observed second-order rate constant (kcat/Km)obsd for the isomerization of GAP catalyzed by wildtype and K12G TIM. (◆) Data of Plaut & Knowles for wildtype TIM from chicken muscle at 30 °C (35). The solid line shows the fit of the data to eq 8 with (kcat/Km)* = 0. (●) Data from this work for K12G mutant yeast TIM at 25 °C. The solid and dashed lines compare the nonlinear least squares fits of these data to eq 8 using values of (kcat/Km)* = 0 and 1.1 M−1 s−1 for turnover of GAP monoanion, respectively (Scheme 3).
Scheme 3.
DISCUSSION
The X-ray crystal structure of yeast TIM shows that the cationic side chain of Lys-12 runs along the enzyme surface (7). Closure of phosphate gripper loop 6 over the substrate sequesters the carbon acid fragment from interaction with solvent, but the tip of the substrate phosphodianion group lies at the protein surface where it forms a solvent-separated ion pair with the cationic side chain of Lys-12 (7). X-ray crystallographic analysis of K12M/G15A TIM crystallized in the presence of the enediol(ate) intermediate analog 2-phosphoglycolohydroxamate (PGH) revealed no bound ligand and showed that the structure of this enzyme was nearly identical to that of unliganded wildtype TIM (22). We therefore do not expect that the K12G mutation will result in a large change in protein structure, but it should leave a small water-filled cleft at the protein surface.
We report here a second-order rate constant of kcat/Km = 12 M−1 s−1 for isomerization of GAP catalyzed by K12G mutant yeast TIM at pH 7.5, 25 °C and I = 0.10 (Table 3). In a previous study of the K12M mutant, the apparent value of kcat/Km = 30 M−1 s−1 was attributed to the presence of ca. 0.0005% contaminating wildtype TIM in the mutant enzyme preparation (21). By comparison, the lowered affinity of K12G TIM for GAP and PGA determined here (Table 3) shows that the observed activity of the K12G mutant cannot be due to a contaminating wildtype TIM activity. Table 3 also reports the kinetic parameters for turnover of GAP by wildtype yeast TIM determined in this work, which are in good agreement with the earlier literature values (36).
In an earlier study of K12M TIM it was concluded that this mutant has a very weak affinity for phosphodianion ligands. The value of Ki = 1.1 mM determined here for inhibition of K12G TIM by PGA at pH 7.5 (Figure 5 and Table 3) shows that the K12G mutant forms a moderately stable complex with this inhibitor trianion. However, it is more difficult to evaluate the stability of the complex of K12G TIM with GAP. The slight curvature in the Michaelis-Menten plot of vi/[E] against [GAP] (Figure 4) is consistent with Km = 50 ± 20 mM, but these data also show a reasonable fit to a linear equation. We note that: (1) If the K12G mutation results in a similar 60-fold increase in the dissociation constants for both PGA and GAP, then the value of Km for GAP would be ca. 60 mM which is close to Km ≈ 50 mM obtained from the data in Figure 4 and; (2) The effect of the K12G mutation on the affinity of the enzyme for GAP should not be any larger than the effect on its affinity for PGA, because the additional negative charge at PGA will tend to strengthen, not weaken, the interaction of the ligand with the cationic side chain of Lys-12 at the wildtype enzyme. Therefore, we conclude that K12G TIM has a weak affinity for GAP with Km = 50 – 60 mM.
K12G TIM-Catalyzed Reaction of GAP in D2O
We reported previously that the reaction of GAP catalyzed by wildtype rabbit or chicken muscle TIM in D2O, monitored for 2 – 5 h (32), results in formation of the three products of the enzyme-catalyzed reaction along with substantial formation of methylglyoxal from the competing nonenzymatic elimination reaction (Scheme 2) (14). We observe here that the K12G mutation at yeast TIM results in a large increase in the velocity of formation of methylglyoxal over that predicted for the competing nonenzymatic elimination reaction (Table 1). This shows that K12G TIM also catalyzes the elimination reaction of GAP to give methylglyoxal (Scheme 4). Table 1 reports the normalized fractional yields fE of the products of the enzymatic reaction of GAP catalyzed by 85 µM and 12 µM K12G TIM in D2O at pD 7.9. These yields were calculated using eq 9, where (fMG)E is the fractional yield of methylglyoxal from the enzymatic reaction that was calculated from the total fractional yield of methylglyoxal (fMG)tot as described in the Results section.
| (9) |
| (10) |
Scheme 4.
A rate constant ratio kPT/kelim ≈ 1 × 10⁶ was estimated for partitioning of the enzyme-bound enediol(ate) phosphate intermediate of the wildtype TIM-catalyzed reaction between protonation at carbon and elimination of inorganic phosphate (37). This is much larger than kPT/kelim = 6.5 for partitioning of the same enediol(ate) phosphate between proton transfer at carbon and elimination of phosphate within a loose complex with a small tertiary ammonium cation in solution (14). These observations show that interactions with wildtype TIM strongly stabilize the bound enediol(ate) phosphate intermediate towards elimination of inorganic phosphate (37, 38). The absence of the alkylammonium side chain of Lys-12 at K12G mutant yeast TIM results in a dramatic change in the ratio of the yields of the products of proton transfer and elimination (Scheme 4), from kPT/kelim ≈ 1 × 10⁶ (37) to 0.81/0.18 = 4.5 (Table 1). This dramatic change in the partitioning of the enediol(ate) phosphate intermediate shows that interaction of the cationic side chain of Lys-12 with the bound enediol(ate) phosphate strongly protects this species from elimination of inorganic phosphate. Good yields of methylglyoxal are also observed from the reactions of GAP and DHAP catalyzed by a loop deletion mutant of TIM (38), because interactions between the enediol(ate) phosphate and the flexible loop (loop 6) of TIM play a vital role in preventing breakdown of the intermediate with loss of inorganic phosphate.
Table 1 also reports the normalized fractional yields (fE)PT of the three products of proton transfer to the enzyme-bound enediol(ate) intermediate of the reactions of GAP catalyzed by wildtype TIM from rabbit or chicken muscle (32) and K12G mutant yeast TIM (this work, calculated using eq 10). These data show that the K12G mutation causes the yield of DHAP formed by intramolecular transfer of hydrogen from substrate GAP to decrease from 49% for the wildtype enzyme to 33% for the K12G mutant. There is good evidence that the H-labeled carboxylic acid side chain of Glu-165 at the TIM•enediol(ate) complex is sequestered from bulk solvent D2O and that this residue undergoes exchange with a small pool of similarly sequestered hydrons followed by proton transfer to the enediol(ate) to form d-GAP and d-DHAP (Scheme 4) (39, 40). Therefore, the decrease in the yield of the product of intramolecular transfer of hydrogen is nominally consistent with the conclusion that the K12G mutation increases the accessibility of the active site to the bulk solvent. The K12G mutation also results in an increase in the ratio of the yields of d-GAP and d-DHAP, from 0.7 for wildtype TIM to 1.3 for the K12G mutant. However, these small effects are difficult to rationalize in comparison with the very large 6 × 10⁵-fold effect of the K12G mutation on kcat/Km for isomerization of GAP (Table 3).
We conclude that Lys-12 plays an important role in stabilizing both the transition state for deprotonation of GAP and of the bound enediol(ate) intermediate towards elimination of phosphate dianion. However, it plays a much less important role in controlling the partitioning of the enediol(ate) intermediate in D2O between formation of DHAP, d-GAP and d-DHAP.
K12G TIM-Catalyzed Reaction of [1-13C]-GA in D2O
The large difference between kcat/Km for isomerization of GAP (1.0 × 10⁸ M−1 s−1)3 and for deprotonation of glycolaldehyde (ca. 0.10 M−1 s−1)4 by wildtype chicken muscle TIM shows that interactions between the substrate phosphodianion and TIM provide a ca. 12 kcal/mol stabilization (intrinsic phosphate binding energy) of the transition state for proton transfer from GAP (12, 16). Truncation of GAP to give the neutral substrate glycolaldehyde eliminates transition state stabilization resulting from interactions with the phosphodianion group. Therefore, the observation of a large effect of the K12G mutation on the rate constant for deprotonation of glycolaldehyde would provide direct evidence for stabilizing interactions between the excised cationic side chain of Lys-12 and the carbon acid substrate piece. This two-part substrate approach was used to probe the interactions of amino acid side chains with the phosphodianion and nucleoside portions of the substrate in the decarboxylation of orotidine 5'-monophosphate catalyzed by orotidine 5'-monophosphate decarboxylase (41).
We reported previously that the reaction of [1-13C]-GA catalyzed by wildtype chicken muscle TIM gives a ca. 50% combined yield of the isomerization product [2-13C]-GA, the product of isomerization with deuterium exchange [2-13C, 2-2H]-GA, and the product of deuterium exchange [1-13C, 2-2H]-GA resulting from the "specific" reactions of [1-13C]-GA at the enzyme active site (28) (Scheme 5). By contrast, the only clearly detectable product of the reaction of [1-13C]-GA catalyzed by K12G mutant yeast TIM is the dideuteriated isotopomer [1-13C, 2,2-di-2H]-GA which is formed in ca. 56% yield (Table 2). This isotopomer was also observed as a minor product (ca. 20% yield) of the wildtype chicken muscle TIM-catalyzed reaction where it was proposed to form by a "nonspecific" protein-catalyzed reaction that occurs outside the enzyme active site (28).
Scheme 5.
The second-order rate constant for the nonspecific K12G TIM-catalyzed reaction of [1-13C]-GA to give [1-13C, 2,2-di-2H]-GA that occurs outside the active site can be calculated as kcat/Km = (0.11 M−1 s−1)(0.56) = 0.062 M−1 s−1, where 0.11 M−1 s−1 is the observed second-order rate constant for the K12G TIM-catalyzed disappearance of [1-13C]-GA and 0.56 is the fractional yield of [1-13C, 2,2-di-2H]-GA (Table 2). This rate constant is at least 90-fold larger than (kcat/Km)iso ≤ 7 × 10⁻⁴ M−1 s−1 for isomerization of [1-13C]-GA at the active site to give [2-13C]-GA (Table 2). The corresponding second-order rate constant for isomerization of [1-13C]-GA catalyzed by wildtype chicken muscle TIM can be calculated from data in our previous work as (kcat/Km)iso = 9.5 × 10⁻³ M−1 s−1 (28).5 Therefore the K12G mutation results in at least a 14-fold decrease in (kcat/Km)iso for isomerization of [1-13C]-GA. This provides direct evidence that the cationic side chain of Lys-12 stabilizes the transition state for proton transfer from glycolaldehyde by interaction with the carbon acid substrate piece. It is reasonable to conclude that this side chain also acts similarly to stabilize the transition sate for isomerization of GAP by interaction with both the nonreacting phosphodianion and the reacting carbon acid fragments of the whole substrate.
Phosphite dianion strongly activates wildtype rabbit and chicken muscle TIM towards the isomerization of glycolaldehyde (28, 30) and we have also found that alkylammonium cations strongly activate K12G mutant yeast TIM towards the isomerization of GAP (42). We therefore examined the K12G TIM-catalyzed reaction of [1-13C]-GA in D2O in the presence of 100 mM EtND3+ or 50 mM EtND3+ and 10 mM phosphite dianion (Table 2). These reagents result in small increases in the observed second-order rate constant (kcat/Km)obsd for the disappearance of [1-13C]-GA (Table 2). However, these increases do not result from catalysis of isomerization at the enzyme active site because there is no detectable formation of the isomerization product [2-13C]-GA (Table 2). No attempt was made to characterize the additional products of these slow reactions because the products do not appear to be formed at the active site of TIM. We conclude the following: (1) Interactions between the phosphite dianion activator and the cationic side chain of Lys-12 are essential for the observation of phosphite activation of the TIM-catalyzed deprotonation of GA (30). (2) Interactions between the phosphodianion group of GAP and exogenous ammonium cations are essential for the observation of rescue of the activity of K12G mutant TIM by these cations (42). However, K12G mutant TIM shows no detectable activity for isomerization of [1-13C]-GA in the presence of EtND3+ and phosphite dianion, presumably because these ions show a weak affinity for binding to the mutant enzyme.
pH-Rate Profile for Isomerization of GAP by K12G Mutant Yeast TIM
Figure 6 shows the pH-rate profiles for kcat/Km for isomerization of GAP catalyzed by wildtype chicken muscle TIM (data from the literature (35)) and K12G mutant yeast TIM (data from this work). The solid lines show the fits of the data to eq 8 with (kcat/Km)* = 0. The dashed line for K12G TIM shows that the inclusion of (kcat/Km)* = 1.1 M−1 s−1 for turnover of GAP monoanion results in a small improvement in the fit of the experimental data to eq 8 (see Results section). This suggests that K12G TIM exhibits only a ca. 10-fold selectivity for catalysis of the isomerization of GAP dianion [(kcat/Km) = 12 M−1 s−1, Table 3] over GAP monoanion [(kcat/Km)* = 1.1 M−1 s−1].
The downward break centered at pH 9.2 for wildtype TIM cannot be due to deprotonation of the cationic side chain of Lys-12 because the same break is observed in the profile for K12G TIM (Figure 6).6 This demonstrates that pKa > 9.2 for the cationic side chain of Lys-12, which is consistent with the salt bridge with the carboxylate side chain of Glu-97 observed at TIM•PGA and TIM•PGH complexes (10, 17, 43). It also suggests that there is a large distance between the side chains of Lys-12 and this second critical residue.
Specificity in Transition State Binding
The K12G mutation at yeast TIM results in a 5.5 × 10⁵-fold decrease in kcat/Km for isomerization of GAP (Table 3), corresponding to a 7.8 kcal/mol stabilization of the transition state by the cationic side chain of Lys-12. This effect can be partitioned into a ca. 50-fold effect on Km (ΔΔG = 2.3 kcal/mol) and a much larger ca. 12,000-fold effect on kcat for isomerization of bound substrate (ΔΔG‡ = 5.6 kcal/mol, Table 3). The effect of the mutation on Km can be directly attributed to the loss of ground state electrostatic interactions between the substrate phosphodianion group and the cationic side chain of Lys-12. More importantly, the large effect on kcat shows that there is a significant strengthening of the interactions between the ligand and the alkylammonium side chain of Lys-12 on moving from the ground state Michaelis complex to the transition state for carbon deprotonation. The most striking structural change on moving from the Michaelis complex to the enediol(ate)-like transition state for deprotonation of GAP is the change in formal charge at the substrate carbonyl oxygen, from 0 to −1, and the change in the total charge at bound ligand, from −2 to −3. This increase in negative charge is expected to result in an increase in the stabilizing electrostatic interactions between with the alkylammonium side chain of Lys-12 and the altered substrate in the transition state (44).
The K12G mutation also results causes in at least a 14-fold decrease in (kcat/Km)iso for isomerization of bound glycolaldehyde (vide infra), which shows that the cationic side chain of Lys-12 acts to stabilize the transition state for a proton transfer from a neutral substrate piece that lacks a phosphodianion group. This provides evidence for a significant stabilizing interaction between the cationic side chain of Lys-12 and the developing negative charge on the sugar substrate piece in an enediol(ate)-like transition state. It is in accord with computational studies that pointed to the dominant role of Lys-12 in stabilization of the transition state for formation of an enediolate intermediate by carbon deprotonation of the whole substrate DHAP or GAP (44, 45).
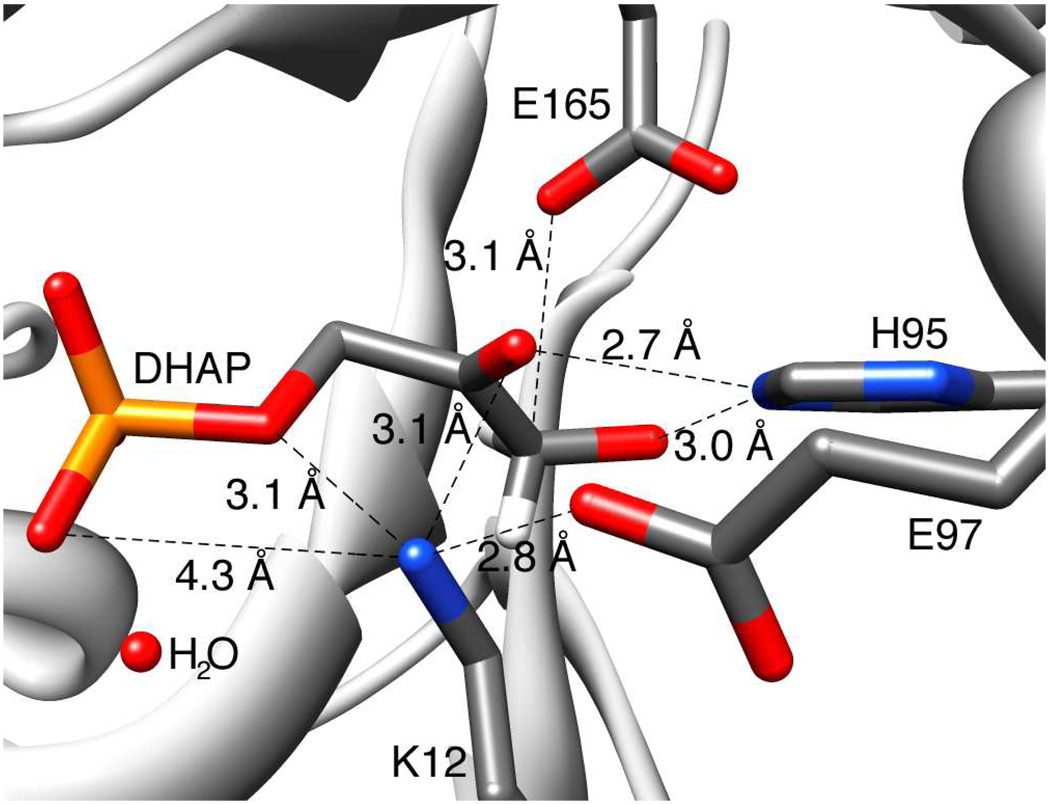
The role of Lys-12 in catalysis of isomerization has also been inferred from an inspection of the X-ray crystal structure of yeast TIM complexed with DHAP (Figure 7) (7). The alkylammonium side chain of Lys-12 lies roughly equidistant from the phosphodianion and carbonyl groups of bound DHAP and is expected to interact with both centers. This side chain likely does not form a hydrogen bond with the phosphate dianion in the ground state Michaelis complex because the X-ray crystal structure reveals the presence of a water molecule between the cationic side chain of Lys-12 and the phosphodianion group of DHAP, which attenuates the electrostatic interaction (Figure 7) (7). This interaction might be strengthened by a shift in the position of the water to allow for closer proximity of the interacting charges at the transition state for proton transfer. However, we have no evidence to support this proposal and we note that a bridging water molecule in this position is also observed at complexes between TIM and the intermediate analogs PGH (43) and PGA (10).
Figure 7.
The structure of the active site of TIM, taken from the X-ray crystal structure of McDermott and coworkers (PDB entry 1NEY) (7), showing the distances between the ammonium nitrogen of Lys-12 and the functional groups of bound substrate DHAP.
The stretching frequency for the C-2 carbonyl group of DHAP bound to the H95Q and H95N mutants of yeast TIM lies between 1732 and 1742 cm−1 (46), which is similar to the carbonyl stretching frequency of 1732 cm−1 for DHAP in water (47). This suggests that there is no additional polarization of the carbonyl π-bond of enzyme-bound DHAP due to a hydrogen-bonding interaction with Lys-12 (21). Although there is no crystal structure for the complex between TIM and GAP, the large effect of the K12G mutation on kcat for isomerization of GAP (Table 3) provides strong evidence that the cationic side chain of Lys-12 stabilizes negative charge that develops at O-1 at the transition state for deprotonation of GAP.
Charged Enediolate or Neutral Enediol Intermediate?
Studies of the nonenzymatic deprotonation of GAP in water show that direct Brønsted base-catalyzed deprotonation of the substrate to form a negatively charged enediolate intermediate is favored energetically over any competing Brønsted acid-catalyzed pathway to form the enediol (14). This is because the enolate oxygen of the enediolate intermediate is relatively weakly basic (pKa ≈ 11 for the enol (14, 48)), so that there is no significant advantage to concerted catalysis by relatively weak Brønsted acids (49). Brønsted general acid catalysis of the deprotonation of enzyme-bound GAP to form an enediol intermediate would be favored if proton transfer from the enzyme to the enediolate were strongly favorable (50).
We suggest that there is a strong catalytic imperative to the avoidance of full proton transfer to the enediolate oxyanion and which dictates the use of a neutral imidazole side chain of His-95 (25), rather than the more acidic imidazolium cation, as the catalytic electrophile at TIM. Full proton transfer to the enediolate oxyanion would eliminate the large stabilizing electrostatic interaction with the cationic side chain of Lys-12. However, partial proton transfer from the neutral imidazole of His-95 to the oxyanion allows for effective transition state stabilization by hydrogen bonding (46), while at the same time maintaining the critical stabilizing electrostatic interaction with the cationic side chain of Lys-12.
It is not obvious that enolate anions, whose formation from neutral molecules is intrinsically more difficult in solvents of low dielectric constant than in water, should in fact be formed more easily at the nonpolar active sites of protein catalysts (51–55) than in aqueous solution. However, zwitterions are strongly stabilized by their transfer from aqueous solution to organic solvents (56–58), and the formation of the effectively intramolecular (59, 60) ion pairs between enzyme catalysts and immobilized bound substrates will be favored entropically over the bimolecular formation of ion pairs between small molecules in solution. Others have noted that enzyme active sites provide a highly organized environment for chemical reactions (51, 61, 62), where appropriately placed amino acid side chains act to stabilize bound ions of opposite charge.
Footnotes
This work was supported by Grant GM39754 from the National Institutes of Health
Abbreviations: TIM, triosephosphate isomerase; DHAP, dihydroxyacetone phosphate; GAP, (R)-glyceraldehyde 3-phosphate; PGA, 2-phosphoglycolate; GA, glycolaldehyde; GPDH, glycerol 3-phosphate dehydrogenase; BSA, bovine serum albumin; MES, 2-(N-morpholino)ethanesulfonic acid; CAPSO, 3-(cyclohexylamino)-2-hydroxy-1-propanesulfonic acid; NADH, nicotinamide adenine dinucleotide, reduced form; TEA, triethanolamine; MOPS, 3-(N-morpholino)propanesulfonic acid; Pfu, DNA polymerase from the hyperthermophilic Pyococcus furiosus; PCR, polymerase chain reaction; DpnI, restriction endonuclease from Diplococcus pneumoniae G41; NMR, nuclear magnetic resonance; D,L-GAP, D,L-glyceraldehyde 3-phosphate; d-DHAP, [1(R)-2H]-dihydroxyaceteone phosphate; d-GAP, [2(R)-2H]-glyceraldehyde 3-phosphate; MG, methylglyoxal; PGH, 2-phosphoglycolohydroxamate;
Unless noted otherwise, residues are numbered according to the sequence for the enzyme from yeast.
Values of kcat = 2300 s−1 and Km = 0.45 mM for isomerization of GAP by chicken muscle TIM at pH 7.5 and 25 °C were reported in our earlier work (Ref. 28). GAP exists as 95% hydrate and 5% free carbonyl (the reactive form) in D2O at pD 7.9, 25 °C and I = 0.10 (NaCl) (Ref. 32).
Calculated using (kcat/Km)obsd = 0.19 M−1 s−1 for enzyme-catalyzed disappearance of glycolaldehyde and the observation that 50% of the products of this reaction result from deprotonation of glycolaldehyde within the active site (Ref. 28).
Calculated using (kcat/Km)obsd = 0.19 M−1 s−1 for enzyme-catalyzed disappearance of glycolaldehyde and the observation that the isomerization product [2-13C]-GA is formed in a yield of 5% (Ref. 28).
REFERENCES
- 1.Knowles JR, Albery WJ. Perfection in enzyme catalysis: the energetics of triosephosphate isomerase. Acc. Chem. Res. 1977;10:105–111. [Google Scholar]
- 2.Rieder SV, Rose IA. Mechanism of the triose phosphate isomerase reaction. J. Biol. Chem. 1959;234:1007–1010. [PubMed] [Google Scholar]
- 3.Shonk CE, Boxer GE. Enzyme patterns in human tissues. I. Methods for the determination of glycolytic enzymes. Cancer Res. 1964;24:709–721. [PubMed] [Google Scholar]
- 4.Gerlt JA, Gassman PG. Understanding the rates of certain enzyme-catalyzed reactions: Proton abstraction from carbon acids, acyl transfer reactions, and displacement reactions of phosphodiesters. Biochemistry. 1993;32:11943–11952. doi: 10.1021/bi00096a001. [DOI] [PubMed] [Google Scholar]
- 5.Richard JP, Amyes TL. Proton transfer at carbon. Cur. Opin. Chem. Biol. 2001;5:626–633. doi: 10.1016/s1367-5931(01)00258-7. [DOI] [PubMed] [Google Scholar]
- 6.Amyes TL, Richard JP. Hynes JT, Klinman JP, Limbach HH, Schowen RL. Hydrogen-Transfer Reactions, Volume 3, Biological Aspects I-II. Weinheim: Wiley-VCH; 2007. Proton Transfer to and from carbon in model systems; pp. 949–973. [Google Scholar]
- 7.Jogl G, Rozovsky S, McDermott AE, Tong L. Optimal alignment for enzymatic proton transfer: structure of the Michaelis complex of triosephosphate isomerase at 1.2-Å resolution. Proc. Natl. Acad. Sci. U. S. A. 2003;100:50–55. doi: 10.1073/pnas.0233793100. [DOI] [PMC free article] [PubMed] [Google Scholar]
- 8.Xiang J, Sun J, Sampson NS. The importance of hinge sequence for loop function and catalytic activity in the reaction catalyzed by triosephosphate isomerase. J. Mol. Biol. 2001;307:1103–1112. doi: 10.1006/jmbi.2001.4536. [DOI] [PubMed] [Google Scholar]
- 9.Xiang J, Jung J-y, Sampson NS. Entropy effects on protein hinges: The reaction catalyzed by triosephosphate isomerase. Biochemistry. 2004;43:11436–11445. doi: 10.1021/bi049208d. [DOI] [PubMed] [Google Scholar]
- 10.Kursula I, Wierenga RK. Crystal structure of triosephosphate isomerase complexed with 2-phosphoglycolate at 0.83-Å resolution. J. Biol. Chem. 2003;278:9544–9551. doi: 10.1074/jbc.M211389200. [DOI] [PubMed] [Google Scholar]
- 11.Blacklow SC, Raines RT, Lim WA, Zamore PD, Knowles JR. Triosephosphate isomerase catalysis is diffusion controlled. Biochemistry. 1988;27:1158–1165. doi: 10.1021/bi00404a013. [DOI] [PubMed] [Google Scholar]
- 12.Amyes TL, O'Donoghue AC, Richard JP. Contribution of phosphate intrinsic binding energy to the enzymatic rate acceleration for triosephosphate isomerase. J. Am. Chem. Soc. 2001;123:11325–11326. doi: 10.1021/ja016754a. [DOI] [PubMed] [Google Scholar]
- 13.Morrow JR, Amyes TL, Richard JP. Phosphate binding energy and catalysis by small and large molecules. Acc. Chem. Res. 2008;41:539–548. doi: 10.1021/ar7002013. [DOI] [PMC free article] [PubMed] [Google Scholar]
- 14.Richard JP. Acid-base catalysis of the elimination and isomerization reactions of triose phosphates. J. Am. Chem. Soc. 1984;106:4926–4936. [Google Scholar]
- 15.Amyes TL, Richard JP, Tait JJ. Activation of orotidine 5'-monophosphate decarboxylase by phosphite dianion: The whole substrate is the sum of two parts. J. Am. Chem. Soc. 2005;127:15708–15709. doi: 10.1021/ja055493s. [DOI] [PubMed] [Google Scholar]
- 16.Tsang W-Y, Amyes TL, Richard JP. A substrate in pieces: Allosteric activation of glycerol 3-phosphate dehydrogenase (NAD+) by phosphite dianion. Biochemistry. 2008;47:4575–4582. doi: 10.1021/bi8001743. [DOI] [PMC free article] [PubMed] [Google Scholar]
- 17.Lolis E, Petsko GA. Crystallographic analysis of the complex between triosephosphate isomerase and 2-phosphoglycolate at 2.5-Å resolution: implications for catalysis. Biochemistry. 1990;29:6619–6625. doi: 10.1021/bi00480a010. [DOI] [PubMed] [Google Scholar]
- 18.Knowles JR. To build an enzyme. Philos. Trans. R. Soc. London, Ser. B. 1991;332:115–121. doi: 10.1098/rstb.1991.0039. [DOI] [PubMed] [Google Scholar]
- 19.Klotz IM, Franzen JS. Hydrogen bonds between model peptide groups in solution. J. Am. Chem. Soc. 1962;84:3461–3466. [Google Scholar]
- 20.Susi H, Timasheff SN, Ard JS. Near infrared investigation of interamide hydrogen bonding in aqueous solution. J. Biol. Chem. 1964;239:3051–3054. [PubMed] [Google Scholar]
- 21.Lodi PJ, Chang LC, Knowles JR, Komives EA. Triosephosphate isomerase requires a positively charged active site: The role of lysine-12. Biochemistry. 1994;33:2809–2814. doi: 10.1021/bi00176a009. [DOI] [PubMed] [Google Scholar]
- 22.Joseph-McCarthy D, Lolis E, Komives EA, Petsko GA. Crystal structure of the K12M/G15A triosephosphate isomerase double mutant and electrostatic analysis of the active site. Biochemistry. 1994;33:2815–2823. doi: 10.1021/bi00176a010. [DOI] [PubMed] [Google Scholar]
- 23.O'Connor EJ, Tomita Y, McDermott AE. Synthesis of (1,2-13C2)-2-phosphoglycolic acid. J. Labelled Compd. Radiopharm. 1994;34:735–740. [Google Scholar]
- 24.Bergemeyer HU, Haid E, Nelboeck-Hochstetter M. In: Office UP, editor. US: 1972. [Google Scholar]
- 25.Lodi PJ, Knowles JR. Neutral imidazole is the electrophile in the reaction catalyzed by triosephosphate isomerase: structural origins and catalytic implications. Biochemistry. 1991;30:6948–6956. doi: 10.1021/bi00242a020. [DOI] [PubMed] [Google Scholar]
- 26.Straus D, Gilbert W. Chicken triosephosphate isomerase complements an Escherichia coli deficiency. Proc. Natl. Acad. Sci. U. S. A. 1985;82:2014–2018. doi: 10.1073/pnas.82.7.2014. [DOI] [PMC free article] [PubMed] [Google Scholar]
- 27.Sun J, Sampson NS. Understanding protein lids: kinetic analysis of active hinge mutants in triosephosphate isomerase. Biochemistry. 1999;38:11474–11481. doi: 10.1021/bi990862g. [DOI] [PubMed] [Google Scholar]
- 28.Go MK, Amyes TL, Richard JP. Hydron transfer catalyzed by triosephosphate isomerase. Products of the direct and phosphite-activated isomerization of [1-13C]-glycolaldehyde in D2O. Biochemistry. 2009;48:5769–5778. doi: 10.1021/bi900636c. [DOI] [PMC free article] [PubMed] [Google Scholar]
- 29.Glasoe PK, Long FA. Use of glass electrodes to measure acidities in deuterium oxide. J. Phys. Chem. 1960;64:188–190. [Google Scholar]
- 30.Amyes TL, Richard JP. Enzymatic catalysis of proton transfer at carbon: activation of triosephosphate isomerase by phosphite dianion. Biochemistry. 2007;46:5841–5854. doi: 10.1021/bi700409b. [DOI] [PMC free article] [PubMed] [Google Scholar]
- 31.Collins GCS, George WO. Nuclear magnetic resonance spectra of glycolaldehyde. J. Chem. Soc. (B) 1971:1352–1355. [Google Scholar]
- 32.O'Donoghue AC, Amyes TL, Richard JP. Hydron transfer catalyzed by triosephosphate isomerase. Products of isomerization of (R)-glyceraldehyde 3-phosphate in D2O. Biochemistry. 2005;44:2610–2621. doi: 10.1021/bi047954c. [DOI] [PubMed] [Google Scholar]
- 33.Gasteiger E, Gattiker A, Hoogland C, Ivanyi I, Appel RD, Bairoch A. ExPASy: The proteomics server for in-depth protein knowledge and analysis. Nucleic Acids Res. 2003;31:3784–3788. doi: 10.1093/nar/gkg563. [DOI] [PMC free article] [PubMed] [Google Scholar]
- 34.Gasteiger E, Hoogland C, Gattiker A, Duvaud S, Wilkins MR, Appel RD, Bairoch A. In: Proteomics Protocols Handbook. Walker JM, editor. Totowa, NJ: Humana Press Inc; 2005. pp. 571–607. [Google Scholar]
- 35.Plaut B, Knowles JR. pH-Dependence of the triose phosphate isomerase reaction. Biochem. J. 1972;129:311–320. doi: 10.1042/bj1290311. [DOI] [PMC free article] [PubMed] [Google Scholar]
- 36.Nickbarg EB, Knowles JR. Triosephosphate isomerase: energetics of the reaction catalyzed by the yeast enzyme expressed in Escherichia coli. Biochemistry. 1988;27:5939–5947. doi: 10.1021/bi00416a018. [DOI] [PubMed] [Google Scholar]
- 37.Richard JP. Kinetic-parameters for the elimination reaction catalyzed by triosephosphate isomerase and an estimation of the reactions physiological significance. Biochemistry. 1991;30:4581–4585. doi: 10.1021/bi00232a031. [DOI] [PubMed] [Google Scholar]
- 38.Pompliano DL, Peyman A, Knowles JR. Stabilization of a reaction intermediate as a catalytic device: definition of the functional role of the flexible loop in triosephosphate isomerase. Biochemistry. 1990;29:3186–3194. doi: 10.1021/bi00465a005. [DOI] [PubMed] [Google Scholar]
- 39.O'Donoghue AC, Amyes TL, Richard JP. Hydron transfer catalyzed by triosephosphate isomerase. Products of isomerization of dihydroxyacetone phosphate in D2O. Biochemistry. 2005;44:2622–2631. doi: 10.1021/bi047953k. [DOI] [PubMed] [Google Scholar]
- 40.O'Donoghue AC, Amyes TL, Richard JP. Slow proton transfer from the hydrogen-labelled carboxylic acid side chain (Glu-165) of triosephosphate isomerase to imidazole buffer in D2O. Org. Biomol. Chem. 2008;6:391–396. doi: 10.1039/b714304d. [DOI] [PubMed] [Google Scholar]
- 41.Barnett SA, Amyes TL, Wood BM, Gerlt JA, Richard JP. Dissecting the Total Transition State Stabilization Provided by Amino Acid Side Chains at Orotidine 5'-Monophosphate Decarboxylase: A Two-Part Substrate Approach. Biochemistry. 2008;47:7785–7787. doi: 10.1021/bi800939k. [DOI] [PMC free article] [PubMed] [Google Scholar]
- 42.Go MK. Ph. D. Thesis. SUNY: University at Buffalo; 2009. [Google Scholar]
- 43.Davenport RC, Bash PA, Seaton BA, Karplus M, Petsko GA, Ringe D. Structure of the triosephosphate isomerase-phosphoglycolohydroxamate complex: an analog of the intermediate on the reaction pathway. Biochemistry. 1991;30:5821–5826. doi: 10.1021/bi00238a002. [DOI] [PubMed] [Google Scholar]
- 44.Bash PA, Field MJ, Davenport RC, Petsko GA, Ringe D, Karplus M. Computer simulation and analysis of the reaction pathway of triosephosphate isomerase. Biochemistry. 1991;30:5826–5832. doi: 10.1021/bi00238a003. [DOI] [PubMed] [Google Scholar]
- 45.Cui Q, Karplus M. Triosephosphate isomerase: A theoretical comparison of alternative pathways. J. Am. Chem. Soc. 2001;123:2284–2290. doi: 10.1021/ja002886c. [DOI] [PubMed] [Google Scholar]
- 46.Komives EA, Chang LC, Lolis E, Tilton RF, Petsko GA, Knowles JR. Electrophilic catalysis in triosephosphate isomerase: the role of histidine-95. Biochemistry. 1991;30:3011–3019. doi: 10.1021/bi00226a005. [DOI] [PubMed] [Google Scholar]
- 47.Belasco JG, Knowles JR. Direct observation of substrate distortion by triosephosphate isomerase using Fourier transform infrared spectroscopy. Biochemistry. 1980;19:472–477. doi: 10.1021/bi00544a012. [DOI] [PubMed] [Google Scholar]
- 48.Keeffe JR, Kresge AJ. Kinetics and mechanism of enolization and ketonization. In: Rappoport Z, editor. The Chemistry of Enols. Chichester: John Wiley and Sons; 1990. pp. 399–480. [Google Scholar]
- 49.Jencks WP. Requirements for general acid-base catalysis of complex reactions. J. Am. Chem. Soc. 1972;94:4731–4732. [Google Scholar]
- 50.Richard JP. The Enhancement of Enzymatic Rate Accelerations by Brønsted Acid-Base Catalysis. Biochemistry. 1998;37:4305–4309. doi: 10.1021/bi972655r. [DOI] [PubMed] [Google Scholar]
- 51.Sham YY, Muegge I, Warshel A. The effect of protein relaxation on charge-charge interactions and dielectric constants of proteins. Biophys. J. 1998;74:1744–1753. doi: 10.1016/S0006-3495(98)77885-3. [DOI] [PMC free article] [PubMed] [Google Scholar]
- 52.Simonson T, Brooks CL. Charge Screening and the Dielectric Constant of Proteins: Insights for Molecular Dynamics. J. Am. Chem. Soc. 1996;118:8452–8458. [Google Scholar]
- 53.Simonson T, Carlsson J, Case DA. Proton Binding to Proteins: pKa Calculations with Explicit and Implicit Solvent Models. J. Am. Chem. Soc. 2004;126:4167–4180. doi: 10.1021/ja039788m. [DOI] [PubMed] [Google Scholar]
- 54.Antosiewicz J, McCammon JA, Gilson MK. The determinants of pKas in proteins. Biochemistry. 1996;35:7819–7833. doi: 10.1021/bi9601565. [DOI] [PubMed] [Google Scholar]
- 55.Georgescu RE, Alexov EG, Gunner MR. Combining conformational flexibility and continuum electrostatics for calculating pKas in proteins. Biophys. J. 2002;83:1731–1748. doi: 10.1016/S0006-3495(02)73940-4. [DOI] [PMC free article] [PubMed] [Google Scholar]
- 56.Richard JP, Amyes TL. On the importance of being zwitterionic: enzymic catalysis of decarboxylation and deprotonation of cationic carbon. Bioorg. Chem. 2004;32:354–366. doi: 10.1016/j.bioorg.2004.05.002. [DOI] [PubMed] [Google Scholar]
- 57.Rios A, Amyes TL, Richard JP. Formation and stability of organic zwitterions in aqueous solution: enolates of the amino acid glycine and its derivatives. J. Am. Chem. Soc. 2000;122:9373–9385. [Google Scholar]
- 58.Price WD, Jockusch RA, Williams ER. Binding energies of protonated betaine complexes: A probe of zwitterion structure in the gas phase. J. Am. Chem. Soc. 1998;120:3474–3484. doi: 10.1021/ja972527q. [DOI] [PMC free article] [PubMed] [Google Scholar]
- 59.Jencks WP. Binding energy, specificity and enzymic catalysis: The Circe effect. Adv. Enzymol. Relat. Areas Mol. Biol. 1975;43:219–410. doi: 10.1002/9780470122884.ch4. [DOI] [PubMed] [Google Scholar]
- 60.Jencks WP. On the attribution and additivity of binding energies. Proc. Natl. Acad. Sci. U. S. A. 1981;78:4046–4050. doi: 10.1073/pnas.78.7.4046. [DOI] [PMC free article] [PubMed] [Google Scholar]
- 61.Warshel A. Electrostatic origin of the catalytic power of enzymes and the role of preorganized active sites. J. Biol. Chem. 1998;273:27035–27038. doi: 10.1074/jbc.273.42.27035. [DOI] [PubMed] [Google Scholar]
- 62.Cannon WR, Benkovic SJ. Solvation, Reorganization Energy, and Biological Catalysis. J. Biol. Chem. 1998;273:26257–26260. doi: 10.1074/jbc.273.41.26257. [DOI] [PubMed] [Google Scholar]


