

Abstract
Objectives
To compare lipid profiles in patients with rheumatoid arthritis (RA) and non-RA subjects during the 5 years before and 5 years after RA incidence/index date.
Methods
Lipid measures were abstracted in a population-based incident cohort of RA patients (1987 ACR criteria) first diagnosed between 1/1/1988 and 1/1/2008 and in non-RA subjects. Random effects models adjusting for age, sex and calendar year were used to examine trends in lipid profiles, accounting for multiple measurements per subject.
Results
Study population included a cohort of 577 RA patients (a total of 3,088 lipid measurements) and 540 non-RA subjects (a total of 3,048 lipid measurements). There were significant decreases in total [TCh] and low-density cholesterol [LDL] levels in the RA cohort during the 5 years before RA, compared to the non-RA cohort (p<0.001). Trends in other lipid measures (triglycerides and high-density cholesterol) were similar in RA and non-RA cohorts during the 5 years before and 5 years after RA incidence/index date. During the 5 years before RA incidence/index date, the proportion of RA patients with elevated TCh or LDL measures, but not with abnormal HDL and TG measures, significantly decreased compared to non-RA subjects. Lipid-lowering drugs (statins in particular) were less often (p=0.02) prescribed to RA patients than to non-RA subjects.
Conclusion
TCh and LDL levels and the prevalence of abnormal TCh or LDL measures decreased significantly during the 5 years before RA incidence/index date in RA patients as compared to non-RA cohort. These trends in lipid profile in RA are unlikely to be solely due to lipid-lowering therapy.
Keywords: rheumatoid arthritis, lipid profiles, longitudinal lipid trends
Introduction
An increasing number of studies worldwide provide compelling evidence for the excess cardiovascular (CV) risk in patients with rheumatoid arthritis (RA) compared to the general population.[1,2] The interplay of two major contributors (traditional CV risk factors and inflammation) is being investigated to better understand the mechanisms underlying the high CV morbidity and mortality in RA. The contribution of inflammation to atherogenesis is supported by epidemiological evidence on the independent predictive value of inflammatory markers for subclinical and clinical atherosclerosis and for associated CV events.[3-5] However, the impact of lipids on CV risk in the chronic autoimmune inflammatory setting of RA is unclear and the literature on lipid profile in RA patients is contradictory. A number of studies demonstrated a proatherogenic profile in RA.[6-9] Some authors did not find a significant difference between lipid levels in RA patients and in the general population.[10] On the other hand, growing evidence suggests that patients with active untreated RA have reduced total cholesterol (TCh), low-density (LDL) and high-density (HDL) cholesterol.[11-13] These conflicting results can be attributed to the confounding by indication and, possibly, to the effect of inflammation and treatment. Comprehensive analyses of trends in lipids both before and after RA incidence are lacking and the impact of RA onset on lipids is unknown. To address this issue, we performed a longitudinal study of changes in lipid profile during the period surrounding RA incidence in a population-based cohort of RA patients and a comparison cohort of non-RA subjects.
The aim of this study was to compare lipid profiles in RA patients and non-RA subjects during the 5 years before and 5 years after RA incidence/index date.
Methods
This retrospective longitudinal cohort study was performed using the population-based resources of the Rochester Epidemiology Project (REP) medical records linkage system. The unique features of the REP with respect to epidemiological studies are described in a number of publications.[14-16] Briefly, this records linkage system allows ready access to the complete medical records from all health care providers from the Mayo Clinic and its affiliated hospitals, the Olmsted Medical Group, the Olmsted Community Hospital, local nursing homes, and the few private practitioners. The potential of this data system for population-based studies has been described elsewhere.[16] This system ensures virtually complete ascertainment of all clinically recognized cases of RA among the residents of Olmsted County, MN.
The study population comprised a retrospectively identified incidence cohort of RA patients who were Olmsted County, MN residents ≥18 years of age and first met the 1987 American College of Rheumatology (ACR) criteria [17] between 1/1/1988 and 1/1/2008 and have at least one lipid measure during the time period from 5 years before to 5 years after RA incidence date. Subjects with only one lipid measure do not contribute to the estimation of trends (i.e. slopes), but they do contribute information to the mean lipid levels and thus were included. RA incidence date was defined as the earliest date at which the patient fulfilled ≥4 ACR criteria for RA.
For each RA patient, a non-RA subject of similar age, sex, calendar year and length of medical history prior to index date was selected from the same population. Every person in the community ≥18 years of age who qualified during the defined period regardless of race, ethnicity, or socioeconomic status was equally eligible for the inclusion. Each non-RA subject was assigned an index date corresponding to the RA incidence date of the designated RA patient.
The original and complete medical records of all subjects were reviewed longitudinally by trained nurse abstractors, supervised by the principal investigator. Information regarding demographics (age and sex) and RA disease characteristics (disease duration and rheumatoid factor [RF] seropositivity) was collected.
All lipid measures (TCh, HDL, LDL and triglycerides [TG]) performed clinically from 5 years prior to RA incidence/index date to last follow-up were abstracted. In accordance with Adult Treatment Panel III (ATPIII) guidelines [18], abnormal lipid levels were defined as TCh ≥6.2 mmol/L (≥240 mg/dL), LDL ≥4.1 mmol/L (≥160 mg/dL), TG ≥2.3 mmol/L (≥200 mg/dL) or HDL <1.0 mmol/L (<40 mg/dL). Data on prescription of lipid-lowering medications (i.e. statins and other lipid-lowering drugs) were available for 1017 (91%) subjects from 1997 to the present. Extensive height and weight data were also available from 1997 to the present and were used to calculate body mass index (BMI). The study protocol was approved by the Institutional Review Boards from Mayo Clinic and Olmsted Medical Center.
Statistical Methods
Descriptive statistics (means, percentages, etc.) were used to summarize the lipid measures in the RA patients and non-RA subjects. Demographics of RA patients and non-RA subjects, as well as subjects with and without lipid measures, were compared using Chi-square tests and t-tests. Random effects models adjusting for age, sex, and calendar year of RA incidence/index date were used to analyze the trends in lipid profiles during the time period from 5 years before to 5 years after RA incidence/index date. These models account for multiple measurements per subject using random effects to fit individual intercepts and slopes for each subject. Furthermore, these models were used to estimate the percentage of RA patients and non-RA subjects with abnormal lipid measures before and after RA incidence/index date, as well as to examine the trends in BMI over the time period. Generalized additive models with smoothing splines were used to illustrate the trends in lipid levels over time.
Sensitivity analyses, wherein the original analyses were repeated under slightly different conditions, were performed to examine the change in results when: 1) using the date of first joint swelling instead of the date of 4th criteria as the index date, and 2) excluding patients using statins.
Results
A total of 647 Olmsted County, MN residents first met the ACR criteria for RA between 1/1/1988 and 1/1/2008. Of these, 577 patients had at least one lipid measure during the time period from 5 years before to 5 years after RA incidence date and thus were included in the study. The total number of lipid measurements in RA patients was 3,088 (median 4 measurements per patient). RA patients without lipid measures during the time period of interest (n=73) had similar sex and RF status compared to those with lipid measures. However, RA patients without lipid measures were younger (mean age 47.9 years, p<0.001) than RA patients with lipid measures. Within the same time period, lipid measurements were also available for 540 non-RA subjects with a total of 3,048 lipid measurements (median 4 measurements per subject). The spread of measurements was similar for both groups (mean 5.4 years, standard deviation (SD) 3.0 years for RA and mean 5.8 years, SD 3.2 years for non-RA (p=0.49). Non-RA subjects had similar age and sex characteristics compared to RA patients with lipid measures.
Demographic characteristics and the length of follow-up were similar in both RA and non-RA subjects (Table 1). The median follow-up was 5 years in each cohort as the follow-up was truncated at 5 years for these analyses. A full 5 years of follow-up after RA incidence/index date was available in 373 (65%) of RA patients and 377 (70%) of non-RA subjects. In addition, 531 (92%) of RA and 496 (92%) of non-RA subjects had 5 years of available information prior to RA incidence/index date. The mean time prior to RA incidence/index date was 4.8 years in both groups with a median of 5 years.
Table 1.
Characteristics of RA patients and non-RA subjects
| Variable | RA (n=577) |
Non-RA (n=540) |
|---|---|---|
| Mean age at RA incidence/index date, years (± sd) | 56.8 (± 15.0) | 56.4 (± 14.6) |
| Female, n (%) | 397 (69) | 378 (70) |
| RF positive, n (%) | 380 (66) | – |
| Observation time, years | ||
| Before incidence/index date, Mean (median) | 4.8 (5) | 4.8 (5) |
| After incidence/index date, Mean (median) | 4.2 (5) | 4.3 (5) |
| Lipid measurements | ||
| Total number | 3,088 | 3,048 |
| Mean (median) number per subject before incidence/index date | 3.0 (2) | 3.2 (2) |
| Mean (median) number per subject after incidence/index date | 3.1 (2) | 3.4 (3) |
RA = rheumatoid arthritis; RF = rheumatoid factor; sd = standard deviation
Figure 1 shows the trends in lipids during the 5 years before and 5 years after RA incidence/index date in the RA and non-RA cohorts. There was a significant decline in TCh and LDL levels during the 5 years before RA incidence/index date in the RA, but not in the non-RA cohort. During the 5 years after RA incidence/index date, the trends in TCh and LDL levels were similar in both RA and non-RA cohorts. HDL and TG levels in RA patients and non-RA subjects did not change significantly during the entire study period of 5 years before and 5 years after RA incidence/index date (Figure 1).
Figure 1.
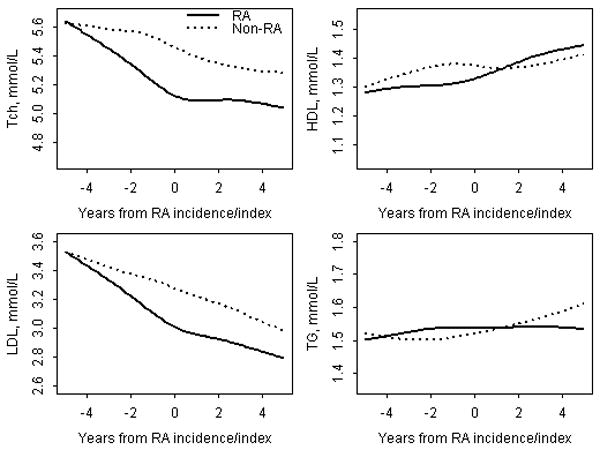
Trends in lipid levels in RA patients and non-RA subjects during the time period from 5 years before to 5 years after RA incidence/index date adjusting for age, sex and calendar year of RA diagnosis
RA = rheumatoid arthritis; TCh = Total Cholesterol; LDL = Low density Cholesterol; HDL = High density Cholesterol; TG = Triglycerides.
Table 2 summarizes the mean changes in lipid levels in the RA and non-RA cohorts. These results are derived from the random effects models. During the 5 years before RA incidence/index date, mean TCh and LDL levels in RA cohort decreased significantly (from 5.61 to 5.03 mmol/L and from 3.58 to 2.97 mmol/L, respectively) as compared to the non-RA cohort where the mean TCh and LDL levels decreased minimally (Table 2). Decreases in TCh and LDL levels in the RA cohort (by -0.58 mmol/L and -0.61 mmol/L, respectively) were significantly larger than those in non-RA cohort (p<0.001). The mean changes in lipid levels were otherwise similar in the RA and non-RA cohorts during the study period. RA patients experienced a larger decline in TCh:HDL ratio than non-RA subjects during the 5 years before RA (Table 2).
Table 2.
Mean changes in lipid levels in RA patients and non-RA subjects from 5 years before to 5 years after RA incidence/index date based on random effects models
| Lipid measure, mmol/L | Five-year change before RA incidence/index date | Five-year change after RA incidence/index date | ||
|---|---|---|---|---|
| RA | Non-RA | RA | Non-RA | |
| Total Cholesterol | -0.58* (-0.71, -0.44) |
-0.21 (-0.33, -0.09) |
-0.09 (-0.22, 0.04) |
-0.21 (-0.34, -0.08) |
| Low density Cholesterol | -0.61* (-0.73, -0.49) |
-0.27 (-0.38, -0.15) |
-0.22 (-0.33, -0.10) |
-0.28 (-0.39, -0.16) |
| High density Cholesterol | 0.08 (0.04, 0.12) |
0.05 (0.02, 0.09) |
0.13 (0.09, 0.18) |
0.07 (0.04, 0.11) |
| Triglycerides | -0.06 (-0.21, 0.10) |
-0.03 (-0.15, 0.10) |
-0.07 (-0.21, 0.08) |
0.02 (-0.12, 0.16) |
| TCh: HDL ratio | -0.7* (-0.9, -0.5) |
-0.4 (-0.5, -0.2) |
-0.5 (-0.6, -0.3) |
-0.4 (-0.5, -0.2) |
p<0.001 indicates difference in the lipid changes between RA and non-RA cohorts
Values in parentheses are 95% confidence intervals
Figure 2 shows the changes in the proportion of RA patients and non-RA subjects with abnormal lipid measures during the 5 years before and 5 years after RA incidence/index date. As seen from the figure, the proportion of RA patients with elevated TCh or LDL measures decreased significantly (p<0.001) during the 5 years before RA. No change in the proportion of subjects with abnormal TCh or LDL was seen in the non-RA cohort during the corresponding time period. During the 5 years after RA incidence/index date the proportions of both RA patients and non-RA subjects with elevated TCh and LDL measures remained essentially unchanged. The proportions of RA patients and non-RA subjects with abnormal HDL and TG measures did not change significantly over the study period (Figure 2).
Figure 2.
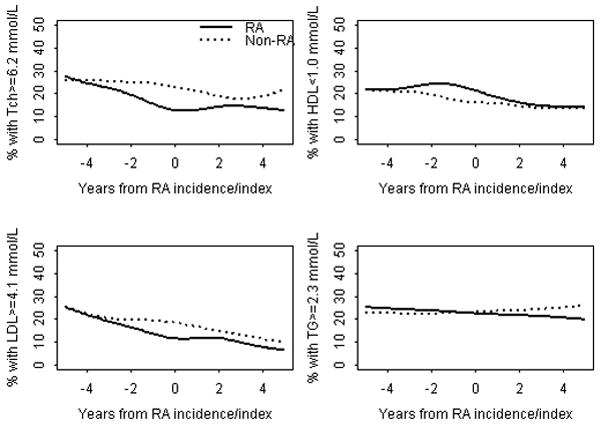
Trends in the proportion of patients with abnormal lipid measures in RA patients and non-RA subjects during 5 years before and 5 years after RA incidence/index date adjusting for age, sex and calendar year of RA diagnosis
RA = rheumatoid arthritis; TCh = Total Cholesterol; LDL = Low density Cholesterol; HDL = High density Cholesterol; TG = Triglycerides
We also examined the potential role of BMI and lipid-lowering drug use on these trends. There were no clinically significant changes in BMI in the RA cohort over the time period (mean BMI 27.7 kg/m2 5 years before RA incidence; 28.4 kg/m2 at RA incidence; 28.4 kg/m2 5 years after RA incidence). Non-RA subjects were more likely to have prescriptions for statins and other lipid-lowering drugs than RA patients. Among those for whom prescription data were available, 165 (32%) RA patients and 194 (39%) non-RA subjects had a prescription for statins (p=0.02). Similarly, 174 (34%) RA patients and 203 (41%) non-RA subjects had a prescription for any lipid-lowering treatment (p=0.02). To explore the impact of statins on the lipid changes we performed a sensitivity analysis excluding statin users. The trends in TCh, LDL, HDL and TG in RA patients not on statins were similar to those reported for the whole RA cohort (data not shown). However, the mean TG levels were considerably lower when statin users were removed, indicating that patients with the higher TG levels were likely taking statins.
To further investigate the nature of lipid changes in RA, we tested the hypothesis that the results would not change if we defined the index date as the date of the first joint swelling. We found that the time from first joint swelling to fulfillment of the 4th criteria for RA was minimal in the majority of patients (median 4.5 days; 25th percentile: 0 days, 75th percentile 108 days). In fact, 73% of patients met criteria within 90 days of first joint swelling and 80% met within 6 months of first joint swelling. Sensitivity analyses were performed using the date of first joint swelling in place of the 4th criteria date as the index date for these analyses, and the results were identical (data not shown).
Discussion
This retrospective cohort study illustrates the longitudinal trends in lipids in a population-based cohort of RA patients and non-RA subjects from the same underlying community during the period from 5 years before to 5 years after RA incidence/index date. There was a significant decrease in TCh and LDL levels, and a significant decrease in TCh:HDL ratio during the 5-year period before RA incidence. Lipid trends were otherwise similar in the RA and non-RA cohorts during the period from 5 years before to 5 years after RA. During the 5 years before RA incidence/index date, the proportion of RA patients with elevated TCh or LDL measures was significantly less compared to non-RA subjects.
To the best of our knowledge, this is the first longitudinal population-based study reporting long-term lipid trends in RA and non-RA populations both before and after RA incidence/index date. The major finding of our study is the significant decline in TCh and LDL levels occurring during the 5 years before RA incidence/index date in RA patients as compared to non-RA subjects. Consistent with the dynamics of TCh and HDL changes (i.e. decrease in TCh levels and unchanged HDL levels), RA patients also experienced a larger decline in TCh:HDL ratio than non-RA subjects during the 5 years before RA. The declines in TCh and LDL levels were similar when using the date of the first joint swelling as an index date. We also found a significant reduction of the proportion of patients with lipid abnormalities (elevated TCh or LDL measures) during 5 years before incidence/index date in the RA cohort, but not in non-RA subjects. The only previous longitudinal study describing lipid levels in the pre-RA period was performed using the samples of blood donors in Netherlands during 1984-1999 period who later developed RA.[19] These authors showed a more atherogenic lipid profile in the preclinical phase of rheumatoid arthritis. However, due to the differences in study population and design, as well as different time periods under study, these findings can not be directly compared to ours. The declining trend in TCh and LDL levels is concordant with studies showing lower TCh and LDL levels in active RA.[8,11] This observation is also consistent with the concept of lowering of the plasma cholesterol concentrations in acute (particularly, inflammatory) conditions.[20-23] In fact, this decrease in TCh and LDL levels might result from their increased catabolism or increased retention (i.e., subendothelial deposition) rather than decreased lipid production.[24,25] Subendothelial lipid deposition might explain the paradox of lower cholesterol levels and increased CV risk in RA. Indeed, low cholesterol concentrations have been previously associated with high mortality risk [26,27] and a poor response to tissue stress. [28,29]
Given that the major declines in TCh and LDL occurred during the pre-RA period, even before the first joint swelling, these changes were unlikely to be affected by antirheumatic treatment. The decreases in TCh and LDL levels in RA in our study are unlikely to be solely due to the use of lipid-lowering therapy either, since use of lipid lowering medications was lower in RA than in non-RA subjects and the lipid trends in RA patients were similar when statin users were excluded from the analysis. Hence, the lipid changes in the RA cohort occurring during the 5 years prior to RA are likely to be associated with the ongoing preclinical inflammation rather than the effect of antirheumatic and lipid-lowering medications. Lipid changes in non-RA subjects are consistent with the major lipid trends in the US population (studies NHANES and ARIC) suggesting that non-RA cohort reflects the general population.[30,31] These lipid changes can be explained by increasing usage of lipid-lowering drugs in the general population during the recent decades.[31] Similar explanation might be suggested for the changes in HDL and TG levels in non-RA subjects over time. Although trends in HDL and TG levels in the RA cohort were not significantly different from non-RA subjects, RA-specific mechanisms for these changes in RA patients can't be excluded. However, from this observational study, it is impossible to make inferences regarding the pathophysiological and clinical implications of lipid profile changes in RA. Thus, the reasons for these lipid changes in the RA population and the association of these trends with excess CV risk in RA are uncertain.
Strengths of the study include the population-based study design and the comprehensive data collection. The unique record linkage system allowed ascertainment of all RA cases from Olmsted County within the study period and provided comprehensive data on RA and non-RA subjects for the study. Our study takes advantage of the longitudinal design and parallel analysis of the lipid trends in RA patients and the non-RA comparison cohort within the same calendar period.
This study has a number of potential limitations. First, RA patients may have more physician visits and consequently may be more likely to have more lipid measurements than non-RA subjects. Similarly, patients with abnormal lipid values are more likely to have repeat measurements. However, the number of lipid measurements was similar in the RA and non-RA cohorts. Further, this weakness was minimized during the statistical analysis by accounting for multiple lipid measurements per subject. In this observational study, we did not analyze the role of traditional CV risk factors, inflammatory characteristics and antirheumatic medications in lipid profile changes in RA. The impact of these three potential contributors on lipid profile in RA was shown previously [7,9,19,35,36] and was beyond the scope of the present study. While data on lipid-lowering medications were not available prior to 1997, this was unlikely to bias the results as the limitation applied equally to both the RA and non-RA cohorts. While quantitative change in body weight in RA patients during the study period was not significant, there may have been changes in body composition which were not measured and thus may have been missed. A decrease in the muscle mass and an increase in the fat mass are common in RA patients and were shown to be associated with dyslipidemia.[34-36] However, increased, not decreased TCh and LDL levels would be expected in RA patients with rheumatoid cachectic obesity [36], so these metabolic changes are unlikely to explain the observed lipid changes in RA patients. Finally, during the calendar period of investigation the population of Olmsted County, MN was predominantly white. Thus, the results may not be generalizable to non-white individuals. Except for the higher proportion of the population with higher educational levels, other sociodemographic characteristics of Olmsted County, MN residents are similar to US whites.
In conclusion, RA patients experienced a significant decrease in TCh and LDL levels during the 5 years before RA incidence as compared to non-RA subjects. Lipid trends were otherwise similar in RA and non-RA cohorts during the 5 years before and 5 years after RA. The prevalence of abnormal TCh or LDL measures significantly decreased in the RA, but not in the non-RA cohort, during 5 years before RA incidence/index date. These lipid changes in RA are unlikely to be solely due to lipid-lowering therapy or changes in BMI. The reasons and the clinical significance for the apparent changes in lipid profile before RA are uncertain. Further studies regarding the association of RA characteristics and antirheumatic medications with lipid profile and CV outcomes in RA over time are underway.
Acknowledgments
Funding Source: This work was supported by an unrestricted grant from Roche Pharmaceuticals and also funded in part by a grant from the National Institutes of Health, NIAMS (R01 AR46849) and the National Institutes of Health (AR-30582) US Public Health Service
Footnotes
Financial Disclosures: None
References
- 1.Solomon DH, Goodson NJ, Katz JN, et al. Patterns of cardiovascular risk in rheumatoid arthritis. Ann Rheum Dis. 2006;65:1608–1612. doi: 10.1136/ard.2005.050377. [DOI] [PMC free article] [PubMed] [Google Scholar]
- 2.Maradit-Kremers H, Crowson CS, Nicola PJ, et al. Increased unrecognized coronary heart disease and sudden deaths in rheumatoid arthritis: a population-based cohort study. Arthritis Rheum. 2005;52:402–411. doi: 10.1002/art.20853. [DOI] [PubMed] [Google Scholar]
- 3.Rizzo M, Corrado E, Coppola G, et al. Markers of inflammation are strong predictors of subclinical and clinical atherosclerosis in women with hypertension. Coron Artery Dis. 2009;20:15–20. doi: 10.1097/MCA.0b013e3283109065. [DOI] [PubMed] [Google Scholar]
- 4.Rizzo M, Corrado E, Coppola G, et al. Prediction of cerebrovascular and cardiovascular events in patients with subclinical carotid atherosclerosis: the role of C-reactive protein. J Investig Med. 2008;56:32–40. doi: 10.2310/jim.0b013e31816204ab. [DOI] [PubMed] [Google Scholar]
- 5.Corrado E, Rizzo M, Muratori I, et al. Older age and markers of inflammation are strong predictors of clinical events in women with asymptomatic carotid lesions. Menopause. 2008;15(2):240–247. doi: 10.1097/gme.0b013e31812e6b60. [DOI] [PubMed] [Google Scholar]
- 6.Georgiadis AN, Papavasiliou EC, Lourida ES, et al. Atherogenic lipid profile is a feature characteristic of patients with early rheumatoid arthritis: effect of early treatment – a prospective, controlled study. Arthritis Res Ther. 2006;8:R82. doi: 10.1186/ar1952. [DOI] [PMC free article] [PubMed] [Google Scholar]
- 7.Choi HK, Seeger JD. Lipid profiles among US elderly with untreated rheumatoid arthritis – The Third National Health and Nutrition Examination Survey. J Rheumatol. 2005;32:2311–2316. [PubMed] [Google Scholar]
- 8.Park YB, Lee SK, Lee WK, et al. Lipid profiles in untreated patients with rheumatoid arthritis. J Rheumatol. 1999;26:1701–1704. [PubMed] [Google Scholar]
- 9.White D, Fayez S, Doube A. Atherogenic lipid profiles in rheumatoid arthritis. N Z Med J. 2006;119:U2125. [PubMed] [Google Scholar]
- 10.Hurt-Camejo E, Paredes S, Masana L, et al. Elevated levels of small, low-density lipoprotein with high affinity for arterial matrix components in patients with rheumatoid arthritis. Possible contribution of phospholipase A2 to this atherogenic profile. Arthritis Rheum. 2001;44:2761–2767. doi: 10.1002/1529-0131(200112)44:12<2761::aid-art463>3.0.co;2-5. [DOI] [PubMed] [Google Scholar]
- 11.Lazarevic MB, Vitic J, Mladenovic V, et al. Dyslipoproteinemia in the course of active rheumatoid arthritis. Semin Arthritis Rheum. 1992;22:172–178. doi: 10.1016/0049-0172(92)90017-8. [DOI] [PubMed] [Google Scholar]
- 12.Boers M, Nurmohamed MT, Doelman CJ, et al. Influence of glucocorticoids and disease activity on total and high density lipoprotein cholesterol in patients with rheumatoid arthritis. Ann Rheum Dis. 2003;62:842–845. doi: 10.1136/ard.62.9.842. [DOI] [PMC free article] [PubMed] [Google Scholar]
- 13.Choy E, Sattar N. Interpreting lipid levels in the context of high-grade inflammatory states with a focus on rheumatoid arthritis: a challenge to conventional cardiovascular risk actions. Ann Rheum Dis. 2009;68:460–469. doi: 10.1136/ard.2008.101964. [DOI] [PubMed] [Google Scholar]
- 14.Kurland L, Molgaard C. The patient record in epidemiology. Scientific American. 1981;245:54–63. doi: 10.1038/scientificamerican1081-54. [DOI] [PubMed] [Google Scholar]
- 15.Melton L. History of the Rochester Epidemiology Project. Mayo Clin Proc. 1996;71:266–274. doi: 10.4065/71.3.266. [DOI] [PubMed] [Google Scholar]
- 16.Maradit-Kremers H, Crowson CS, Gabriel SE. Rochester epidemiology project: a unique resource for research in the rheumatic diseases. Rheum Dis Clin North Am. 2004;30:819–834. doi: 10.1016/j.rdc.2004.07.010. [DOI] [PubMed] [Google Scholar]
- 17.Arnett FC, Edworthy SM, Bloch DA, et al. The American Rheumatism Association 1987 revised criteria for the classification of rheumatoid arthritis. Arthritis Rheum. 1988;31:315–324. doi: 10.1002/art.1780310302. [DOI] [PubMed] [Google Scholar]
- 18.Third Report of the National Cholesterol Education Program (NCEP) Expert Panel on Detection, Evaluation, and Treatment of High Blood Cholesterol in Adults (Adult Treatment Panel III) final report. Circulation. 2002;106:3143–3421. [PubMed] [Google Scholar]
- 19.van Halm VP, Nielen MM, Nurmohamed MT, et al. Lipids and inflammation: serial measurements of the lipid profile of blood donors who later developed rheumatoid arthritis. Ann Rheum Dis. 2007;66:184–188. doi: 10.1136/ard.2006.051672. [DOI] [PMC free article] [PubMed] [Google Scholar]
- 20.Rosenson RS. Myocardial injury: the acute phase response and lipoprotein metabolism. J Am Coll Cardiol. 1993;22:933–940. doi: 10.1016/0735-1097(93)90213-k. [DOI] [PubMed] [Google Scholar]
- 21.Marik PE. Dyslipidemia in the critically ill. Crit Care Clin. 2006;22:151–159. doi: 10.1016/j.ccc.2005.08.008. [DOI] [PubMed] [Google Scholar]
- 22.Vermont CL, den Brinker M, Kakeci N, et al. Serum lipids and disease severity in children with severe meningococcal sepsis. Crit Care Med. 2005;33:1610–1615. doi: 10.1097/01.ccm.0000171272.50888.ad. [DOI] [PubMed] [Google Scholar]
- 23.Akgun S, Ertel NH, Mosenthal A, et al. Postsurgical reduction of serum lipoproteins: interleukin-6 and the acute-phase response. J Lab Clin Med. 1998;131:103–108. doi: 10.1016/s0022-2143(98)90083-x. [DOI] [PubMed] [Google Scholar]
- 24.Carpentier YA, Scruel O. Changes in the concentration and composition of plasma lipoproteins during the acute phase response. Curr Opin Clin Nutr Metab Care. 2002;5:153–158. doi: 10.1097/00075197-200203000-00006. [DOI] [PubMed] [Google Scholar]
- 25.Pfohl M, Schreiber I, Liebich HM, et al. Upregulation of cholesterol synthesis after acute myocardial infarction: is cholesterol a positive acute phase reactant? Atherosclerosis. 1999;142:389–393. doi: 10.1016/s0021-9150(98)00242-1. [DOI] [PubMed] [Google Scholar]
- 26.Forette B, Tortrat D, Wolmark Y. Cholesterol as a risk factor for mortality in elderly women. Lancet. 1989;1:868–870. doi: 10.1016/s0140-6736(89)92865-1. [DOI] [PubMed] [Google Scholar]
- 27.Jacobs D, Blackburn H, Higgins M, et al. Report of the conference on low blood cholesterol: mortality associations. Circulation. 1992;86:1046–1060. doi: 10.1161/01.cir.86.3.1046. [DOI] [PubMed] [Google Scholar]
- 28.Schatz IJ, Masaki K, Yano K, et al. Cholesterol and all-cause mortality in elderly people from the Honolulu Heart Program: a cohort study. Lancet. 2001;358:351–355. doi: 10.1016/S0140-6736(01)05553-2. [DOI] [PubMed] [Google Scholar]
- 29.Esteve E, Ricart W, Fernández-Real JM. Dyslipidemia and inflammation: an evolutionary conserved mechanism. Clin Nutr. 2005;24:16–31. doi: 10.1016/j.clnu.2004.08.004. [DOI] [PubMed] [Google Scholar]
- 30.Szklo M, Chambless LE, Folsom AR, et al. Trends in plasma cholesterol levels in the atherosclerosis risk in communities (ARIC) study. Prev Med. 2000;30:252–259. doi: 10.1006/pmed.1999.0612. [DOI] [PubMed] [Google Scholar]
- 31.Carroll MD, Lacher DA, Sorlie PD, et al. Trends in serum lipids and lipoproteins of adults, 1960-2002. JAMA. 2005;294:1773–81. doi: 10.1001/jama.294.14.1773. [DOI] [PubMed] [Google Scholar]
- 32.García-Gómez C, Nolla JM, Valverde J, et al. High HDL-cholesterol in women with rheumatoid arthritis on low-dose glucocorticoid therapy. Eur J Clin Invest. 2008;38:686–692. doi: 10.1111/j.1365-2362.2008.01994.x. [DOI] [PubMed] [Google Scholar]
- 33.Steiner G, Urowitz MB. Lipid profiles in patients with rheumatoid arthritis: mechanisms and the impact of treatment. Semin Arthritis Rheum. 2009;38:372–381. doi: 10.1016/j.semarthrit.2008.01.015. [DOI] [PubMed] [Google Scholar]
- 34.Elkan AC, Engvall IL, Cederholm T, et al. Rheumatoid cachexia, central obesity and malnutrition in patients with low-active rheumatoid arthritis: feasibility of anthropometry, Mini Nutritional Assessment and body composition techniques. Eur J Nutr. 2009;48:315–22. doi: 10.1007/s00394-009-0017-y. [DOI] [PubMed] [Google Scholar]
- 35.Book C, Karlsson MK, Akesson K, et al. Early rheumatoid arthritis and body composition. Rheumatology (Oxford) 2009;48:1128–32. doi: 10.1093/rheumatology/kep165. [DOI] [PubMed] [Google Scholar]
- 36.Elkan AC, Håkansson N, Frostegård J, et al. Rheumatoid cachexia is associated with dyslipidemia and low levels of atheroprotective natural antibodies against phosphorylcholine but not with dietary fat in patients with rheumatoid arthritis: a cross-sectional study. Arthritis Res Ther. 2009;11:R37. doi: 10.1186/ar2643. [DOI] [PMC free article] [PubMed] [Google Scholar]