

Abstract
Genetic contribution to the development of attention deficit hyperactivity disorder (ADHD) is well established. Seven independent genome-wide linkage scans have been performed to map loci that increase the risk for ADHD. Although significant linkage signals were identified in some of the studies, there has been limited replications between the various independent datasets. The current study gathered the results from all seven of the ADHD linkage scans and performed a Genome Scan Meta Analysis (GSMA) to identify the genomic region with most consistent linkage evidence across the studies. Genome-wide significant linkage (PSR=0.00034, POR=0.04) was identified on chromosome 16 between 64 and 83 Mb. In addition there are nine other genomic regions from the GSMA showing nominal or suggestive evidence of linkage. All these linkage results may be informative and focus the search for novel ADHD susceptibility genes.
Keywords: ADHD, GSMA, linkage
Introduction
Attention deficit hyperactivity disorder (ADHD) is one of the most common childhood behavioral disorders characterized by early onset of age-inappropriate hyperactivity, impulsivity, and inattentiveness [Asherson, 2004]. Family and twin studies have consistently shown that genetic factors play an important role in ADHD etiology with heritability estimated around 76% [Faraone et al., 2005]. Meta analysis of candidate gene studies has confirmed small but significant association with variants within or close to genes such as dopamine D4 (DRD4) and D5 (DRD5) receptor genes [Faraone et al., 2005]. Novel genes are still to be discovered through hypothesis free genome-wide linkage and association studies.
To date, seven genome-wide ADHD linkage scans have been published and some chromosome regions such as 5p13, 14q12, and 17p11 have been indicated in multiple studies [Fisher et al., 2002; Bakker et al., 2003; Arcos-Burgos et al., 2004; Hebebrand et al., 2006; Ogdie et al., 2006; Faraone et al., 2007; Asherson et al., 2008; Romanos et al., 2008]. However, no chromosome region has been consistently identified across the scans and the majority of the findings were unique to each study. This is not unexpected because the power of individual scans is likely to be low for a complex trait such as ADHD which may only have genes of small to moderate effects [Risch and Merikangas, 1996; Waldman and Gizer, 2006]. A combined analysis of these studies is expected to provide more power to detect true linkage signals.
Although pooling the raw genotypic data to perform a new linkage analysis is an optimal strategy to maximize statistical power in detecting linkage, there are some difficulties associated with pooling raw data or interpreting results, especially when there are phenotypic heterogeneity or genetic map discrepancies between studies. The genome scan meta analysis (GSMA) method provides an important alternative strategy [Wise et al., 1999]. It is a rank-based non-parametric method specifically developed to evaluate the combined evidence for linkage from multiple genome scans. Apart from the power advantage, GSMA is also robust to differences in study design and analysis method and it is particularly suitable for identifying linkage regions that show very mild evidence of linkage across many studies [Levinson et al., 2003; Lewis et al., 2003]. Here, we apply the GSMA method to all seven published ADHD genome-wide linkage scans.
Materials and Methods
Genome Scan Meta Analysis (GSMA) Method and Heterogeneity Testing
GSMA divides the genome into N chromosome bins of approximately equal length (e.g., 120 bins of 30 cM), each bin containing at least one marker per study. Bin c.n. denotes the number nth bin on chromosome c from the p terminal (e.g., bin 5.4 is the fourth bin on chromosome 5). For each scan, the most significant result in each bin is recorded; this could be the highest LOD score in the interval or the smallest P-value. Within each study, the bins are ranked according to these results with the most significant bin ranked N. The ranks within a bin are then summed across studies to get the summed rank SR.
Bins with higher SR indicate evidence of linkage across the studies. The statistic PSR is the probability of observing a given SR under the null hypothesis of no susceptibility locus in the bin and it could be derived from a theoretical distribution or a permutation process. The 5% threshold for a genome-wide significant linkage is therefore PSR=0.05/N because there are a total number of N tests within one GSMA analysis [Wise et al., 1999] and for suggestive evidence of linkage is 1/N. Another statistic produced by GSMA is POR which is the probability of observing a given SR for a bin by chance in bins with the same place in the descending order from random permuted replicates. Multiple bins with PSR<0.05 and POR<0.05 give empirical evidence of linkage in a GSMA analysis [Levinson et al., 2003; Lewis et al., 2003].
To account for the sample size difference among studies which is related to the statistical power to test linkage, the ranks can be weighted by the number of cases or families included in each study and the significance of GSMA statistics evaluated by permutation. By this means, GSMA can explore the genome to pick up susceptibility loci that do not show significant linkage signals in a single study but have consistent sharing across multiple scans.
Compared with the other meta-analysis methods based on Fisher's combined P-value strategy, GSMA has the advantage to be applied on almost all the genome-wide linkage scans for the following reasons. Firstly, GSMA uses only the relative significance of a bin (rank) in the respective study. Therefore it is not necessary to have the same markers genotyped in different studies as long as there was one marker genotyped in each bin from each study. Secondly, the different studies do not need to be analyzed with the same statistical method (e.g., the result of parametric LOD score or non-parametric allele sharing statistics). Most importantly, GSMA can incorporate both affected sib pair and extended pedigree studies into the same meta-analysis. These advantages make GSMA applicable to most available studies and is the most widely used method in linkage meta analysis [Levinson et al., 2003; Lewis et al., 2003]. For a more detailed list of GSMA case studies, please go to the homepage (http://www.kcl.ac.uk/depsta/memoge/gsma/).
Heterogeneity among studies can be assessed by the Q statistic, which is defined as the sum of the squared deviations of each study's bin rank from the mean bin rank within the GSMA framework [Zintzaras and Ioannidis, 2005a]. The significance of Q statistics can be determined by permutations and it can be adjusted for differing sample sizes as well. Low between-study heterogeneity indicates consistency of study results in the same bin. Moreover, since the Q statistic is associated with the mean rank, an adjusted statistics Qadjusted can also be computed by permuting only the bins within ±2 average ranks [Zintzaras and Ioannidis, 2005a].
In the current study we used the GSMA program to get the summed rank SR, PSR, and POR statistics through 10,000 permutations [Pardi et al., 2005]. The 22 autosomes were divided into 120 bins according to the original GSMA protocol and the genome-wide significant threshold is 0.05/120=0.000417, and the threshold for suggestive evidence of linkage is 0.0083 [Wise et al., 1999; Levinson et al., 2003]. The program HEGESMA was used to get the Qadjusted and its P-values through 10,000 simulations [Zintzaras and Ioannidis, 2005b]. Both weighted and un-weighted GSMA analysis was performed. The un-weighted analysis assumes each study has the same statistical power. To address the power difference across studies, the weight given to each study in the weighted analysis was computed as the squared root of the number of cases in each study as shown in Table I. This weight is not idea because both affected sib pair and extended pedigree studies were included in the current analysis and the statistical power of each study is not strictly proportional to the number of cases. Therefore un-weighted GSMA analysis results were also presented.
TABLE I.
General Features of the Seven ADHD Linkage Genome Scans
| Ogdie et al. [2003] | Bakker et al. [2003] | Arcos-Burgos et al. [2004] | Hebebrand et al. [2006] | Faraone et al. [2007] | Asherson et al. [2008] | Romanos et al. [2008 | |
|---|---|---|---|---|---|---|---|
| Ethnicity | Caucasian + African American | Caucasian | Paisa decent | Caucasian | Caucasian + African American | Caucasian | Caucasian |
| Population | USA | Dutch | Columbia | German | USA | 8 European countries | German |
| Design | Affected sib pair | Affected sib pair | Multigenerational pedigree | Affected sib pair | Affected sib pair | Affected sib pair | Multigenerational pedigree |
| Sample size | 266 families, 308 pairs, 519 Cases | 106 families, 132 pairs, 238 cases | 18 pedigrees, 126 cases | 102 families, 127 pairs, 229 cases | 217 families, 384 pairs, 601 cases | 134 families, 142 pairs, 276 cases | 8 pedigrees, 95 cases |
| GSMA weight | 1.38 | 0.94 | 0.68 | 0.92 | 1.49 | 1.01 | 0.59 |
| Markers | 423 LMS STRs | Marshfield 402 STRs | ∼400 STRs (CIDR) | 475 STRs | IL-IV 5800 SNPs | IL-IV 5800 SNPs | 10 k SNP from Affymatrix 50 k Array |
| Type of analysis | Multipoint nonparametric MLS | Multipoint nonparametric MLS | Combined parametric multipoint linkage LOD | Multipoint nonparametric LOD | Multipoint nonparametric LOD | Multipoint nonparametric LOD | MOD global parametric LOD |
| Analysis program | Mapmaker/sibs | Mapmaker/sibs | FASTLINK | Merlin | Merlin | Merlin | Genehunter |
| Categorical diagnosis | Any DSM-IV diagnosis through “best-estimate procedure” 95% definitive, 5% probable | DSM-IV diagnosis through “best-estimate procedure” Narrow and Broad with autism disorder | DSM-IV diagnosis through “best-estimate procedure” | DSM-IV criteria applied in K-SADS-PL | DSM-IV criteria | DSM-IV criteria applied in PACS and Connor's teachers long rating scale | DSM-IV criteria with 23 subclinicals |
| Exclusion criteria | IQ ≤ 70; schizophrenia; autism | IQ ≤ 80; confounding psychiatric disorder | Not available | IQ ≤ 75; confounding psychiatric disorder; neurological disorder; physical brain damage; perinetal and postnatal environment factors | IQ ≤ 70; confounding psychiatric disorder; neurological disorder; physical brain damage | IQ ≤ 80 confounding psychiatric disorder | Not available |
Application of GSMA to 7 ADHD Scans
All the investigators from the seven published ADHD linkage scans contributed their original genome scan results for this GSMA analysis. A summary of the studies is shown in Table I. While two studies collected extended multi-generation pedigree samples, the other five adopted the affected sib pair design. The total number of cases is 2,084 of which 88% are Caucasian. All the studies applied the DSM-IV diagnostic criteria in the sample ascertainment process but used different data capture instruments. In some studies, cases with sub-threshold diagnosis or comorbid autism were also included in the analysis. For the current meta-analysis, only linkage statistics based on the stringent diagnostic criteria were included. The four studies published earlier were genotyped on microsatellite panels mapped on the Marshfield genetic map while the three recent scans were genotyped with SNP microarrays mapped to the Decode genetic map [Kong et al., 2002]. For the genetic map positions presented below, all the original Marshfield map positions were transformed into Decode map positions. The linkage statistics varied across studies due to the differences in their original study design and analysis methods.
Results
The un-weighted and weighted PSR statistics for each of the 120 bins are plotted in Figure 1. Significant thresholds for nominal (P<0.05) suggestive (P<0.0083) and genome-wide significant (P<0.00042) linkage are marked. Table II shows the full details of both weighted and un-weighted GSMA results, including PSR, POR and the adjusted heterogeneity test p-values PHet for the 10 bins with at least nominal linkage signals (P<0.05) from the un-weighted analysis.
Fig. 1.

Weighted (red) and unweighted (blue) −log10(PSR) from GSMA analysis of the 7 ADHD linkage scans. The thresholds of nominal (P=0.05) suggestive (P=0.0083) and genome-wide significant linkage (P=0.000417 after Bonferroni correction) are shown.
TABLE II.
Bins With Linkage Signals From the Un-Weighted GSMA
| Bin | Boundary | Un-weighted | Weighted | |||||||
|---|---|---|---|---|---|---|---|---|---|---|
| Genetica (cM) | Physicalb (Mb) | SR | PSR | POR | PHet | SR | PSR | POR | PHet | |
| 5.3 | 71–103 | 56–88 | 582 | 0.04238 | 0.111 | 0.76 | 562 | 0.07509 | 0.151 | 0.86 |
| 6.3 | 65–98 | 43–91 | 583 | 0.04136 | 0.208 | 0.77 | 568 | 0.06669 | 0.255 | 0.83 |
| 6.4 | 98–131 | 91–132 | 577 | 0.04723 | 0.036 | 0.76 | 573 | 0.06012 | 0.436 | 0.64 |
| 7.3 | 60–91 | 39–78 | 631 | 0.01063 | 0.368 | 0.45 | 621 | 0.01805 | 0.371 | 0.27 |
| 8.1 | 0–25 | 0–13 | 595 | 0.03054 | 0.297 | 0.80 | 567 | 0.06843 | 0.162 | 0.85 |
| 9.4 | 81–107 | 85–106 | 594 | 0.03094 | 0.150 | 0.40 | 620 | 0.01857 | 0.174 | 0.40 |
| 15.1 | 0–29 | 0–31 | 578 | 0.04611 | 0.077 | 0.32 | 571 | 0.06325 | 0.335 | 0.31 |
| 16.3 | 65–99 | 51–78 | 617 | 0.01663 | 0.322 | 0.47 | 651 | 0.00719 | 0.211 | 0.55 |
| 16.4 | 99–130 | 78–88 | 714 | 0.00034 | 0.041 | 0.60 | 718 | 0.00038 | 0.045 | 0.40 |
| 17.1 | 0–32 | 0–11 | 602 | 0.02534 | 0.361 | 0.69 | 589 | 0.04232 | 0.226 | 0.55 |
aGenetic map positions are according to Decode genetic map.
bPhysical map positions are according to NCBI Genome Build 35.
Linkage signals from both the weighted (SR=718, PSR=0.00038, POR=0.041) and un-weighted (SR=714, PSR=0.00034, POR=0.04) analyses in bin 16.4 (16q23.1-qter) were genome-wide significant for PSR (according to Lander and Kruglyak's criteria after a Bonferroni correction for the number of bins) [Lander and Kruglyak, 1995]. The POR of around 0.04 from both the weighted and un-weighted analyses enhances the evidence that this bin is linked to ADHD. Nine additional bins on chromosomes 5, 6, 7, 8, 9, 15, 16, 17 showed nominal linkage signals (PSR<0.05) from the un-weighted analysis. For each of the 10 bins with linkage signals, the PSR statistics did not differ dramatically between the weighted and un-weighted analyses with the highest weighted PSR<0.08 as shown in Table II. Furthermore, no significant rank heterogeneity among the studies was observed for any of the 10 bins. This heterogeneity test result was expected because the total number of seven studies provides limited statistical power to detect heterogeneity when the gene effect is relatively small or moderate [Lewis and Levinson, 2006].
Discussion
In the current study, our primary un-weighted GSMA analysis identified a total number of 10 chromosomal regions with nominal linkage signals (PSR<0.05). Under the null hypothesis of no linkage in any of the 120 bins, only 6 such bins are expected by chance and the probability of observing 10 or more is 0.077 [Wise et al., 1999]. These results suggest that some of the bins in our primary GSMA analysis, as nominated by individual linkage scans collectively, are likely to harbor ADHD genes.
The most significant finding in this GSMA analysis was identified in bin 16.4 which covers the chromosome region from 16q23.1 to the q terminal. Details of the linkage statistics within this bin are plotted in Figure 2. This bin had the maximum rank (rank=120) in two scans with multipoint nonparametric LOD=3.1 in the Asherson et al. [2008] study and MODglobal=3.2 in the Romanos et al. [2008] study. Nominal linkage signals were also observed in two scans with Multipoint Nonparametric MLS of 1.05 (rank=109) and 1.08 (rank=105) in the Ogdie et al. [2003] study and the Bakker et al. [2003] study respectively. Even in the other three scans with no linkage signal, the ranks for this bin are also higher than average with ranks of 80, 73 and 112 in the Faraone et al. [2007] study, the Hebebrand et al. [2006] study and the Arcos-Burgos et al. [2004] study respectively. Although none of these scans reached genome-wide significance on their own, these moderate findings had collectively contributed to a genome-wide significant linkage signal as identified by GSMA.
Fig. 2.
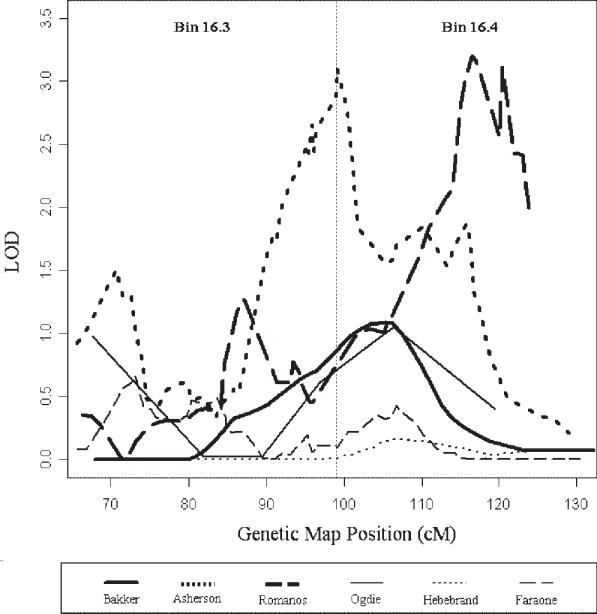
Individual linkage scan results for chromosome 16q (bins 16.3–16.4) from 6 studies.
Interestingly bin 16.3, which is next to bin 16.4 also showed nominal linkage signal (P=0.017) from the un-weighted GSMA analysis and suggestive linkage (P=0.0072) in the weighted GSMA analysis. This observation of clustered significant linkage bins could be explained by the fact that one multipoint linkage signal could extend 30–50 cM and affect the ranks of adjacent bins [Wise et al., 1999]. To explore this possibility, we repeated the GSMA analysis by shifting the bin boundaries 15 cM forward [Levinson et al., 2003]. The new bin covering chromosome 16q21–16q24 remained genome-wide significant and the adjacent bins showed no linkage signals. These results suggest that one strong linked locus within the new bin (64–83 Mb on the NCBI genome build 35) may account for both 16.3 and 16.4 signals in our primary GSMA analysis. It is also supported by the details of the linkage statistics as shown in Figure 2 that most of the linkage peaks in bin 16.4 extended to bin 16.3.
There are more than 200 annotated genes within bin 16.4, none of which have been previously examined in ADHD candidate gene association studies due to their lack of known functional relevance to the disorder. However, a recent genome-wide association scan found that the CDH13 (a cell adhesion molecule), which is located on chromosome 16q24, is associated with methamphetamine dependence [Uhl et al., 2008]. Another genome-wide QTL association scan using the IMAGE sample also found markers within CDH13 to be strongly associated with total ADHD symptom scores within children diagnosed with ADHD [Jessica Su et al., in this issue]. Whether genetic variations of CDH13 explain the linkage signals in this region is beyond the scope of the current study. Further fine mapping studies or combined linkage and association analysis are expected to address this issue.
Bin 5.3, which covers chromosome 5q11.2–q14.3, is another region with a nominal linkage signal in our GSMA analysis. It is worth noting that this bin is 40 cM away from the chromosome 5p13 region that was indicated as a potential locus for ADHD by two previous linkage scans [Hebebrand et al., 2006; Ogdie et al., 2006]. It is unlikely that the GSMA signal observed in bin 5.3 is contributed by linkage to 5p13 as the other five studies showed no linkage at this locus. However, it does not mean we should not pursue the 5p13 linkage region either, because GSMA only identifies promising regions and is not used for exclusion mapping. Indeed, further fine mapping of the 5p13 region has identified genetic variation of SLC6A3 (dopamine transporter gene) as a potential explanation for the linkage signal [Ogdie et al., 2004; Friedel et al., 2007].
Although the majority of the subjects included in this study have white European ancestry, the potential influence of genetic heterogeneity (namely population specific loci) on the GSMA analysis should not be ignored [Zintzaras and Ioannidis, 2005a; Lewis and Levinson, 2006]. For example the Arcos-Burgos study used extended pedigrees from a Paisa population isolate from Columbia and identified genome-wide significant linkage on chromosome 4q13 which was confirmed by further fine mapping [Arcos-Burgos et al., 2004].
In summary, this GSMA analysis of all seven published ADHD linkage scans suggests that some chromosome regions identified in the original studies might harbor ADHD genes. As shown by the recent identification of CNTNAP2 as an autism susceptibility gene, linkage evidence can play an important role in gene discovery [Alarcon et al., 2008; Arking et al., 2008; Stephan, 2008]. We conclude that chromosome regions such as 16q22–16q24 which show genome-wide significant linkage are worthy of attention even in the era of genome-wide association studies.
Acknowledgments
The Asherson et al. study is supported by NIH (R01HD37694 and R01MH62873 to S.V.F.). The Ogdie et al. study is supported by NIMH (MH058277 to S.L.S. and MH071852 to S.F.N.), and a fellowship from the Academy of Finland (Ekholm), The Bakker et al. study is supported by the Mammalian Genotyping Service of the Marshfield Medical Research Foundation, and by grants from the Makaria Foundation, the UMC Utrecht's Genvlag program, and the Catharijne Foundation, J.M. and C.F. are supported by the Deutsche Forschungsgemeinschaft (DFG ME 1923/5-1, ME 1923/5-3, GRK 1389/1); M.R., C.J., T.T.N., S.W., T.J.R., A.W., H.S., A.R., and K.P.L. are supported by the Deutsche Forschungsgemeinschaft (DFG: KFO 125, SFB 581) and the Bundesministerium für Bildung und Forschung (BMBF: 01GV0605), GSMA methodology development is supported by MRC (G0400960 to C.M.L.).
Grant sponsor: NIH; Grant numbers: R01HD37694, R01MH62873; Grant sponsor: NIMH; Grant numbers: MH058277, MH071852; Grant sponsor: Academy of Finland (Ekholm); Grant sponsor: MRC; Grant number: G0400960.
References
- Alarcon M, Abrahams BS, Stone JL, Duvall JA, Perederiy JV, Bomar JM, Sebat J, Wigler M, Martin CL, Ledbetter DH, et al. Linkage, association, and gene-expression analyses identify CNTNAP2 as an autism-susceptibility gene. Am J Hum Genet. 2008;82:150–159. doi: 10.1016/j.ajhg.2007.09.005. [DOI] [PMC free article] [PubMed] [Google Scholar]
- Arcos-Burgos M, Castellanos FX, Pineda D, Lopera F, Palacio JD, Palacio LG, Rapoport JL, Berg K, Bailey-Wilson JE, Muenke M. Attention-deficit/hyperactivity disorder in a population isolate: Linkage to loci at 4q13.2, 5q33.3, 11q22, and 17p11. Am J Hum Genet. 2004;75:998–1014. doi: 10.1086/426154. [DOI] [PMC free article] [PubMed] [Google Scholar]
- Arking DE, Cutler DJ, Brune CW, Teslovich TM, West K, Ikeda M, Rea A, Guy M, Lin S, Cook EH, et al. A common genetic variant in the neurexin superfamily member CNTNAP2 increases familial risk of autism. Am J Hum Genet. 2008;82:160–164. doi: 10.1016/j.ajhg.2007.09.015. [DOI] [PMC free article] [PubMed] [Google Scholar]
- Asherson P. Attention-deficit hyperactivity disorder in the post-genomic era. Eur Child Adolesc Psychiatry. 2004;13(Suppl 1):I50–I70. doi: 10.1007/s00787-004-1006-6. [DOI] [PubMed] [Google Scholar]
- Asherson P, Zhou K, Anney RJ, Franke B, Buitelaar J, Ebstein R, Gill M, Altink M, Arnold R, Boer F, et al. A high-density SNP linkage scan with 142 combined subtype ADHD sib pairs identifies linkage regions on chromosomes 9 and 16. Mol Psychiatry. 2008;13:514–521. doi: 10.1038/sj.mp.4002140. [DOI] [PubMed] [Google Scholar]
- Bakker SC, van der Meulen EM, Buitelaar JK, Sandkuijl LA, Pauls DL, Monsuur AJ, van't SR, Minderaa RB, Gunning WB, Pearson PL, et al. A whole-genome scan in 164 Dutch sib pairs with attention-deficit/hyperactivity disorder: Suggestive evidence for linkage on chromosomes 7p and 15q. Am J Hum Genet. 2003;72:1251–1260. doi: 10.1086/375143. [DOI] [PMC free article] [PubMed] [Google Scholar]
- Faraone SV, Perlis RH, Doyle AE, Smoller JW, Goralnick JJ, Holmgren MA, Sklar P. Molecular genetics of attention-deficit/hyperactivity disorder. Biol Psychiatry. 2005;57:1313–1323. doi: 10.1016/j.biopsych.2004.11.024. [DOI] [PubMed] [Google Scholar]
- Faraone SV, Doyle AE, Lasky-Su J, Sklar PB, D'Angelo E, Gonzalez-Heydrich J, Kratochvil C, Mick E, Klein K, Rezac AJ, et al. Linkage analysis of attention deficit hyperactivity disorder. Am J Med Genet B Neuropsychiatr Genet. 2007 doi: 10.1002/ajmg.b.30631. in press. [DOI] [PMC free article] [PubMed] [Google Scholar]
- Fisher SE, Francks C, McCracken JT, McGough JJ, Marlow AJ, MacPhie IL, Newbury DF, Crawford LR, Palmer CG, Woodward JA, et al. A genomewide scan for loci involved in attention-deficit/hyperactivity disorder. Am J Hum Genet. 2002;70:1183–1196. doi: 10.1086/340112. [DOI] [PMC free article] [PubMed] [Google Scholar]
- Friedel S, Saar K, Sauer S, Dempfle A, Walitza S, Renner T, Romanos M, Freitag C, Seitz C, Palmason H, et al. Association and linkage of allelic variants of the dopamine transporter gene in ADHD. Mol Psychiatry. 2007;12:923–933. doi: 10.1038/sj.mp.4001986. [DOI] [PubMed] [Google Scholar]
- Hebebrand J, Dempfle A, Saar K, Thiele H, Herpertz-Dahlmann B, Linder M, Kiefl H, Remschmidt H, Hemminger U, Warnke A, et al. A genome-wide scan for attention-deficit/hyperactivity disorder in 155 German sib-pairs. Mol Psychiatry. 2006;11:196–205. doi: 10.1038/sj.mp.4001761. [DOI] [PubMed] [Google Scholar]
- Kong A, Gudbjartsson DF, Sainz J, Jonsdottir GM, Gudjonsson SA, Richardsson B, Sigurdardottir S, Barnard J, Hallbeck B, Masson G, et al. A high-resolution recombination map of the human genome. Nat Genet. 2002;31:241–247. doi: 10.1038/ng917. [DOI] [PubMed] [Google Scholar]
- Lander E, Kruglyak L. Genetic dissection of complex traits: Guidelines for interpreting and reporting linkage results. Nat Genet. 1995;11:241–247. doi: 10.1038/ng1195-241. [DOI] [PubMed] [Google Scholar]
- Levinson DF, Levinson MD, Segurado R, Lewis CM. Genome scan meta-analysis of schizophrenia and bipolar disorder, part I: Methods and power analysis. Am J Hum Genet. 2003;73:17–33. doi: 10.1086/376548. [DOI] [PMC free article] [PubMed] [Google Scholar]
- Lewis CM, Levinson DE. Testing for genetic heterogeneity in the genome search meta-analysis method. Genet Epidemiol. 2006;30:348–355. doi: 10.1002/gepi.20149. [DOI] [PubMed] [Google Scholar]
- Lewis CM, Levinson DF, Wise LH, DeLisi LE, Straub RE, Hovatta I, Williams NM, Schwab SG, Pulver AE, Faraone SV, et al. Genome scan meta-analysis of schizophrenia and bipolar disorder, part II: Schizophrenia. Am J Hum Genet. 2003;73:34–48. doi: 10.1086/376549. [DOI] [PMC free article] [PubMed] [Google Scholar]
- Ogdie MN, Macphie IL, Minassian SL, Yang M, Fisher SE, Francks C, Cantor RM, McCracken JT, McGough JJ, Nelson SF, et al. A genomewide scan for attention-deficit/hyperactivity disorder in an extended sample: Suggestive linkage on 17p11. Am J Hum Genet. 2003;72:1268–1279. doi: 10.1086/375139. [DOI] [PMC free article] [PubMed] [Google Scholar]
- Ogdie MN, Fisher SE, Yang M, Ishii J, Francks C, Loo SK, Cantor RM, McCracken JT, McGough JJ, Smalley SL, et al. Attention deficit hyperactivity disorder: Fine mapping supports linkage to 5p13, 6q12, 16p13, and 17p11. Am J Hum Genet. 2004;75:661–668. doi: 10.1086/424387. [DOI] [PMC free article] [PubMed] [Google Scholar]
- Ogdie MN, Bakker SC, Fisher SE, Francks C, Yang MH, Cantor RM, Loo SK, van der ME, Pearson P, Buitelaar J, et al. Pooled genome-wide linkage data on 424 ADHD ASPs suggests genetic heterogeneity and a common risk locus at 5p13. Mol Psychiatry. 2006;11:5–8. doi: 10.1038/sj.mp.4001760. [DOI] [PubMed] [Google Scholar]
- Pardi F, Levinson DF, Lewis CM. GSMA: Software implementation of the genome search meta-analysis method. Bioinformatics. 2005;21:4430–4431. doi: 10.1093/bioinformatics/bti725. [DOI] [PubMed] [Google Scholar]
- Risch N, Merikangas K. The future of genetic studies of complex human diseases. Science. 1996;273:1516–1517. doi: 10.1126/science.273.5281.1516. [DOI] [PubMed] [Google Scholar]
- Romanos M, Freitag C, Jacob C, Craig DW, Dempfle A, Nguyen TT, Halperin R, Walitza S, Renner TJ, Seitz C, et al. Genome-wide linkage analysis of ADHD using high-density SNP arrays: Novel loci at 5q13.1 and 14q12. Mol Psychiatry. 2008;13:522–530. doi: 10.1038/mp.2008.12. [DOI] [PubMed] [Google Scholar]
- Stephan DA. Unraveling autism. Am J Hum Genet. 2008;82:7–9. doi: 10.1016/j.ajhg.2007.12.003. [DOI] [PMC free article] [PubMed] [Google Scholar]
- Uhl GR, Drgon T, Liu QR, Johnson C, Walther D, Komiyama T, Harano M, Sekine Y, Inada T, Ozaki N, et al. Genome-wide association for methamphetamine dependence: Convergent results from 2 samples. Arch Gen Psychiatry. 2008;65:345–355. doi: 10.1001/archpsyc.65.3.345. [DOI] [PubMed] [Google Scholar]
- Waldman ID, Gizer IR. The genetics of attention deficit hyperactivity disorder. Clin Psychol Rev. 2006;26:396–432. doi: 10.1016/j.cpr.2006.01.007. [DOI] [PubMed] [Google Scholar]
- Wise LH, Lanchbury JS, Lewis CM. Meta-analysis of genome searches. Ann Hum Genet. 1999;63:263–272. doi: 10.1046/j.1469-1809.1999.6330263.x. [DOI] [PubMed] [Google Scholar]
- Zintzaras E, Ioannidis JP. Heterogeneity testing in meta-analysis of genome searches. Genet Epidemiol. 2005a;28:123–137. doi: 10.1002/gepi.20048. [DOI] [PubMed] [Google Scholar]
- Zintzaras E, Ioannidis JP. HEGESMA: Genome search meta-analysis and heterogeneity testing. Bioinformatics. 2005b;21:3672–3673. doi: 10.1093/bioinformatics/bti536. [DOI] [PubMed] [Google Scholar]