
Figure 1.
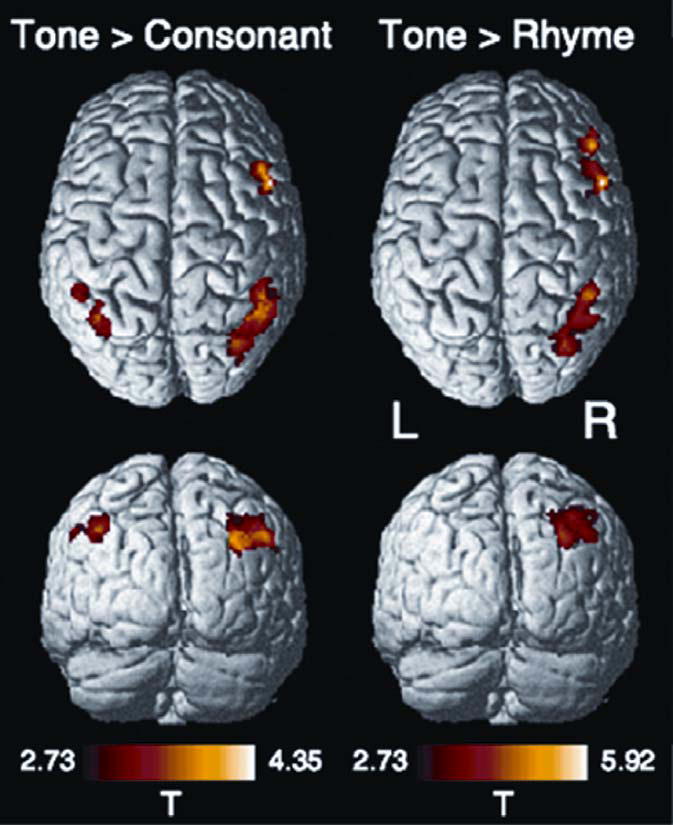
Rendered statistical maps showing significant differences in BOLD response of tone over consonant ([Tr-Tf] > [Cr-Cf]; left column) and tone over rhyme ([Tr-Tf] > [Rr-Rf]; right column). Only voxels found within significant clusters (p < 0.05, corrected for multiple comparisons) are shown. The color scale depicts the range of t-statistic values. Voxel-wise display threshold, p = 0.005, uncorrected; Z > 3.72. L = left; R = right.