Abstract
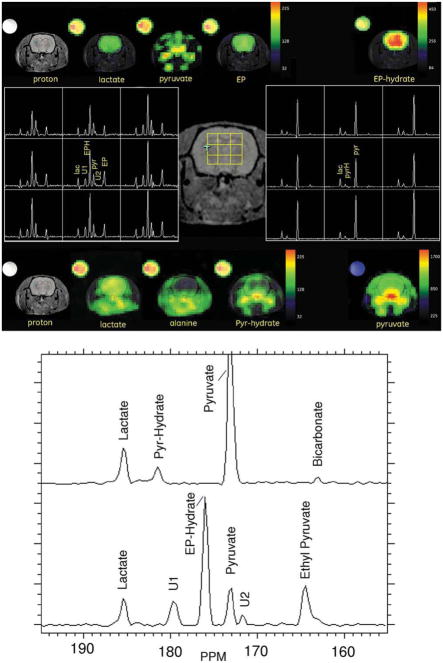
Formulation, polarization, and dissolution conditions were developed to obtain a stable hyperpolarized solution of [1-13C]-ethyl pyruvate. A maximum tolerated concentration and injection rate were determined, and 13C spectroscopic imaging was used to compare the uptake of hyperpolarized [1-13C]-ethyl pyruvate relative to hyperpolarized [1-13C]-pyruvate into anesthetized rat brain. Hyperpolarized [1-13C]-ethyl pyruvate and [1-13C]-pyruvate metabolic imaging in normal brain is demonstrated and quantified in this feasibility and range-finding study.
Keywords: hyperpolarized, carbon-13, ethyl-pyruvate, brain, pyruvate, lactate
MR metabolic imaging of hyperpolarized [1-13C]-pyruvate has proven to be useful, especially in oncology and cardiology (1,2). Dynamic and tissue level changes in [1-13C]-pyruvate and its metabolic products, [1-13C]-lactate, [1-13C]-alanine, and [13C] bicarbonate, have been shown to correlate with metabolic states of interest, including disease progression (3,4) and response to therapy (5,6). However, for potential neurologic applications, the blood-brain transport of pyruvate may be a limiting factor. Age, anesthesia, and dietary state can all impact transport rates (7–9), and under some conditions, the 1- to 2-min window of useful hyperpolarized [1-13C]-pyruvate lifetime in vivo may not be sufficient. The brain uptake index (a measure of metabolite in brain versus blood), as reported for pyruvate in normal anesthetized rat brain 10 sec after an arterial injection (7), suggests that even at the very highest intravascular doses possible, less than 1 mM pyruvate would be transported into brain tissue. An alternative approach is the use of ethyl pyruvate (EP), a lipophilic analog of pyruvate that is expected to have faster transport across the blood-brain barrier. EP is a food additive and has been studied as an anti-inflammatory compound with therapeutic potential (10). Biologic and therapeutic differences between EP and pyruvate are not fully understood. EP has been shown to attenuate kainic acid–induced neuronal cell death in the mouse hippocampus (11) and reduce the impact of stroke (12). Under conditions of slow intravenous infusion, EP is tolerated in large doses in both animals and humans (13). In this initial study, we explore the feasibility of polarizing a stable formulation of [1-13C]-EP and compare spectroscopic images of uptake and metabolism in normal anesthetized rat brain relative to the uptake and metabolism of hyperpolarized [1-13C]-pyruvate.
MATERIALS AND METHODS
Animal Preparation
The experiments were performed on nine healthy (160–295 g) male Wistar rats anesthetized with 1–3% isoflurane in oxygen (~1.5 L/min). Respiration, rectal temperature, heart rate, and oxygen saturation were monitored throughout the experiment. Rectal temperature was kept at 37°C by heating the animal with a temperature-controlled warm water blanket. Hyperpolarized solution was injected via tail vein catheter. For imaging studies, rats were injected two or more times at a 2-h interval with either pyruvate or EP solutions. Preparation and physiologic monitoring of the animals in the 13C experiment followed the protocol approved by the local Institutional Animal Care and Use Committees. Maximum tolerated concentration and injection rate of EP were determined by dose escalation.
Hyperpolarized [1-13C] Pyruvate
Hyperpolarized solutions of [1-13C]-pyruvate were prepared as described previously (14), using a HyperSense polarizer (Oxford Instruments Molecular Biotools, Oxford, UK). The concentration of the dose used in rats H76 and H88 was 100 mM. Rats H91, H92, H110, and H111 were injected at 80 mM (see Table 1). The level of liquid state polarization was estimated from solid state dynamic nuclear polarization (DNP) buildup levels. A calibration of the solid-state DNP level with liquid state polarization was made on the 3-T scanner, using the pyruvate thermal equilibrium signal, as well as the thermal equilibrium signal of an 8-M 13C-urea standard. Liquid- state polarization levels ranged from 20–25%. The pyruvate T1 at 3 T and apparent T1 during the low field transfer process were also determined to help estimate losses between dissolution and injection. The time delay between dissolution to injection into the animal ranged from 23–25 sec. The total rat dose ranged from 120–300 μmol of pyruvate, injected at rates from 44–88 nmol sec−1 g(rat)−1.
Table 1.
Dose and Brain Tissue Levels*
| Rat ID | Animal weight (g) | Dose, μmol g(rat)−1 | Dose rate, nmol g(rat)−1 sec−1 | Polarization % | 8-M urea SNR | Dissolution to injection delay (seg) | Injection to image delay (sec) | Lactate (μmol g−1) | Pyruvate (μmol g−1) | EP + EP-hydrate (μmol g−1)c | Total carbon (μmol g−1) |
|---|---|---|---|---|---|---|---|---|---|---|---|
| Pyruvatea | |||||||||||
| H76 | 282 | 1.06 | 89 | 21.8 | 26 | 23 | 20 | 0.134 | 0.628 | 0.762 | |
| H88 | 278 | 1.01 | 59 | 25.6 | 17 | 24 | 36 | 0.132 | 0.136 | 0.268 | |
| H91 | 160 | 0.75 | 83 | 20.6 | 28 | 25 | 45 | 0.098 | 0.016 | 0.114 | |
| H92 | 181 | 0.80 | 44 | 21.2 | 29 | 24 | 45 | 0.217 | 0.056 | 0.273 | |
| H110 | 170 | 0.85 | 94 | 28.8 | 30 | 31 | 20 | 0.086 | 0.118 | 0.204 | |
| H111 | 197 | 0.975 | 89 | 21.0 | 31 | 28 | 20 | 0.119 | 0.273 | 0.392 | |
| Ethyl pyruvateb | |||||||||||
| H76 | 282 | 0.53 | 44 | 28.1 | 27 | 25 | 20 | 0.097 | 0.105 | 0.626 | 0.828 |
| H77 | 295 | 0.51 | 42 | 29.7 | 27 | 27 | 20 | 0.137 | 0.119 | 1.556 | 1.812 |
| H91 | 160 | 0.47 | 26 | 33.7 | 28 | 23 | 25 | 0.169 | 0.104 | 0.769 | 1.042 |
| H92 | 181 | 0.41 | 21 | 35.2 | 29 | 26 | 25 | 0.142 | 0.092 | 0.670 | 0.904 |
Brain levels determined relative to 13C urea reference.
EP portion of EP + EP-hydrate corrected for rat blood T1 of 22 sec.
Brain levels corrected using a dissolution to injection T1 of 65 sec and a rat blood T1 of 42 sec (15).
Brain levels corrected using a measured polarizer-to-magnet T1 of 45 sec and a rat blood T1 of 27 sec.
Hyperpolarized [1-13C] EP
The stability of EP in the aqueous dissolution media was optimized based on pH and high resolution 9.4 T 1H/13C NMR (Varian Inc., Palo Alto, CA). Conditions that yielded a mixture of EP and pyruvate provided a simpler and more stable solution than was found for tris(hydroxy-methyl) aminomethane (TRIS) buffer or with the Ringer’s EP formula (10). The unavoidable presence of trityl in the polarized mixture was found to catalyze the formation of unwanted contamination (5–7%). [1-13C]-EP (CIL, Cambridge, MA) was freshly prepared as a 6.0-M EP solution (20% volume-to-volume 100% ethanol) containing 15-mM trityl (Finland) and 1 mM of a gadolinium chelate (gadoteridol; Prohance; Bracco International, Milan, Italy); 50 μL of the formulation (300 μmol) was polarized using optimized DNP conditions that were identical to those used for pyruvic acid. Dissolution with 4.0 mL of 25-mM NaOH containing 100 mg/L disodium ethylenediaminetetraacetate (EDTA) yielded a 50-mM EP/25-mM pyruvate mix, 1.5–3.0 mL of which was injected into each of the rats. Over a broad range, the addition of more or less NaOH does not impact the pH range or stability of the EP injection, but rather alters the pyruvate to EP ratio. Thus, prior to each in vivo study, room-temperature dissolution of a small aliquot of the formulation was tested using high-resolution NMR to ensure the correct ratio of pyruvate and EP, as well as to ensure minimum levels of trityl-catalyzed contaminants. The resulting EP mix was found to have a pH of 6.7 ± 1 and be stable for over 1 h. The time delay between dissolution and injection into the animal ranged from 23–27 sec. EP polarization was estimated using a calibrated solid-state 13C signal and ranged from 28 to 35%.
MR Hardware and Methods
All experiments were performed on a 3-T Signa MR Scanner (GE Healthcare, Waukesha, WI) equipped with self-shielded gradients (40 mT/m, 150 mT/m/ms). A custom- built dual-tuned (1H/13C) quadrature rodent coil (inner diameter: 50mm), operating at 127.7 MHz and 32.1 MHz, respectively, was used for both RF excitation and signal reception on all but one study. Data for rat H88 were collected using a coil of similar design, but with a larger inner diameter of 80mm. Signal-to-noise ratios (SNR) are given in Table 1.
13C Spectroscopic Imaging
Spectroscopic imaging of the brain used a modified FIDCSI sequence, as previously described (14), except that in-plane resolution was reduced to 2.5mm (field of view = 40mm) to better separate brain signal from surrounding tissue. Slice thickness was set at 10mm for all studies. A 20-sec imaging interval was initiated 20–45 sec after the start of injection.
Standard Reference
A reference phantom was constructed using 8-M 13C-urea in 80:20 wieght-to-wieght water:glycerol and 3 μL/mL gadolinium-chelate (OmniScan; GE Healthcare Oslo), with a T1 of 1 sec. Signal intensity at 3 T is 2.1 mM%, where mM% is concentration × polarization. This expression of intensity (8 M × %polarization at 13C thermal equilibrium in the standard reference at 3 T = 2.1 mM%) is a convenient number to visually compare metabolic levels in hyperpolarized images, assuming an estimate of residual %polarization in the hyperpolarized images. An 800 μL sample in a sealed 1-mL plastic syringe barrel or a 2.5-mL sample in a sealed 3-mL plastic syringe barrel was inserted in the coil field of view alongside the head.
Data Analysis
SAGE (GE Healthcare) was used for data analysis. The spectral domain was apodized with a 16-Hz gaussian filter. Metabolite maps were Fourier interpolated in-plane from 16 × 16 to 32 × 32. Magnitude mode images were taken from a three-point integral over the maximum peak position for each metabolite. For the SNR measurement, noise was measured from the full field of view at a single point in the spectral bandwidth, but outside the metabolite responses. The urea signal used in the SNR calculation was taken from a single resonant point spectrally and at the center of the phantom spatially. A three-point integral of the standard 13C urea reference signal was projected across chemical shift to provide a convenient signal reference in all of the metabolite maps.
Spectral grid displays were constructed without any spatial interpolation. For expanded spectral grid displays, spectra were phased, baseline corrected, and displayed in pure absorption mode. In each image, a brain region of interest containing eight or more contiguous voxels, without visible contamination from signals outside the brain, was selected for quantitative analysis.
Dose Escalation Studies
Outside the magnet, two rats were evaluated for heart rate, respiratory rate, and oxygenation changes following an escalation of EP concentration with 25-mM, 50-mM, 75-mM, and 100-mM EP. These solutions were generated from a stock 125-mM EP solution by addition of 100-mM, 75-mM, 50-mM, and 25-mM NaOH, respectively. EP:pyruvate ratios were validated by 1H/13C 9.4-T NMR, and the pH for all solutions was 6.7 ± 1. The injection rate was a nominal 75 nmol g−1 sec−1. A transient reduction in heart and respiratory rate was observed at the two highest concentrations. A rate escalation study was also conducted after the maximum tolerated concentration of 50-mM EP, at the nominal injection rate, caused a transient reduction in heart rate in one of the early studies (H76). Using the 50-mM EP formulation, rate was escalated in two rats from 15 to 50 nmol g(rat)−1 sec−1 to determine a safe injection rate (<26 nmol g(rat)−1 sec−1).
RESULTS
Pyruvate metabolite maps from two [1-13C]-pyruvate injections, along with proton anatomic images, are shown in Fig. 1. The pyruvate images were collected 20 sec (top right) and 36 sec (bottom right) after start of injection. In both cases, pyruvate signal is readily observed in the brain, but at levels lower than intravascular space and similar to that in the surrounding muscle. At a delay of 36 sec, elevated intravascular pyruvate is also observed in the sagittal sinus vein at the top of the image. Figure 2 shows the 36-sec delay image as a full-grid spectroscopic display, along with pyruvate, lactate, and alanine maps. Under these conditions, the highest levels of lactate were detected in brain. Alanine was only detected in the tissue outside brain. In brain, lactate- to-pyruvate ratios are near 1:1.
FIG. 1.
3-T Axial T2W proton reference images are shown in (a,c), and the corresponding color [1-13C] pyruvate images overlaid on grayscale proton anatomic images are shown on the right in (b,d). 8-M 13C-urea insert signal is projected across the chemical shift for quantitative reference. Top: 1.06 μmol g−1 dose; image collected starting 20 sec after start of injection (rat H76). Bottom: 1.01 μmol g−1 dose; image collected starting 36 sec after injection (rat H88).
FIG. 2.
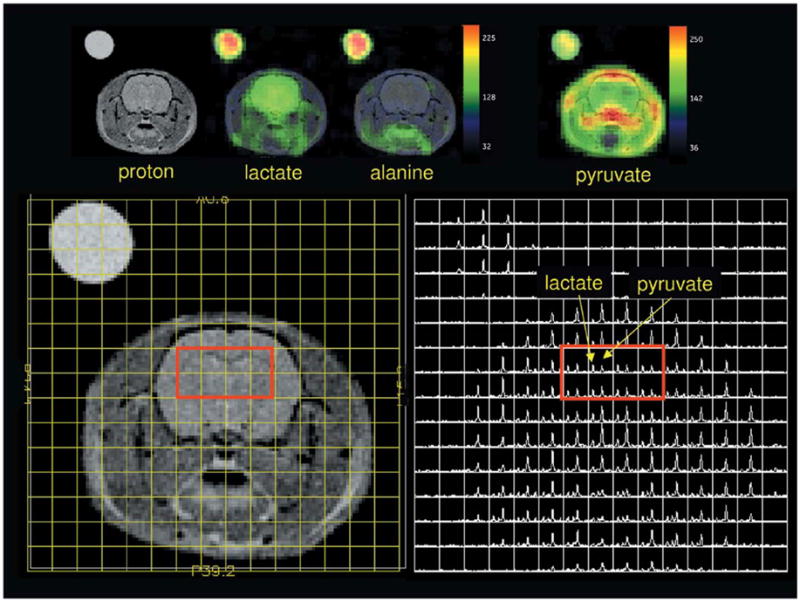
Spectral grid display and image of rat data collected at 36 sec after the start of [1-13C] pyruvate injection (rat H88). Grid is displayed at a sampled resolution of 2.5mm × 2.5mm in plane. Color-overlaid metabolite maps have been Fourier interpolated once in both in-plane dimensions, from 16 × 16 to 32 × 32.
Table 1 provides a summary of dose, injection rate, liquid- state polarization, coil SNR, timing, and estimated concentrations. Pyruvate, lactate, and total carbon estimates were made using the 8-M 13C urea standard (2.1 mM%), an estimate of polarization at dissolution (from solid-state calibration), an effective T1 of 65 sec for the dissolution to injection time, and a 3-T rat blood T1 of 42 sec (15) to estimate intravascular pyruvate polarization loss. The largest error in these estimates is the actual polarization level during the image. Unaccounted losses in polarization will increase the estimates given.
Despite a rat cerebral blood volume (CBV) of only 3.6% (16), the large vascular-to-brain pyruvate ratio predicted by the brain uptake index suggests a significant contribution from the CBV. The maximum pyruvate contribution from the CBV can be estimated, but a corrected value of brain tissue pyruvate is difficult without a concomitant measure of the pyruvate bolus shape and position relative to the imaging window. This can be an issue in any tissue during the passage of a high-concentration bolus but is especially difficult in brain due to the restricted transport through the blood-brain barrier. For the ranges of dose and injection-to-image delay times explored, the observed pyruvate levels ranged from 16 to 628 nmol g−1. Pyruvate images collected 20 sec from the start of injection are likely to overlap with the passage of the bolus through the CBV and are necessarily difficult to quantify. Compared with pyruvate, lactate levels were much less varied over the doses and delay times studied, with a range of 86 to 217 nmol g−1. Assuming a substantial contribution from pyruvate in the CBV, and the relatively large lactate-to-pyruvate levels observed, suggests that brain parenchymal pyruvate could be in limited supply under the conditions used.
Data from an injection of hyperpolarized [1-13C]-EP, and 2 h later hyperpolarized [1-13C]-pyruvate, in the same animal (H76) are illustrated in Fig. 3. In the EP metabolic images, the most intense signals are found dramatically located within the brain. As illustrated in the expanded spectra in Fig. 3b, EP hydrate (175 parts per million (PPM)) is the most pronounced, followed by EP (163 PPM) and lactate (180 PPM). All appear to be uniformly distributed. Pyruvate (172 PPM), which is in the injected solution, as well as a product of the hydrolysis of EP, appears high in the intravascular space outside the brain, much like it is in the pyruvate-only run. Two unidentified peaks, U1 (179 PPM) and U2 (171 PPM) (trityl- catalyzed contaminants), colocate on the image and are part of the injected formulation. Despite the lower dose used in the EP injection, 0.53 μmol g−1 versus 1.06 μmol g−1 for pyruvate, and even without correction for the pyruvate in the CBV, total carbon in the brain is higher in the EP runs. The spectral display of the pyruvate run shows almost no alanine in brain but does indicate the presence of bicarbonate. In the case of EP, alanine signal is obscured by U1 and bicarbonate signal by EP. In the four EP studies, pyruvate levels of 92–119 nmol g−1 and lactate levels of 97–169 nmol g−1 were observed.
FIG. 3.
a: Metabolic images of [1-13C]-EP and [1-13C]-pyruvate are compared at an image delay of 20 sec (rat H76). Metabolite maps for the EP injection are shown across the top, and maps for the pyruvate injection, across the bottom. Phased and baseline- corrected spectral array for a 3 × 3 grid of brain voxels is illustrated in the center, along with the voxel positions on a reference image. Left center shows an annotated spectral grid for the EP injection and right center shows an annotated spectral grid for the pyruvate injection. b: Expanded and annotated brain ROI spectra from the EP run (bottom) and pyruvate run (top). [Color figure can be viewed in the online issue, which is available at www.interscience.wiley.com.]
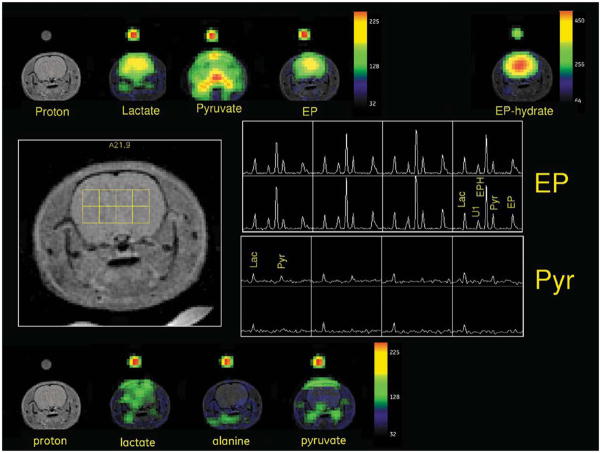
Since the pyruvate blood-brain barrier transport is rate limited (9), an even longer injection-to-image delay was investigated for pyruvate. A comparison of metabolic response from [1-13C]-pyruvate at an image delay of 45 sec, with a subsequent injection of [1-13C]-EP with an image delay of 25 sec, was made on rats H91 and H92. The results from H91 are illustrated in Fig. 4. In the pyruvate run, the only significant signal within the brain is lactate, albeit with a somewhat limited distribution. As with the other EP studies, EP, EP-hydrate, and lactate are dramatically located within brain. The pyruvate map from the EP injection shows the dominant out-of-brain intensities but also shows higher relative brain content than the pyruvate-only run. This level is likely due to pyruvate hydrolyzed from brain EP or EP-hydrate, but we cannot fully discount the pharmacological effects of the coadministered EP on pyruvate transport.
FIG. 4.
Metabolic images of [1-13C]-pyruvate with a 45-sec image delay and [1-13C]-EP with an image delay of 25 sec are compared (rat H91). Metabolite maps from the EP injection are shown at the top, and maps for the pyruvate injection, along the bottom. A phased and baseline-corrected spectral array for a 4 × 2 grid of brain voxels is illustrated in the center, along with the voxel positions on a reference proton image. The top right center panel shows the EP spectral grid and the bottom right center panel shows the [1-13C]-pyruvate results.
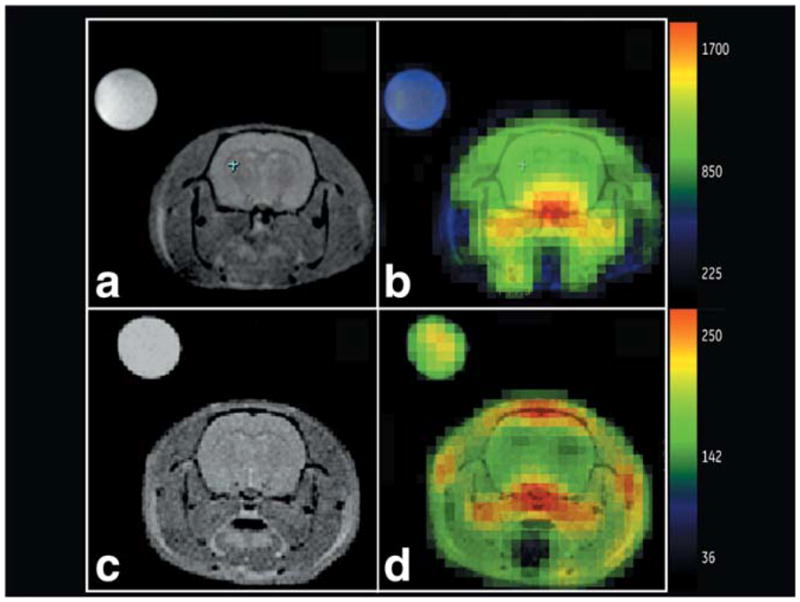
Figure 5 shows a larger view of EP versus pyruvate under the best conditions afforded by the limits of this range-finding study. EP-hydrate versus pyruvate images are shown, along with their corresponding lactate metabolic maps. Pyruvate injected at a high dose, ~1 μmol g−1, with an imaging delay of 20 sec, and EP at a slow injection of 26 nmol g(rat)−1 sec−1 and an imaging delay of 25 sec, both generate good-quality metabolic images. Most of the carbon signal is outside brain in the pyruvate study, while most of the carbon signal is within the brain in the EP study. High intravascular levels, as seen in the large vessels for pyruvate (Fig. 5d) but not EP (Fig. 5b), require a correction for cerebral blood content in the pyruvate case, but not for EP.
FIG. 5.
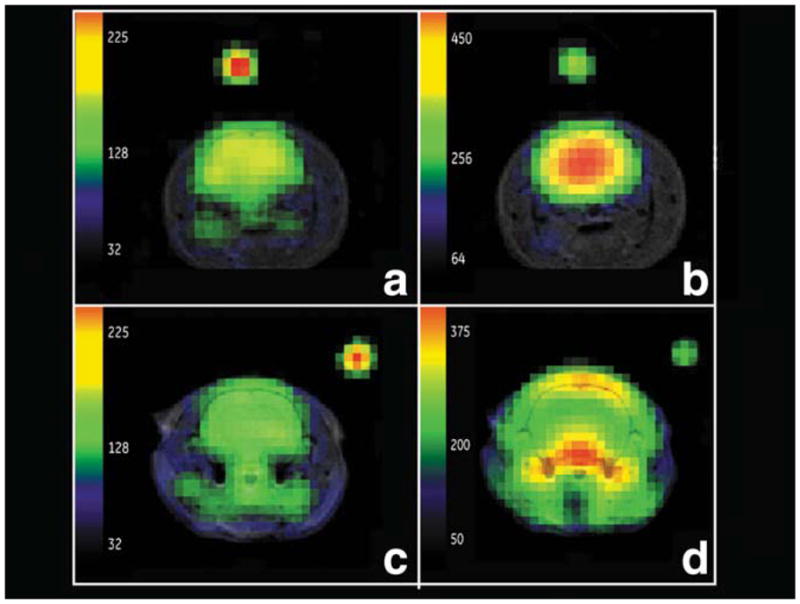
Comparison of EP metabolic maps (rat H91) for lactate (a) and EP-hydrate (b), with pyruvate metabolic maps (rat H111) for lactate (c) and pyruvate (d) under optimum imaging conditions. High dose and image delay of 20 sec for pyruvate, slow injection rate and 25-sec image delay for EP. Excellent brain EP-hydrate and lactate distribution observed in (b) and (a). Characteristic large out-of-brain pyruvate signal level is observed following a pyruvate injection (d).
DISCUSSION
We have successfully polarized [1-13C]-EP and demonstrated rapid and preferential uptake into brain, as well as the resulting metabolic signal from pyruvate and lactate. Each molecule of pyruvate hydrolyzed from EP generates a molecule of ethanol. However, for the doses of EP used in this study, this dose of ethanol is relatively small. The delivery of ethanol to brain is equal to the sum of lactate and pyruvate, about 200 nmol g−1 (less than 0.001%), based on the results in Table 1. Ethanol contributions from nonbrain EP hydrolysis are also possible, and the impact on cerebral blood flow cannot be ignored. For the tissue level estimates presented in Table 1, an intravascular T1 of 27 sec was used to estimate the polarization losses during delivery of EP-hydrate. The EP level was corrected for an intravascular T1 of 22 sec. These values were measured in fresh rat blood at 3 T, using a bolus dilution factor of 2. The in vitro T1 for EP and EP-hydrate is 45 sec. With residual polarization corresponding to these T1 losses, the total carbon delivered to brain was significantly higher for EP as compared to pyruvate, despite the use of a lower dose. However, the average lactate level for the EP injections, at 130 nmol g−1, was comparable to that observed in the pyruvate injections. It may be that lactate labeling is already near Vmax and that the availability of parenchymal pyruvate is restricted to a similar level in EP and pyruvate injections. The high level of EP in brain suggests a rate-limited esterase activity, negating some of the advantage of rapid EP transport into brain. Brain pyruvate levels in both the EP and pyruvate studies may have a substantial intravascular contribution. The most striking observation in this study is the preferential uptake of the lipophilic EP and EP-hydrate, presumably due to the high lipid content of brain. This is an advantage compared with pyruvate metabolic imaging of brain, where the large vascular concentration of pyruvate can be confounding, both from contributions within a voxel and partial-volume imaging effects from the large out-of-brain vessels. For studies of hyperpolarized [1-13C]-pyruvate in brain, dynamic imaging may be required to accurately separate pyruvate signal from the brain parenchyma and the CBV.
High doses of hyperpolarized [1-13C]-pyruvate may also be a viable agent for brain imaging, even in diseases that do not substantially impact the blood-brain barrier; for example, infiltrating gliomas, Alzheimer’s disease, nonenhancing multiple sclerosis, and acute stroke. In these cases, correction for cerebral blood content will be required. It is interesting to note that although the peak out-of-brain intravascular pyruvate levels are substantially larger than brain levels (2×–4×), they do not reach the levels of 5×–10× predicted by brain uptake index and are thus substantially partial-volume reduced. This is not surprising, given the typical diameter of rat arteries and the sampled voxel size. Based on the published saturable and nonsaturable rate constants for pyruvate (7,9), the brain tissue levels observed are consistent with a first-pass 12-sec bolus of pyruvate at an estimated concentration of 30–40 mM, not unreasonable for a 80- to 100-mM initial dose condition. Under these conditions, most of the transport appears to be via the nonsaturable route. Saturable transport, as predicted by the maximum velocity (Vmax) reported in (7), would be less than 35 nmol g−1 of pyruvate. This is significantly less than the total labeled carbon transport observed in this study (114–762 nmol g−1). Elevated blood lactate may also become a concern for the pyruvate studies with longer image delays. Lactate transport kinetics through the blood-brain barrier are not very different from pyruvate (9,17,18). Loss of labeled lactate from brain to the vascular volume is expected to be small for these imaging delay times, even for the highest transport rates reported (18).
A final concern relative to the pyruvate injection in H76 is that it followed EP injection in the same animal. This was the only pyruvate run preceded by an EP injection. The brain pyruvate level in this animal was higher than in other runs with identical injection to image delays. Although this result may be consistent with the higher dose, residual pharmacological effects of the EP cannot be completely discounted.
From these results, it seems possible that neurodegenerative diseases may be studied using hyperpolarized pyruvate and/or hyperpolarized EP. For EP, trityl-catalyzed contaminants, as well as safety of the rapidly injected solution, continue to be issues. High-resolution NMR studies of U1 and U2 suggest dimer formation, potentially ethyl-parapyruvate. Despite these limitations, EP may prove to be a good tool in neurologic studies at least in animal models. The unique anti-inflammatory properties of EP (10) may also provide additional specificity in diseased tissues. This study also validates the general strategy of using esters for rapid and efficient delivery of agents across the blood-brain barrier.
Acknowledgments
Grant sponsor: NIH; Grant numbers: EB009070, P41RR09784, AA005965, AA013521-INIA.
References
- 1.Golman K, in’t Zandt R, Lerche M, Pehrson R, Ardenkjaer-Larsen JH. Metabolic imaging by hyperpolarized 13C magnetic resonance imaging for in vivo tumor diagnosis. Cancer Res. 2006;66:10855–10860. doi: 10.1158/0008-5472.CAN-06-2564. [DOI] [PubMed] [Google Scholar]
- 2.Golman K, Petersson JS, Magnusson P, Johansson E, Akeson P, Chai CM, Hansson G, Månsson S. Cardiac metabolism measured noninvasively by hyperpolarized 13C MRI. Magn Reson Med. 2008;59:1005–1013. doi: 10.1002/mrm.21460. [DOI] [PubMed] [Google Scholar]
- 3.Albers MJ, Bok R, Chen AP, Cunningham CH, Zierhut ML, Zhang VY, Kohler SJ, Tropp J, Hurd RE, Yen YF, Nelson SJ, Vigneron DB, Kurhanewicz J. Hyperpolarized 13C lactate, pyruvate, and alanine: noninvasive biomarkers for prostate cancer detection and grading. Cancer Res. 2008;68:8607–8615. doi: 10.1158/0008-5472.CAN-08-0749. [DOI] [PMC free article] [PubMed] [Google Scholar]
- 4.Chen AP, Albers MJ, Cunningham CH, Kohler SJ, Yen YF, Hurd RE, Tropp J, Bok R, Pauly JM, Nelson SJ, Kurhanewicz J, Vigneron DB. Hyperpolarized C-13 spectroscopic imaging of the TRAMP mouse at 3T: initial experience. Magn Reson Med. 2007;58:1099–1106. doi: 10.1002/mrm.21256. [DOI] [PubMed] [Google Scholar]
- 5.Day SE, Kettunen MI, Gallagher FA, Hu D-E, Lerche M, Wolber J, Golman K, Ardenkjaer-Larsen JH, Brindle KM. Detecting tumor response to treatment using hyperpolarized 13C magnetic resonance imaging and spectroscopy. Nat Med. 2007;13:1382–1387. doi: 10.1038/nm1650. [DOI] [PubMed] [Google Scholar]
- 6.Chen AP, Bok R, Zhang V, Xu D, Veeraraghavan S, Hurd RE, Nelson SJ, Kurhanewicz J, Vigneron DB. Serial hyperpolarized 13C 3D-MRSI following therapy in a mouse model of prostate cancer. Proceedings of the 16th Annual Meeting of ISMRM; Toronto, Canada. 2008. p. 888. [Google Scholar]
- 7.Cremer JE, Cunningham VJ, Pardridge WM, Braun LD, Oldendorf WH. Kinetics of blood-brain barrier transport of pyruvate, lactate and glucose in sucking, weanling and adult rats. J Neurochem. 1979;33:439–445. doi: 10.1111/j.1471-4159.1979.tb05173.x. [DOI] [PubMed] [Google Scholar]
- 8.Miller LP, Oldendorf WH. Regional kinetic constants for blood-brain barrier pyruvic acid transport in conscious rats by the monocarboxylic acid carrier. J Neurochem. 1986;46:1412–1416. doi: 10.1111/j.1471-4159.1986.tb01756.x. [DOI] [PubMed] [Google Scholar]
- 9.Pardridge WM. Brain metabolism: a perspective from the blood-brain barrier. Am Physiol Soc. 1983;63:1481–1527. doi: 10.1152/physrev.1983.63.4.1481. [DOI] [PubMed] [Google Scholar]
- 10.Fink MP. Ethyl pyruvate: a novel anti-inflammatory agent. J Intern Med. 2007;261:349–362. doi: 10.1111/j.1365-2796.2007.01789.x. [DOI] [PubMed] [Google Scholar]
- 11.Cho IH, Kim SW, Kim JB, Kim TK, Lee KW, Han PL, Lee JK. Ethyl pyruvate attenuates kainic acid-induced neuronal cell death in the mouse hippocampus. J Neurosci Res. 2006;15:1505–1511. doi: 10.1002/jnr.21052. [DOI] [PubMed] [Google Scholar]
- 12.Yu YM, Kim JB, Lee KW, Kim SY, Han PL, Lee JK. Inhibition of the cerebral ischemic injury by ethyl pyruvate with a wide therapeutic window. Stroke. 2005;36:2238–2243. doi: 10.1161/01.STR.0000181779.83472.35. [DOI] [PubMed] [Google Scholar]
- 13.Bennett-Guerrero E, Swaminathan M, Grigore AM, Roach GW, Aberle LG, Johnston JM, Fink MP. A phase II multicenter double-blind placebo- controlled study of ethyl pyruvate in high-risk patients undergoing cardiac surgery with cardiopulmonary bypass. J Cardiothorac Vasc Anesth. 2009;23:324–329. doi: 10.1053/j.jvca.2008.08.005. [DOI] [PubMed] [Google Scholar]
- 14.Kohler SJ, Yen Y-F, Wolber J, Chen AP, Albers MJ, Bok R, Zhang V, Tropp J, Nelson SJ, Vigneron DB, Kurhanewicz J, Hurd RE. In vivo 13carbon metabolic imaging at 3T with hyperpolarized 13C-1-pyruvate. Magn Reson Med. 2007;58:65–69. doi: 10.1002/mrm.21253. [DOI] [PubMed] [Google Scholar]
- 15.Leung KK-C, Lam WW, Chen AP, Cunningham CH. Kinetic modeling of hyperpolarized [1-13C] pyruvate metabolism in blood. Proceedings of the 17th AnnualMeeting of ISMRM; Honolulu, Hawaii. 2009. p. 2432. [Google Scholar]
- 16.Julien-Dolbec C, Tropres I, Montigon O, Reutenauer H, Ziegler A, Decorps M, Payen JF. Regional response of cerebral blood volume to graded hypoxic hypoxia in rat brain. Br J Anaesth. 2002;89:287–293. doi: 10.1093/bja/aef182. [DOI] [PubMed] [Google Scholar]
- 17.Leegsma-Vogt G, van der Werf S, Venema K, Korf J. Modeling cerebral arteriovenous lactate kinetics after intravenous lactate infusion in the rat. J Cereb Blood Flow Metab. 2004;24:1071–1080. doi: 10.1097/01.WCB.0000129417.80261.A6. [DOI] [PubMed] [Google Scholar]
- 18.Lear JL, Kasliwal RK. Autoradiographic measurement of cerebral lactate transport rate constants in normal and activated conditions. J Cereb Blood Flow Metab. 1991;11:576–580. doi: 10.1038/jcbfm.1991.106. [DOI] [PubMed] [Google Scholar]


