

Abstract
MicroRNA deregulation is involved in tumor initiation and progression. The aim of this study was to identify and validate the microRNA candidates that contribute to the metastasis of oral tongue squamous cell carcinoma (OTSCC). Using microarrays, a panel of differentially expressed microRNAs was identified in paired OTSCC cell lines with different metastatic potential. Selected microRNA candidates (including hsa-miR-222) were further validated using quantitative PCR approach. Functional analysis indicated that hsa-miR-222 inhibits OTSCC cell invasion. Ectopic transfection of hsa-miR-222 reduced the expression of MMP1 and SOD2 in OTSCC cell lines. Direct targeting of hsa-miR-222 to specific sequences located in the 3′-untranslated regions of both MMP1 and SOD2 mRNAs were confirmed using luciferase reporter gene assays. Furthermore, SOD2 knockdown by siRNA led to the downregulation of MMP1 expression. Taken together, these results suggested that hsa-miR-222 regulates the MMP1 expression through both direct cis-regulatory mechanism (targeting MMP1 mRNA) and indirect trans-regulatory mechanism (indirect controlling of MMP1 gene expression by targeting SOD2). Our results indicate that hsa-miR-222 plays an important role in OTSCC invasion, and may serve as a novel therapeutic target for OTSCC patients at risk of metastatic disease.
Keywords: OTSCC, microRNA, miR-222, SOD2, MMP1, invasion
MicroRNAs (miRNAs) are a class of endogenous small non-coding RNAs that control the target gene expression at both of transcriptional and post-transcriptional levels. It is currently estimated that the human genome may have 800-1,000 miRNAs (1). Although they account for only a minor fraction of the expressed genome, microRNAs are essential regulators of diverse cellular processes including proliferation, differentiation, apoptosis, survival, motility, invasion and morphogenesis. Several microRNAs have been functionally classified as proto-oncogenes or tumor suppressors and are aberrantly expressed in various cancer types including leukemia (2, 3), lymphoma (4), breast cancer (5, 6), colorectal cancer (7), lung cancer (8, 9), and liver cancer (10, 11), and oral cancer (12-15). Deregulation (e.g., overexpression or loss of expression) of these “cancerous” microRNAs contributes to tumor initiation and progression by promoting uncontrolled proliferation, favoring survival, inhibiting differentiation and/or promoting invasive behavior (16, 17).
Oral tongue squamous cell carcinoma (OTSCC) exhibits frequent local/regional invasion and metastasis. Improvement in patient survival requires better understanding of tumor invasion and metastasis so that aggressive tumors can be detected early in the disease process and targeted therapeutic interventions can be developed. Like most of the other human cancers, OTSCC is a disease involving multi-step dynamic changes in the genome. However, most studies on OTSCC have mainly focused on protein-coding genes, and our knowledge on the alterations of the non-coding genes in OTSCC is limited. This study seeks to identify and validate the microRNA candidates that contribute to metastasis in OTSCC.
Materials and Methods
Cell culture and transfection
The UM1 and UM2 cells used in this study are paired cell lines with different metastatic potential that were generated from a single patient with OTSCC (18). These cell lines were maintained in DMEM/F12 supplemented with 10% FBS, 100 U/mL penicillin and 100 μg/mL streptomycin (GIBCO) at 37°C in a humidified incubator containing 5% CO2. For functional analysis, hsa-miR-222 mimics and non-targeting miRNA mimics (negative control) from Dharmacon were transfected into cells using DharmaFECT Transfection Reagent 1 according to the manufacturer's instructions. In brief, cells were plated in 6 cm diameter cell culture dishes to 60% confluence. For each dish, 7.5 μl of hsa-miR-222 mimic (20 μM) and 6 μl of DharmaFECT Transfection Reagent were added into 1.5 ml of antibiotic-free opti-MEM medium (Invitrogen), separately, and then mixed together for forming the transfection complex. The transfection complex (100 nM) was added to cells and incubated for 24 h before replacing the medium.
MicroRNA microarray
Total RNA from OSCC cell lines was isolated using a miRNeasy Mini Kit from Qiagen. The quality and quantity of the RNA samples were assessed by standard electrophoresis and spectrophotometer methods. Microarray analysis was performed by Genosensor Corporation (Tempe, AZ, USA) based on the GenoExplorer microRNA Full Kit protocol. The GenoExplorer human miRNA array contains triplicated probesets representing approximately 900 microRNA, including both precursor microRNA and mature microRNA. Duplicated array assays were performed for each sample. Detectable probes were defined as probe signal intensity equal or above the signal threshold (array background + 2 × background standard deviation). Arrays were normalized based on global signal intensity. Differential miRNA expression was determined using a two-sided t-test on a single miRNA basis.
Real-time RT-PCR analysis
The relative expression level of miRs in UM1 and UM2 cell lines was determined based on a quantitative 2-step RT-PCR assay using mirVana™ qRT-PCR microRNA Detection Kit as per the manufacturer's protocol (Ambion). The quantitative PCR was performed using iQ SYBR Green Supermix (Bio-Rad) in a BIO-RAD iCycler iQ real-time PCR detection system. Specific primer sets for hsa-miR-138, hsa-miR-155, hsa-miR-205, hsa-miR-221, hsa-miR-222 and U6 were obtained from Ambion. The relative expression level of miRs was determined using the 2–delta delta Ct analysis method (19), where U6 was used as an internal reference.
Targeting gene prediction for hsa-miR-222
We performed a search for the hsa-miR-222 targeted genes based on 2 existing candidate lists: i. a list of differentially expressed proteins in OSCC cell lines with different metastatic potential (including UM1 and UM2) based on our previous proteomic study (20); and ii. a list of differentially expressed mRNAs in OTSCC based on our previous genomic study (21). A total of 75 genes were included in this search. The 3′ untranslated regions (3′-UTR) of these genes were retrieved from GenBank. Potential targeting sites for hsa-miR-222 were identified based on sequence complementary to hsa-miR-222. Since we were assessing the RNA-RNA interaction, G:U was also considered as complementary pairing. The predicted targeting sequences were also confirmed using TargetScanHuman 5.1 (http://www.targetscan.org/).
Flow cytometry-based apoptosis and cell cycle analysis
Cells were grown in 6-well plates to about 60% confluence and transiently transfected with the desired miRNAs at a final concentration of 100 nM. The cells were digested and collected after 48 h post-transfection, and washed with PBS twice. For cell apoptosis measurement, the cells were resuspended in 1× Binding Buffer, and 5 μl of Annexin FITC Conjugate, and 10 μl of propidium iodide solution were added to each cell suspension, separately. For cell cycle analysis, the cells were resuspended in PBS and then fixed in ethanol at −20°C overnight. The cells were washed with PBS and resuspended in Staining Solution (50 μg/mL of propidium iodide, 1 mg/mL of RNase A, 0.1% Triton X-100 in PBS). The stained cells (1×10⁵) were then analyzed with a flow cytometer (FACScalibur, Becton-Dickinson).
In vitro cell invasion assay
The invasion assay was performed using a Cultrex 96-well membrane invasion assay kit (R&D Systems) as described previously (20). Briefly, in day 1, 50 μl of 0.5 × BME coating solution was placed in each well of a top invasion chamber, and the cells were starved in serum-free medium. On day 2, the cells were harvested and seeded into the top chamber at 5×10⁴ cells/well. 100 μl of serum-free medium were added to each well of the bottom invasion chamber. The device was assembled and incubated at 37°C in an incubator containing 5% CO2 for 24 h. On day 3, the cells in the top chamber were washed with PBS and transfected with desired miRNA reagents (or siRNA reagents) at a final concentration of 100 nM. Correspondingly, the medium in the bottom chamber was replaced with fresh DMEM/F12 medium containing 10% FBS. Forty-two hours after transfection, medium in both chambers were aspirated and each well was washed with 1× Washing Buffer. 150 μl of Cell Dissociation Solution/Calcein AM was added to the bottom chamber and incubated at 37°C for 1 hour. Experiments were performed at least twice, separately, and run in quadruplicate. The top chamber was removed, and the bottom plate was measured at 485 nm excitation and 520 nm emission. The data was compared to the standard curve to determine the number of cells that have invaded. A separate standard curve was used for each cell type. The percentage of cell invasion was calculated as the number of the invaded cells divided by the number of the cells at the start of the assay.
Western blotting analysis
After washing with cold PBS 3 times, cells were lysed in RIPA buffer of 150 mM NaCl, 10 mM Tris-HCl, pH 7.4, 0.5% Triton X-100, and protease inhibitors (Sigma), homogenized on ice, and centrifuged at 15,000 rpm at 4°C for 15 min. The supernatant was collected and stored at −80°C until use. Protein concentration was determined using the Bradford assay (Bio-Rad). Twenty-five μg of protein extraction was loaded on 12% tris-polyacrylamide gels (SDS–PAGE, Bio-Rad, USA). The proteins were then transferred to nitrocellulose membrane (Whatman, Germany). The membranes were blocked in 5% non-fat dry milk, washed in TBS with 0.05% Tween 20 (TBST), and incubated with rabbit anti-p27 (Cell Signaling Technology), mouse anti-SOD2 (ABCam), or mouse anti-MMP1 (R&D Systems) in room temperature for 1 hr or overnight at 4°C. Mouse anti-beta-actin (Sigma) was used for internal control. The membranes were washed three times in PBST and incubated for 1 hour with appropriate secondary antibodies conjugated to horseradish peroxidase, washed three times in PBST, and treated with Immun-Star HRP peroxide buffer and Luminol/Enhancer (Bio-Rad) for chemiluminescence detection of protein bands.
Dual luciferase reporter assay
The 3′ untranslated region of SOD2 and MMP1 mRNA containing the miRNA-222 binding sites were amplified using PCR [primers for SOD2, 5′-ctgatctagacca cgatcgttatgctgagt-3′ (forward) and 5′-tctgtctagaccagttcagttcacctgcta-3′ (reverse), and primers for MMP1 5′-tctgtctagaatgtagcctttt-3′ (forward) and 5′-tcgatctagacgcggctacattctaaat-3′ (reverse)] and cloned into the Xba I site of the pGL3 (Promega), separately. The constructs were then verified by sequencing. For the luciferase reporter assays, the cells were grown in 10% FBS in DMEM to ∼70% confluence in 12-well plates. Cells were transfected with 500 ng of firefly luciferase reporter vector containing the SOD2 3′-UTR (named pGL3-SOD2 3′-UTR) or MMP1 3′-UTR (named pGL3-MMP1 3′-UTR), using lipofectamine 2000 (Invitrogen). The pRL-TK vector (Promega) was co-transfected as internal control for normalization of the transfection efficiency. After 48 hours, transfected cells were harvested with ice-cold phosphate-buffered saline, and dual luciferase assay were performed according to the manufacturer's protocol (Promega) using a Lumat LB 9507 Luminometer (Berthold Technologies).
Statistical analysis
Statistical analysis was done with Student's t-test. Differences with p<0.05 were considered statistically significant.
Results
The UM1 and UM2 are paired cell lines from a single OTSCC patient (18). These cell lines exhibit different metastatic potential, where UM1 is more aggressive than UM2 in term of cell invasion (20). Microarray analysis was performed to identify the differentially expressed microRNA in UM1 and UM2 cells. As shown in Table I, 23 miRNAs were down-regulated, and 22 miRNAs were up-regulated in UM1 when compared to its corresponding counterpart (UM2). Real-time quantitative RT-PCR assays were performed to validate the selected miRNA candidates (Figure 1), including down-regulation of hsa-miR-138, hsa-miR-155, hsa-miR-221, hsa-miR-222 and up-regulation of hsa-miR-205 in cell line with more aggressive phenotype (UM1).
Table I. Differentially expressed microRNA in UM1 and UM2 cells*.
| microRNA | fold (UM1/UM2) | microRNA | fold (UM1/UM2) |
|---|---|---|---|
| hsa-miR-7 | 0.26 | hsa-miR-18b | 3.28 |
| hsa-miR-30a 5p | 0.47 | hsa-miR-19a | 3.42 |
| hsa-miR-30e 3p | 0.32 | hsa-miR-20b | 2.45 |
| hsa-miR-34b | 0.27 | hsa-miR-31 | 2.88 |
| hsa-miR-34c | 0.29 | hsa-miR-106a | 2.77 |
| hsa-miR-96 | 0.37 | hsa-miR-148b | 2.42 |
| hsa-miR-99a | 0.23 | hsa-miR-197 | 2.81 |
| hsa-miR-99b | 0.36 | hsa-miR-203 | ∞ *** |
| hsa-miR-100 | 0.25 | hsa-miR-205 | 2.81 |
| hsa-miR-125a | 0.26 | hsa-miR-342 | 3.02 |
| hsa-miR-125b | 0.32 | hsa-miR-370 | 3.03 |
| hsa-miR-130a | 0.37 | hsa-miR-532 | 2.23 |
| hsa-miR-130b | 0.41 | hsa-miR-560-pre | 3.26 |
| hsa-miR-138 | 0.40 | hsa-miR-564 | 2.40 |
| hsa-miR-155 | 0 ** | hsa-miR-564-pre | 4.77 |
| hsa-miR-181c | 0.39 | hsa-miR-566 | 4.35 |
| hsa-miR-181d | 0.33 | hsa-miR-574-pre | 6.49 |
| hsa-miR-221 | 0.27 | hsa-miR-595 | 3.83 |
| hsa-miR-222 | 0.26 | hsa-miR-619-pre | 5.89 |
| hsa-miR-224 | 0.27 | hsa-miR-638 | 3.25 |
| hsa-miR-503 | 0.27 | hsa-miR-638-pre | 2.04 |
| hsa-miR-565-pre | 0.42 | hsa-miR-662-pre | 3.58 |
| hsa-miR-594-pre | 0.39 |
p<0.01;
hsa-miR-155 was not detected in UM1;
hsa-miR-203 was not detected in UM2.
Figure 1.
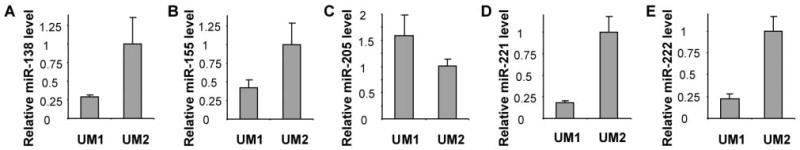
Validating the differential expression of microRNAs in UM1/UM2 cell lines. The qRT-PCR was performed as described in the Materials and Methods section to assess the hsa-miR-138, hsa-miR155, hsa-miR-205, hsa-miR-221 and hsa-miR-222 in UM1 and UM2 cell lines. Statistically significant differences in expression levels of all the tested microRNAs were observed for the paired UM1/UM2 cell lines (p<0.05).
To evaluate the involvement of hsa-miR-222 dysregulation in OTSCC tumorigenesis and metastasis, functional analyses were performed to test the effects of hsa-miR-222 on cell invasion, apoptosis, and cell cycle. As shown in Figure 2A, decrease in apoptosis was observed in UM1 cells transfected with the hsa-miR-222 mimic. However, the change was not statistically significant (p=0.08). No apparent difference in cell cycle was observed in UM1 cells transfected with hsa-miR-222 mimics (Figure 2B). As shown in Figure 2C, ectopic transfection of hsa-miR-222 mimics led to a significant decrease in cell invasion when compared to cells tranfected with the negative control (p<0.05). Apparent decrease in migration was also observed in cells transfected with hsa-miR-222, but the difference was not statistically significant (data not shown). Reduced expression of p27 was observed in cells transfected with the hsa-miR-222 mimic (Figure 2D), which is in agreement with previous observations (22, 23).
Figure 2.
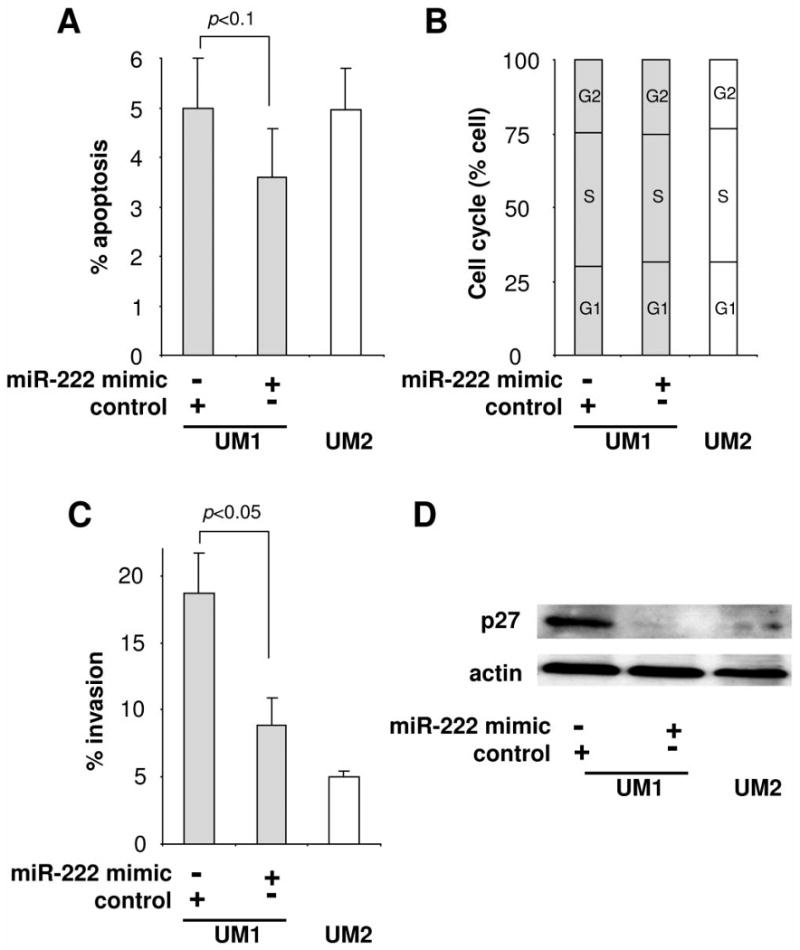
The effects of miR-222 on apoptosis, cell cycle, invasion and p27 expression in OTSCC cells. UM1 cells were transfected with hsa-miR-222 mimic and negative control microRNA mimic. Untreated UM2 cells were used as a control. Apoptosis (A), cell cycle (B), cell invasion (C) and p27 protein levels (D) were measured in these cells as described in the Material and Methods section. Data represents at least 3 independent triplicated experiments with similar results.
We performed a search for the hsa-miR-222 targeted sites in the 3′-UTRs of candidate genes from 2 existing candidate lists: 1) a list of differentially expressed proteins in OSCC cell lines with different metastatic potential (including UM1 and UM2) based on our previous proteomic study (20), and 2) a list of differentially expressed mRNAs in OTSCC based on our previous genomic study (21). A targeting site for hsa-miR-222 was identified in the 3′-UTR of the MMP1 mRNA (Figure 3A). To confirm that hsa-miR-222 directly targets this sequence located in MMP1 mRNA, luciferase reporter assay was performed using a construct in which this targeting site were cloned into the 3′-UTR of the reporter gene (pGL3-MMP1 3′-UTR). As illustrated in Figure 3B, when cells were transfected with hsa-miR-222, the luciferase activity was significantly diminished when compared to the cells transfected with negative control. Furthermore, ectopic transfection of hsa-miR-222 reduced the protein level of MMP1 in UM1 cells as shown by western blots (Figure 3C). To confirm that the reduction of MMP1 has a functional relevance to UM1 cell invasion, we knocked-down MMP1 using specific siRNA (Figure 3D), and demonstrated that the reduced MMP1 level is associated with reduced cell invasion (Figure 3E). Thus, these results suggest that hsa-miR-222 regulates OTSCC invasion by targeting MMP1 mRNA.
Figure 3.
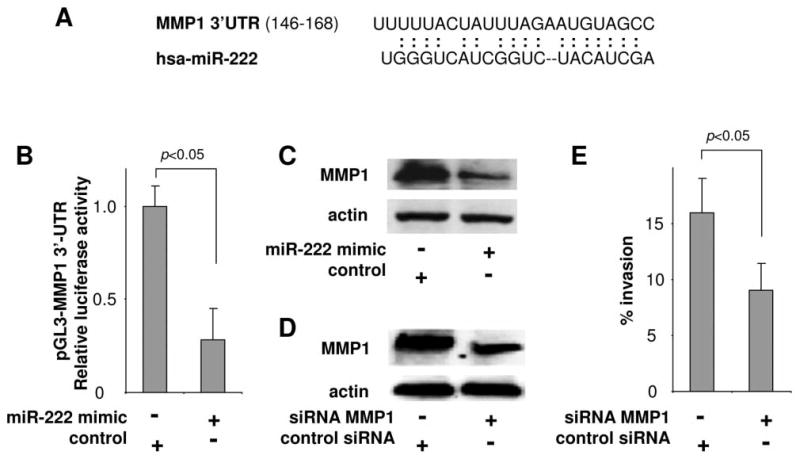
miR-222 targeting MMP1. A) The predicted hsa-miR-222 targeting sequence in MMP1 3′-untranslated region (3′-UTR). B) Duel luciferase reporter assay was performed as described in the Material and Methods section using constructs containing the predicted targeting sequence cloned into the 3′-UTR of the reporter gene (pGL3-MMP1 3′-UTR). Statistically significant differences in luciferase activities were observed when cells were transfected with hsa-miR-222 mimic and negative control microRNA (p<0.05). C) The MMP1 protein level was reduced when UM1 cells were transfected with hsa-miR-222 mimic as measured by western blots. D) Western blot analysis confirming the effective knockdown of MMP1 expression by specific siRNA in UM1 cells. E) Cell invasion was measured in UM1 cells treated with MMP1 specific siRNA and control siRNA. Statistically significant difference in cell invasion was observed (p<0.05). Data represents at least 3 independent triplicated experiments with similar results.
Interestingly, we also identified SOD2 as another direct hsa-miR-222 target gene, and a potential targeting site was identified in the 3′-UTR of the SOD2 mRNA (Figure 4A). To confirm the direct interaction of hsa-miR-222 and this targeting site, luciferase reporter assay was performed using construct containing this targeting site at the 3′-UTR of the reporter gene (pGL3-SOD2 3′-UTR). As illustrated in Figure 4B, when cells were transfected with hsa-miR-222 mimic, the luciferase activity was significantly diminished when comparing to the cells transfected with negative control. Furthermore, ectopic transfection of hsa-miR-222 reduced the expression of SOD2 in UM1 cells as shown by western blots (Figure 4C). To confirm that the reduced SOD2 has a functional relevance to UM1 cell invasion, we performed the knockdown of SOD2 using a siRNA approach (Figure 4D), and demonstrated that the reduced SOD2 level is associated with reduced cell invasion (Figure 4E). Interestingly, knockdown of SOD2 also led to reduction in MMP1 level (Figure 4D). This is in agreement with previous observations that SOD2-dependent production of H2O2 regulates expression of MMP family members (including MMP1) and contributes to cancer cell metastasis (24-26). Take together, these results suggest that hsa-miR-222 regulates UM1 cell invasion, at least in part, by indirectly regulating MMP1 expression through targeting SOD2 mRNA.
Figure 4.
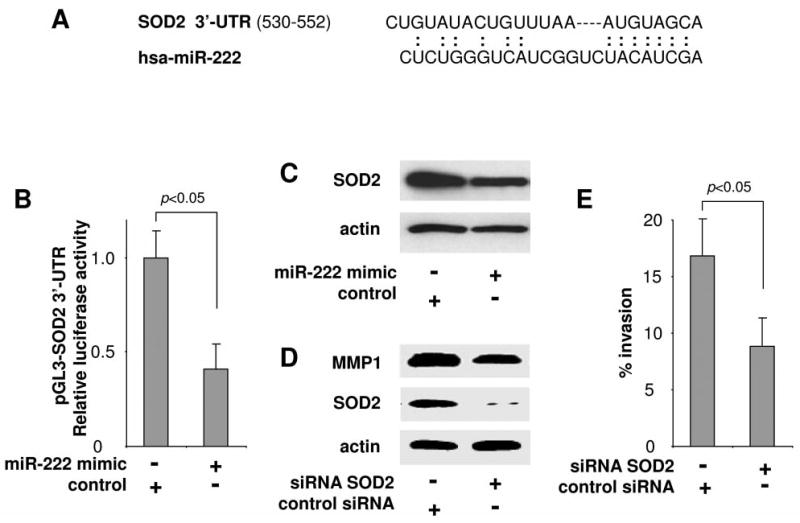
miR-222 targeting SOD2. A) The predicted hsa-miR-222 targeting sequence in SOD2 3′-untranslated region (3′-UTR). B) Duel luciferase reporter assay was performed as described in the Material and Methods section using constructs containing the predicted targeting sequence cloned into the 3′-UTR of the reporter gene (pGL3-SOD2 3′-UTR). Statistically significant differences in luciferase activities were observed when cells were transfected with hsa-miR-222 mimic and negative control microRNA (p<0.05). C) The SOD2 protein level was reduced when UM1 cells were transfected with hsa-miR-222 mimic as measured by western blots. D) Western blot analysis confirming the effective knockdown of SOD2 expression by specific siRNA in UM1 cells. The SOD2 knockdown also reduced the expression level of MMP1. E) Cell invasion was measured in UM1 cells treated with SOD2 specific siRNA and control siRNA. Statistically significant difference in cell invasion was observed (p<0.05). Data represents at least 3 independent triplicated experiments with similar results.
Discussion and Conclusion
An essential characteristic of cancer is the ability to invade surrounding tissues and metastasize to regional and distant sites. In this study, we identified a set of differentially expressed miRNAs from paired OTSCC cell lines with different metastatic potential, including hsa-miR-222. This microRNA has been previously suggested to play a role in tumorigenesis by targeting cell cycle inhibitor p27, which leads to the deregulation of cell cycle control in several cancer types (22, 23). Our results showed that hsa-miR-222 regulates the expression of p27 in OTSCC. However, this effect on p27 does not lead to statistical significant changes in cell cycle in our study. This apparent contradiction may be due to the potential defect(s) in the signaling pathways downstream of p27 in the cell lines we examined. Further study will be needed to fully explore this phenomenon. Nevertheless, the observed changes in cell invasion induced by hsa-miR-222 suggested that these cell lines can provide us with a useful model system to study the hsa-miR-222 effect(s) on metastasis and cell invasion in OTSCC.
It has been demonstrated that microRNA direct-target the mRNA and regulate the expression of the target gene at post-transcriptional levels (e.g., enhance mRNA degradation and inhibit translation). This cis-regulation occurs by direct interaction of the ∼21 nucleotide mature microRNA to an imperfectly matched sequence in the target mRNA. The identification of targeted genes for specific microRNA is an essential step to evaluate the functional role(s) of the microRNA. However, one single microRNA can potentially regulate hundreds of protein-coding genes. The potential mechanisms of microRNA-mediated genes may contribute to various biological functions and may also present multifactorial interaction(s) and encompass different biological pathways. As an effort to ensure our target gene searching is relevant to OTSCC and metastasis, we restricted our search to candidate genes from our previous genomic and proteomic studies (20, 21). Our search yielded 2 promising candidate targets for hsa-miR-222, MMP1 and SOD2. Both have been shown to differentially express in OTSCC and functionally implicated in cell invasion and metastasis. Based on our functional studies, we are confident that these 2 genes are functional targets for hsa-miR-222, and play important role(s) in hsa-miR-222-mediated cell invasion and metastasis.
In addition to direct targeting specific sequences in mRNA (cis-regulation), microRNA may affect the expression of additional genes through indirect regulatory mechanisms (27). Following the expression changes of specific microRNA-targeted genes (e.g., genes coded for transcription factors, and genes coded for RNA regulating proteins), subsequent effects may alter the levels of other mRNAs (or protein interaction), and thus microRNA may exert its effects on the expressed genome through trans-regulatory mechanism(s). One of our interesting observations is that hsa-miR-222 regulates the MMP1 level through both cis- and trans-regulatory mechanisms (Figure 5). While the direct targeting of MMP1 mRNA effectively reduced the MMP1 expression, the indirect pathway to regulate MMP1 by regulating SOD2 is very intriguing. Several studies have shown that the SOD2-dependent production of H2O2 leads to increased expression of MMP family members (including MMP1 and MMP9) and that there is a strong correlation between this increase in MMP levels and enhanced metastasis (24-26). Thus, SOD2-dependent up-regulation of MMPs may, at least in part, contribute to increased invasion and metastatic capacity of tumors displaying elevated SOD2 levels. Furthermore, a single nucleotide polymorphism (SNP) that creates an Ets site at the promoter region of the MMP1 gene has been shown to be responsible for the SOD2 dependent MMP1 expression (25). This SNP has been shown to be associated with OSCC susceptibility and aggressiveness in multiple studies (28-31). Thus, our results, together with early studies, illustrated an interesting regulatory network for the hsa-miR-222 mediated reduction of MMP1 level and inhibition of cell invasion and metastasis in OTSCC.
Figure 5.
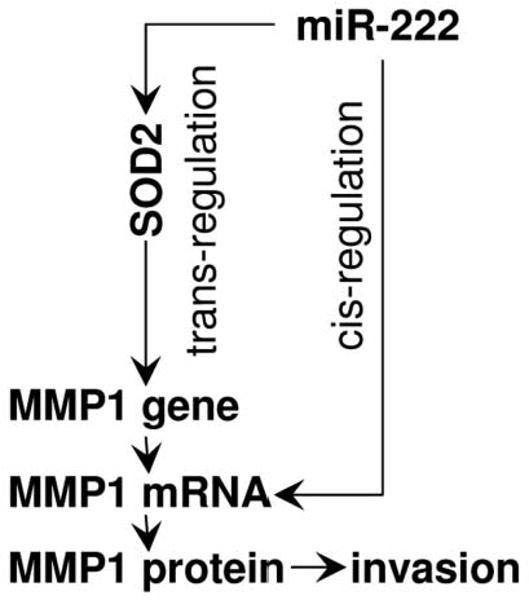
Potential mechanisms utilized by miR-222 to regulate MMP1 expression and cell invasion.
In summary, our study identified a list of differentially expressed microRNAs that may contribute to the differential metastatic potential in OTSCC. Among those microRNAs, hsa-miR-222 has been demonstrated to regulate MMP1 expression and cell invasion through both cis- and trans-regulatory mechanisms. Further studies will be needed to fully understand the functional role(s) of hsa-miR-222 in OTSCC.
Acknowledgments
This work was supported in part by NIH PHS grants K22DE014847, R01CA139596, R03CA135992 and a grant from Prevent Cancer Foundation. X. Liu was supported in part by a grant from National Natural Science Foundation (30700952). We thank Ms. Katherine Long for her editorial assistance.
References
- 1.Bentwich I, Avniel A, Karov Y, Aharonov R, Gilad S, Barad O, Barzilai A, Einat P, Einav U, Meiri E, et al. Identification of hundreds of conserved and nonconserved human microRNAs. Nat Genet. 2005;37(7):766–770. doi: 10.1038/ng1590. [DOI] [PubMed] [Google Scholar]
- 2.Calin GA, Liu CG, Sevignani C, Ferracin M, Felli N, Dumitru CD, Shimizu M, Cimmino A, Zupo S, Dono M, et al. MicroRNA profiling reveals distinct signatures in B cell chronic lymphocytic leukemias. Proc Natl Acad Sci USA. 2004;101(32):11755–11760. doi: 10.1073/pnas.0404432101. [DOI] [PMC free article] [PubMed] [Google Scholar]
- 3.Calin GA, Dumitru CD, Shimizu M, Bichi R, Zupo S, Noch E, Aldler H, Rattan S, Keating M, Rai K, et al. Frequent deletions and down-regulation of micro- RNA genes miR15 and miR16 at 13q14 in chronic lymphocytic leukemia. Proc Natl Acad Sci USA. 2002;99(24):15524–15529. doi: 10.1073/pnas.242606799. [DOI] [PMC free article] [PubMed] [Google Scholar]
- 4.Metzler M, Wilda M, Busch K, Viehmann S, Borkhardt A. High expression of precursor microRNA-155/BIC RNA in children with Burkitt lymphoma. Genes Chromosomes Cancer. 2004;39(2):167–169. doi: 10.1002/gcc.10316. [DOI] [PubMed] [Google Scholar]
- 5.Kondo N, Toyama T, Sugiura H, Fujii Y, Yamashita H. miR-206 Expression is down-regulated in estrogen receptor alpha-positive human breast cancer. Cancer Res. 2008;68(13):5004–5008. doi: 10.1158/0008-5472.CAN-08-0180. [DOI] [PubMed] [Google Scholar]
- 6.Bhaumik D, Scott GK, Schokrpur S, Patil CK, Campisi J, Benz CC. Expression of microRNA-146 suppresses NF-kappaB activity with reduction of metastatic potential in breast cancer cells. Oncogene. 2008 doi: 10.1038/onc.2008.171. [DOI] [PMC free article] [PubMed] [Google Scholar]
- 7.Michael MZ, SM OC, van Holst Pellekaan NG, Young GP, James RJ. Reduced accumulation of specific microRNAs in colorectal neoplasia. Mol Cancer Res. 2003;1(12):882–891. [PubMed] [Google Scholar]
- 8.Takamizawa J, Konishi H, Yanagisawa K, Tomida S, Osada H, Endoh H, Harano T, Yatabe Y, Nagino M, Nimura Y, et al. Reduced expression of the let-7 microRNAs in human lung cancers in association with shortened postoperative survival. Cancer Res. 2004;64(11):3753–3756. doi: 10.1158/0008-5472.CAN-04-0637. [DOI] [PubMed] [Google Scholar]
- 9.Yanaihara N, Caplen N, Bowman E, Seike M, Kumamoto K, Yi M, Stephens RM, Okamoto A, Yokota J, Tanaka T, et al. Unique microRNA molecular profiles in lung cancer diagnosis and prognosis. Cancer Cell. 2006;9(3):189–198. doi: 10.1016/j.ccr.2006.01.025. [DOI] [PubMed] [Google Scholar]
- 10.Murakami Y, Yasuda T, Saigo K, Urashima T, Toyoda H, Okanoue T, Shimotohno K. Comprehensive analysis of microRNA expression patterns in hepatocellular carcinoma and non-tumorous tissues. Oncogene. 2006;25(17):2537–2545. doi: 10.1038/sj.onc.1209283. [DOI] [PubMed] [Google Scholar]
- 11.Wang Y, Lee AT, Ma JZ, Wang J, Ren J, Yang Y, Tantoso E, Li KB, Ooi LL, Tan P, et al. Profiling microRNA expression in hepatocellular carcinoma reveals microRNA-224 up-regulation and apoptosis inhibitor-5 as a microRNA-224-specific target. J Biol Chem. 2008;283(19):13205–13215. doi: 10.1074/jbc.M707629200. [DOI] [PubMed] [Google Scholar]
- 12.Wong TS, Liu XB, Wong BY, Ng RW, Yuen AP, Wei WI. Mature miR-184 as Potential Oncogenic microRNA of Squamous Cell Carcinoma of Tongue. Clin Cancer Res. 2008;14(9):2588–2592. doi: 10.1158/1078-0432.CCR-07-0666. [DOI] [PubMed] [Google Scholar]
- 13.Kozaki K, Imoto I, Mogi S, Omura K, Inazawa J. Exploration of tumor-suppressive microRNAs silenced by DNA hypermethylation in oral cancer. Cancer Res. 2008;68(7):2094–2105. doi: 10.1158/0008-5472.CAN-07-5194. [DOI] [PubMed] [Google Scholar]
- 14.Tran N, McLean T, Zhang X, Zhao CJ, Thomson JM, O'Brien C, Rose B. MicroRNA expression profiles in head and neck cancer cell lines. Biochem Biophys Res Commun. 2007;358(1):12–17. doi: 10.1016/j.bbrc.2007.03.201. [DOI] [PubMed] [Google Scholar]
- 15.Hebert C, Norris K, Scheper MA, Nikitakis N, Sauk JJ. High mobility group A2 is a target for miRNA-98 in head and neck squamous cell carcinoma. Mol Cancer. 2007;6:5. doi: 10.1186/1476-4598-6-5. [DOI] [PMC free article] [PubMed] [Google Scholar]
- 16.Esquela-Kerscher A, Slack FJ. Oncomirs - microRNAs with a role in cancer. Nat Rev Cancer. 2006;6(4):259–269. doi: 10.1038/nrc1840. [DOI] [PubMed] [Google Scholar]
- 17.Calin GA, Croce CM. MicroRNA signatures in human cancers. Nat Rev Cancer. 2006;6(11):857–866. doi: 10.1038/nrc1997. [DOI] [PubMed] [Google Scholar]
- 18.Nakayama S, Sasaki A, Mese H, Alcalde RE, Matsumura T. Establishment of high and low metastasis cell lines derived from a human tongue squamous cell carcinoma. Invasion Metastasis. 1998;18(5-6):219–228. doi: 10.1159/000024515. [DOI] [PubMed] [Google Scholar]
- 19.Livak KJ, Schmittgen TD. Analysis of relative gene expression data using real-time quantitative PCR and the 2(-Delta Delta C(T)) Method. Methods. 2001;25(4):402–408. doi: 10.1006/meth.2001.1262. [DOI] [PubMed] [Google Scholar]
- 20.Ye H, Wang A, Lee BS, Yu T, Sheng S, Peng T, Hu S, Crowe DL, Zhou X. Proteomic Based Identification of Manganese Superoxide Dismutase 2 (SOD2) as a Metastasis Marker for Oral Squamous Cell Carcinoma. Cancer Genomics Proteomics. 2008;5(2):85–94. [PMC free article] [PubMed] [Google Scholar]
- 21.Ye H, Yu T, Temam S, Ziober BL, Wang J, Schwartz JL, Mao L, Wong DT, Zhou X. Transcriptomic dissection of tongue squamous cell carcinoma. BMC Genomics. 2008;9(1):69. doi: 10.1186/1471-2164-9-69. [DOI] [PMC free article] [PubMed] [Google Scholar]
- 22.Hu L, Ibrahim S, Liu C, Skaar J, Pagano M, Karpatkin S. Thrombin induces tumor cell cycle activation and spontaneous growth by down-regulation of p27Kip1, in association with the up-regulation of Skp2 and MiR-222. Cancer Res. 2009;69(8):3374–3381. doi: 10.1158/0008-5472.CAN-08-4290. [DOI] [PMC free article] [PubMed] [Google Scholar]
- 23.Miller TE, Ghoshal K, Ramaswamy B, Roy S, Datta J, Shapiro CL, Jacob S, Majumder S. MicroRNA-221/222 confers tamoxifen resistance in breast cancer by targeting p27(Kip1) J Biol Chem. 2008 doi: 10.1074/jbc.M804612200. [DOI] [PMC free article] [PubMed] [Google Scholar]
- 24.Nelson KK, Melendez JA. Mitochondrial redox control of matrix metalloproteinases. Free Radic Biol Med. 2004;37(6):768–784. doi: 10.1016/j.freeradbiomed.2004.06.008. [DOI] [PubMed] [Google Scholar]
- 25.Nelson KK, Ranganathan AC, Mansouri J, Rodriguez AM, Providence KM, Rutter JL, Pumiglia K, Bennett JA, Melendez JA. Elevated sod2 activity augments matrix metalloproteinase expression: evidence for the involvement of endogenous hydrogen peroxide in regulating metastasis. Clin Cancer Res. 2003;9(1):424–432. [PubMed] [Google Scholar]
- 26.Yang JQ, Zhao W, Duan H, Robbins ME, Buettner GR, Oberley LW, Domann FE. v-Ha-RaS oncogene upregulates the 92-kDa type IV collagenase (MMP-9) gene by increasing cellular superoxide production and activating NF-kappaB. Free Radic Biol Med. 2001;31(4):520–529. doi: 10.1016/s0891-5849(01)00613-x. [DOI] [PubMed] [Google Scholar]
- 27.Liu X, Chen Z, Yu J, Xia J, Zhou X. MicroRNA profiling and head and neck cancer. Comp Funct Genomics. 2009;2009:1–7. doi: 10.1155/2009/837514. [DOI] [PMC free article] [PubMed] [Google Scholar]
- 28.Vairaktaris E, Yapijakis C, Derka S, Serefoglou Z, Vassiliou S, Nkenke E, Ragos V, Vylliotis A, Spyridonidou S, Tsigris C, et al. Association of matrix metalloproteinase-1 (-1607 1G/2G) polymorphism with increased risk for oral squamous cell carcinoma. Anticancer Res. 2007;27(1A):459–464. [PubMed] [Google Scholar]
- 29.O-charoenrat P, Leksrisakul P, Sangruchi S. A functional polymorphism in the matrix metalloproteinase-1 gene promoter is associated with susceptibility and aggressiveness of head and neck cancer. Int J Cancer. 2006;118(10):2548–2553. doi: 10.1002/ijc.21644. [DOI] [PubMed] [Google Scholar]
- 30.Cao ZG, Li CZ. A single nucleotide polymorphism in the matrix metalloproteinase-1 promoter enhances oral squamous cell carcinoma susceptibility in a Chinese population. Oral Oncol. 2006;42(1):32–38. doi: 10.1016/j.oraloncology.2004.08.015. [DOI] [PubMed] [Google Scholar]
- 31.Lin SC, Chung MY, Huang JW, Shieh TM, Liu CJ, Chang KW. Correlation between functional genotypes in the matrix metalloproteinases-1 promoter and risk of oral squamous cell carcinomas. J Oral Pathol Med. 2004;33(6):323–326. doi: 10.1111/j.1600-0714.2004.00214.x. [DOI] [PubMed] [Google Scholar]