

Abstract
BACKGROUND
Elevated night time/daytime blood pressure (BP) ratios are associated with cardiovascular morbidity and mortality. We evaluated the associations between sleep/awake BP ratios and sleep disturbances.
METHODS
Sleep disturbances were assessed by in-home actigraphy and diary measures for nine nights, and polysomnography (PSG) for two nights; ambulatory BP was measured for at least 48 h. Participants were 186 middle-aged African-American and Caucasian men and women who were free from prevalent myocardial infarction, stroke, history of interventional cardiology procedures, diabetes, and diagnosed apnea or other sleep disorders.
RESULTS
Results showed that the greater the sleep/wake ratios of BP, the more fragmented the sleep, the greater the proportion in stage 1 (light) sleep and the smaller the proportion in rapid eye movement (REM) sleep, and the greater the number of arousals from sleep. These results were independent of age, race, gender, Framingham Risk status, cardiovascular medications, body mass index, and apnea/hypopnea index. Indicators of psychosocial stress were not greater among those with higher sleep/wake BP ratios.
CONCLUSIONS
Findings are consistent with the hypothesis that elevated night time/daytime pressure may be a consequence of poor sleep.
Normal blood pressure (BP) varies across 24 h, with daytime pressures being higher than night time pressures.1 By convention, individuals who fail to show lower night time BP of at least 10% relative to daytime BP are termed nondippers. Evidence suggests that persons with a nondipping pattern are at higher risk for cardiovascular morbidity and mortality than those with a dipping pattern.2-6 Furthermore, comparisons of the predictive values of night time with daytime pressure show that night time BP, relative to daytime BP, is a better predictor of cardiovascular events in both hypertensive and normotensive individuals, although some comparisons show no difference.1
Elevated night time/daytime BP may be a consequence of inadequate sleep. Consistent with this explanation are several studies of normotensive and hypertensive men and women. Nondippers had more night time (and less daytime) movement as measured by actigraphy than did dippers.7,8 Furthermore, nondippers had less stage 4 (deep) sleep, more stage 1 (light) sleep, and a greater percentage of being awake after initial sleep onset during one night of in-home polysomnography (PSG) assessment, relative to dippers.9
To the extent the elevated night time/daytime BP is associated with more movement during sleep, and lighter and less deep sleep, it is important to understand potential factors accounting for the results. Sleep apnea can disturb sleep, and elevated night time BP may be secondary to apnea.10,11 Similarly, sympathetic activation may result in disturbed sleep. Sherwood et al. showed that relative to dippers, nondippers had a smaller fall in urinary norepinephrine and epinephrine excretion while asleep relative to being awake, and had heightened α-adrenergic responsivity, but not β-adrenergic responsivity.12 They suggested that nondippers have elevated BP at night that is secondary to persistent night time vasoconstriction. Conditions such as diabetes, medications for a variety of conditions, shift work, and psychological stress can also disturb sleep and are associated with altered night/day BP.13-15
This study tested the hypothesis that elevated sleep/awake BP was associated with sleep continuity, architecture, and movement during sleep in African-American and Caucasian men and women. We evaluated possible factors that inform the associations between sleep/awake BP and sleep characteristics.
METHODS
Participants
Participants in this project, which is called SleepSCORE, were recruited from the Heart Strategies Concentrating on Risk Evaluation (HeartSCORE), a prospective community-based cohort study investigating the mechanisms accountable for population disparities in cardiovascular risk.16 HeartSCORE eligibility criteria included age between 45 and 75 years, residence in the greater Pittsburgh metropolitan area, and absence of comorbid conditions expected to limit life expectancy to <5 years.
SleepSCORE recruited 186 African-American and Caucasian men and women with high/moderate or low risk Framingham scores. The exclusionary criteria for SleepSCORE included pregnancy; use of continuous positive airway pressure treatment for sleep-disordered breathing; regular use of medications for sleep problems; night time work schedule; medication for diabetes; and prior diagnosis of stroke, myocardial infarction, or interventional cardiology procedures. Both HeartSCORE and SleepSCORE protocols were approved by the University of Pittsburgh Institutional Review Board and all participants provided written informed consent for both protocols.
Overview
Eligible participants were recruited during regular HeartSCORE assessment visits (Figure 1). Consented participants were scheduled for the 10-day study protocol within ~3 months of initial contact. Throughout all 10 days and 9 nights of the study, participants wore an actigraph and completed each morning and evening a diary about the quality of their sleep and activities of the day, respectively. On nights 1 and 2, PSG electrodes and sensors were placed on the participants in their homes by trained sleep technicians, and sleep measurements were recorded. On night 2, a 15-h overnight urine collection began and questionnaires were completed. On day 3, participants were trained on how to use the ambulatory BP monitor and they began wearing the BP monitor continuously (with the exception of showering) through day 5. A second 15-h overnight urine collection was done on night 4. Finally, they completed additional questionnaires.
Figure 1.
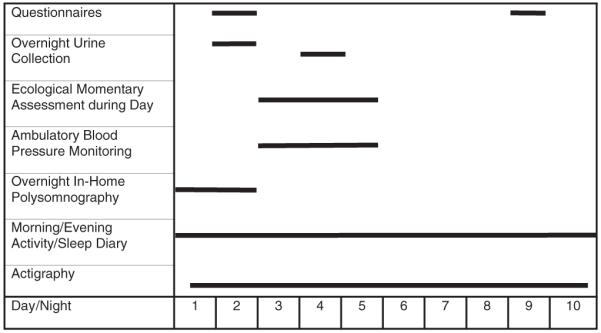
Study protocol diagram. Dark line indicates assessment days for procedure.
Ambulatory BP assessment
A Spacelabs Monitor #90217 was programmed to assess BP assessment every 30 min from 8 am to 9 pm and hourly thereafter. This monitor has been certified according to the British Hypertension Society criteria as being a reliable and valid measure of ambulatory BP.17 BP was averaged within the period of time that participants reported going to sleep and awakening across the two nights, confirmed by sleep diary and actigraphy (see later), and across the remaining time period of being awake. This procedure had the advantage of using all available BP data during waking hours as participants started and ended their BP assessment at various times of day depending on their work and home commitments. To be included, individuals had to have a minimum of 16 awake and 6 night BP readings across the measurement period. The ratios of sleep/awake BP were based on an average of 55.1, s.d. 7.9 (range 20–66) awake and 14.1, s.d. = 2.5 (6–20) night readings. Associations between the ratios of sleep/awake BP across nights/days 3 and 4 were rs = 0.44, Ps < 0.0001 for SBP and DBP.
Sleep assessment
Actigraphy
The Actiwatch 16 (Respironics, Bend, OR) recorded sleep and wake patterns via physical movement to provide behavioral data regarding usual sleep/wake patterns.18 The following sleep parameters were averaged across the nine consecutive nights of data collection: sleep duration (actual sleep time excluding periods of wakefulness during the night); and fragmentation index, which is a measure of movement during the inactive period inferred to be a measure of sleep disruption (specifically, i.e., number of mobile epochs lasting four epochs + number of immobile epochs <1 min duration/number of immobile epochs >1 min duration) × 100.)
Self-report
Each morning upon awakening, participants recorded their bed times, wake times, and subjective reports of sleep quality. Each evening immediately before going to bed, they recorded their daily activities, including napping yes/no, and caffeine, alcohol, and nicotine use in morning, afternoon, and evening. Specific diary items used in the current analyses included feeling rested upon awakening (0 = “not at all rested” to 4 = “extremely rested”); and perception of the previous night’s sleep quality (0 = “very poor” to 4 = “very good”), which were averaged because of their high correlation, r = 0.79. Below this averaged rating is labeled “rested”. Participants completed the Pittsburgh Sleep Quality Index, which measures subjective sleep quality over the previous month,19 and the Epworth Sleepiness Scale,20 which measures daytime sleepiness in specific situations, with higher scores reflective of worse sleep and sleepiness, respectively.
PSG
Two nights of PSG recording were conducted in participants’ homes using an ambulatory Compumedics Siesta monitor. The PSG montage included bilateral central and occipital electroencephalogram channels, bilateral electrooculograms, bipolar submentalis electromyograms, and one channel of electrocardiogram recording. On the first night of PSG, participants were monitored for sleep-disordered breathing using nasal pressure, inductance plethysmography, and fingertip oximetry. High-frequency filter settings were 30 Hz for electroencephalogram and electrooculograms, and 70 Hz for electromyogram. Low-frequency filter settings were .3 Hz for electroencephalogram and 10 Hz for electromyogram. Trained PSG technologists scored sleep records using standard sleep stage scoring criteria for each 20-s epoch.21 American Academy of Sleep Medicine Task Force22 definitions were used to identify apneas and hypopneas; oximetry readings were used to quantify average and minimum oxygen saturation levels.
PSG variables in the analysis were sleep duration; sleep latency (minutes until the first 10 min of stage 2 or deeper sleep interrupted by no more than 2 min of stage 1 or wakefulness); sleep efficiency; percentage of total sleep time spent in stage 1, stage 2, stages 3–4, and rapid eye movement (REM) sleep; and number of arousals from sleep to awake per hour of sleep. Values from the two nights were averaged. Respiratory measures on night 1 were used to calculate the apnea/hypopnea index (AHI; number of breathing pauses or shallow breathing episodes per hour of sleep).
Stress assessment
The occurrence of 18 stressful life events was assessed by a questionnaire,23 followed by ratings of whether the events were upsetting on a three-point scale, and currently still upsetting, yes/no. Because 90 participants reported no upsetting life events and 30 reported only one, the variable was dichotomized into yes/no for any very upsetting and ongoing event. The four-item version of the Perceived Stress Scale assessed levels of perceived stress over the past week, and responses over the two administrations were averaged.24 Overnight (15-h) urine samples were assayed for catecholamines, using a commercially available competitive immunoassay (2 CAT EIA) distributed by Rocky Mountain Diagnostics, Colorado Springs, CO. Sensitivity was 0.33 ng/ml for epinephrine and 1.33 ng/ml for norepinephrine. The between-assay variation ranged from 10.1 to 13.2% for epinephrine and 8.5 to 14.0% for norepinephrine. The catecholamines were averaged across the two nights. None of the participants had elevated creatinine >1.5 mg/dl.
Other relevant data
Ethnicity, gender, education, and age were determined by self-report at the time of study participation. Information regarding regular medication use and medication use over the past 2 days was collected. Use of any cardiovascular medications that were related to any sleep characteristics in preliminary analyses was coded as yes/no. Smoking status was determined by current self-reported nicotine use and was coded dichotomously. Body mass index was measured at the time of the HeartSCORE examination. As part of HeartSCORE, the components contributing to the Framingham Risk Index25 were measured, i.e., total cholesterol, high-density lipoprotein cholesterol, smoking, and BP or use of antihypertensive medications. Participants who reported a history of hypertension and were using antihypertensive medication (angiotensin-converting enzyme inhibitors, angiotensin II blockers, β-blockers, calcium channel blockers, α1-blockers, α2-agonists, and diuretics) at the time of the sleep study or had clinic systolic (S) BP ≥140 or diastolic (D) BP ≥90 were considered hypertensive in the analyses stratified by hypertensive status.
Statistical analyses
Variables were transformed as necessary before analysis. The primary analyses were Pearson’s correlations between night time/daytime ratio of SBP and DBP and sleep characteristics in unadjusted analyses, and in analyses adjusted for age, gender, race, Framingham Risk status, body mass index, and use of cardiovascular medications. Use of medication for depression (N = 15) was associated with percentage REM sleep and number of arousals, so secondary analyses also included use of antidepressants medications as yes/no. Covariates in the analyses stratified by hypertensive–normotensive status were age, gender, race, and body mass index. P values of <0.05 were considered statistically significant.
RESULTS
The sample was composed of ~40% African American, 50% men, and 50% at low risk for future heart attack based on the Framingham Risk Index score (Table 1). Seventy-nine participants were considered hypertensive at the time of their sleep studies. On average, their measured BP at the time of the SleepSCORE protocol was in the normal range, both while sleeping and awake. A substantial number of participants was considered to be nondippers.
Table 1. Sample characteristics (N = 186).
| No. (%) men | 98 (52.7) |
| No. (%) of African Americans | 76 (40.8) |
| Mean (s.d.) | |
| Age (years) | 59.6 (7.19) |
| Body mass index | 29.4 (5.02) |
| Education, no. (%) | |
| High school or less | 30 (16.1) |
| Some college | 62 (33.4) |
| Four year degree or higher | 94 (50.5) |
| Framingham risk index, no. (%) | |
| Low | 94 (50.5) |
| Moderate/high | 92 (49.5) |
| Hypertensive, no. (%) | 79 (42.5) |
| Sleep blood pressure (mm Hg), mean (s.d.) | |
| Systolic | 116 (12.8) |
| Diastolic | 68 (8.7) |
| Awake Blood Pressure (mm Hg), mean (s.d.) | |
| Systolic | 129 (12.6) |
| Diastolic | 79 (8.9) |
| Sleep heart rate (bpm), mean (s.d.) | 66 (9.0) |
| Awake heart rate (bpm), mean (s.d.) | 77 (10.1) |
| Clinic blood pressure, no. (%) | |
| Systolic ≥140 (mm Hg) | 55 (29.6) |
| Diastolic ≥90 (mm Hg) | 32 (17.2) |
| Systolic blood pressure nondippers, no. (%) | 91 (48.9) |
| Diastolic pressure nondippers, no. (%) | 58 (31.2) |
Sleep characteristics
Participants who had greater sleep/awake SBP and DBP ratios had higher fragmentation scores across the nine nights as measured by actigraphy (Table 2). In addition, those with a greater sleep/awake SBP ratios slept less on average across the nine nights (unadjusted analyses), and those with higher SBP and DBP ratios reported naps on more days of the nine-day protocol, rs = 0.17 and 0.18, Ps = 0.02, respectively, and during the 2 days of BP assessment, rs = 0.14 and 0.18, Ps ≤ 0.05, respectively, in unadjusted analyses. A similar pattern was obtained in the adjusted analyses.
Table 2. Correlations between systolic and diastolic blood pressure sleep/awake ratios and sleep characteristics.
| Systolic blood pressure |
Diastolic blood pressure |
|||
|---|---|---|---|---|
| Unadjusted | Adjusted | Unadjusted | Adjusted | |
| Actigraphy across nine nights | ||||
| Duration | −0.17* | −0.12 | −0.10 | −0.09 |
| Fragmentation Index |
0.28† | 0.28† | 0.24† | 0.24† |
| Polysomnography across two nights | ||||
| Duration | 0.03 | 0.06 | 0.01 | 0.03 |
| Latency | 0.18* | 0.13 | 0.14 | 0.11 |
| Efficiency | −0.17* | −0.11 | −0.12 | −0.06 |
| % Stage 1 | 0.15* | 0.20† | 0.10 | 0.10 |
| % Stage 3–4 | −0.09 | −0.02 | −0.12 | −0.06 |
| % REM | −0.18* | −0.17* | −0.17* | −0.16* |
| No. of arousals | 0.13 | 0.18* | 0.15* | 0.18* |
| Apnea/hypopnea index (night 1 only) |
0.15* | 0.09 | 0.19† | 0.11 |
| Self-report diary ratings across nine nights | ||||
| Rested upon awakening |
−0.14 | −0.13 | −0.14 | −0.15* |
| Pittsburgh Sleep Quality Questionnaire |
0.03 | 0.01 | −0.02 | −0.01 |
| Epworth Sleepiness Questionnaire |
0.04 | 0.04 | 0.02 | 0.01 |
Analyses adjusted for race, gender, age, Framingham Risk Index, body mass index, and cardiovascular medication status.
P < 0.05
P < 0.01.
On the two PSG nights, participants who had greater sleep/awake SBP ratios had a greater percentage of stage 1 sleep and a smaller percentage of REM sleep; a longer latency until sleep and less-efficient sleep (unadjusted analyses); and a greater number of arousals (adjusted analyses) and a higher AHI score (unadjusted analyses; Table 2). Participants who had a greater sleep/awake DBP ratio had a smaller percent REM sleep, a greater number of sleep arousals, and a lower AHI score (unadjusted analyses). Further adjustment for anti-depressant medication showed the same pattern of results. SBP and DBP awake/sleep ratios were not associated with the proportion of stage 3–4 sleep, feeling rested upon awakening, or the Pittsburgh Sleep Quality Index and Epworth Sleepiness Scale scores.
Greater fragmentation scores across the nine nights were associated with SBP awake/sleep ratios in both hypertensives and normotensives taken separately (adjusted r = 0.28, P < 0.02 and r = 0.27, P < 0.01, respectively), and with DBP awake/sleep ratios in normotensives only (r = 0.28, P < 0.01) Among hypertensives only, a smaller percent REM sleep and a greater number of arousals were associated with both SBP and DBP awake/sleep ratios, all Ps < 0.05 in adjusted analyses; feeling less rested upon awakening was associated with SBP ratios, P = 0.03).
Potential correlates of relationships between BP sleep/awake ratios and sleep characteristics
Compared to those with AHI scores <15, those with AHI scores ≥15 had higher SBP ratios (Ms = 0.89 vs. 91, P = 0.04) and DBP ratios (Ms = 0.85 vs. 88, P = 0.02). Statistical adjustments for AHI (either continuous or dichotomous) did not alter the associations of the SBP and DBP sleep/awake ratios with the sleep parameters. Diary measures of number of evenings that participants consumed caffeinated beverages were unrelated to any sleep parameter and or to overnight catecholamines. Perceived stress (rs < 0.11) and overnight catecholamines (rs < −0.06) were unrelated to the SBP and DBP sleep/awake ratios, respectively, whereas occurrence of any stressful life events that were still upsetting was inversely related to the SBP ratio (r = −0.18, P = 0.02) in the adjusted model. Because some participants may have been awakened by BP assessments during the night,26 leading to elevated night time BP, we repeated the partial correlation analyses for the seven nights of actigraphy when ambulatory BP was not being assessed. The results for fragmentation remained significant.
DISCUSSION
The study assessed whether sleep continuity, architecture, and movement were associated with elevated sleep/wake BP ratios. Indeed, participants who had elevated sleep/wake BP ratios measured across two nights experienced more fragmented sleep during the nine-night period and the seven nights without BP measurement. They also reported taking naps on more days in their diaries. During the two nights of PSG measurement, they had a greater proportion of light sleep (stage 1), a smaller proportion of REM sleep, and more arousals from sleep. The effects for percent REM sleep and number of arousals were primarily due to the hypertensives. However, fragmented sleep was characteristic of participants with higher sleep/awake SBP ratios, regardless of hypertensive status.
We also evaluated whether the obtained associations could be secondary to sleep-disordered breathing or indicators of stress. Statistical controls for AHI did not alter the results,27 which may not be surprising given that hypoxic stress may have more to do with impaired glucose tolerance and arousals more to do with elevated BP.28 The SBP and DBP sleep/awake ratios were not associated with perceptions of stress or urinary catecholamines, but were unexpectedly inversely associated with the number of upsetting stressful events. In Sherwood et al.,12 note that dippers and nondippers did not differ in catecholamines measured during sleeping or awake periods, but they did differ in the difference between sleep and awake catecholamines. Nonetheless, our findings are not consistent with the hypothesis that elevated sleep/awake BP is primarily due to elevated sympathetic activation or to sleep-disordered breathing.
The study has several limitations. First, we did not measure salt sensitivity or alteration of the hypothalamic-pituitary-adrenal axis,29,30 which would inform the mechanisms linking between sleep and elevated night/day BP ratios. Second, because an exclusion criterion for participation was previously diagnosed sleep disorders, the findings cannot be generalized to sleep clinic patients. Third, the study was cross-sectional in design. Although we posited that inadequate sleep leads to elevated night time pressure, it is also possible that elevated night time pressure disturbs sleep or that a third factor leads to dysregulation in both the wake/sleep and circulatory systems.
The study has several strengths. First, the study sample was based on a community-based epidemiological study, rather than on a patient population, and was composed of African-American and Caucasian men and women. Second, rather than focus on one method of sleep assessment, it used multiple methods across longer periods of time. As a consequence, the obtained associations should be reproducible. Third, the measurements were taken in the home to permit measurement of sleep in the participants’ usual sleep environment. Fourth, the assessment of dipping status was based on two nights of BP recording, rather than one night, which is less reliable.31 Finally, it evaluated the influence of sleep-disordered breathing, BP medications, and markers of psychological stress as potential factors that may inform BP–sleep associations.
Our findings have a number of important implications. First, they are consistent with the hypothesis that elevated night/day BP may be a consequence of fragmented and light sleep. Stated differently, fragmented and light sleep may be a key mechanism in accounting why some persons exhibit abnormalities in the usual circadian rhythm of BP. If so, interventions to improve sleep in nondippers could potentially lower sleep BP as well. Second, our findings may inform the association between elevated sleep/awake BP and risk for CVD events. To the extent that fragmented and light sleep can cause abnormalities in the usual circadian rhythm of BP, sleep parameters may be key to understanding why elevated sleep/awake BP is connected to CVD risk. Although to our knowledge there are no epidemiological data connecting fragmented and light sleep, independent of apnea, to CVD risk, sleep deprivation experiments do report disturbances in BP regulation.32 Future epidemiological studies that include both sleep BP and sleep characteristics will facilitate understanding of the risk associated with disturbances in wake/sleep cycles and correlated biorhythms.
In summary, participants with elevated sleep/wake BP ratios had more fragmented sleep and lighter sleep. Although the findings are cross-sectional and modest in effect size, they suggest that sleep disturbance may be one mechanism to further investigate to understand elevated night/day BP ratios. Improving sleep may lead to lower night/day BP ratios, especially among hypertensive patients.
Acknowledgments
Supported by NIH HL076379, HL076852, HL076858, and CTSA/N-CTRC #RR024153. This project is funded in part under a grant with the Pennsylvania Department of Health (Contract ME-02-384). The Department specifically disclaims responsibility for any analyses, interpretations, or conclusions.
Footnotes
Disclosure: Dr Daniel Buysse serves as a consultant for: Actelion, Arena, Cephalon, Eli Lilly, GlaxoSmithKline, Merck, Neurocrine, Neurogen, Pfizer, Respironics, sanofi-aventis, Sepracor, Servier, Stress Erase, and Takeda Pharmaceuticals. No other author reports a conflict of interest.
References
- 1.Pickering TG, Shimbo D, Haas D. Ambulatory blood-pressure monitoring. N Engl J Med. 2006;354:2368–2374. doi: 10.1056/NEJMra060433. [DOI] [PubMed] [Google Scholar]
- 2.Verdecchia P, Angeli F, Borgioni C, Gattobigio R, Reboldi G. Ambulatory blood pressure and cardiovascular outcome in relation to perceived sleep deprivation. Hypertension. 2007;49:777–783. doi: 10.1161/01.HYP.0000258215.26755.20. [DOI] [PubMed] [Google Scholar]
- 3.Kikuya M, Ohkubo T, Asayama K, Metoki H, Obara T, Saido S, Hashimoto J, Totsune K, Hoshi H, Satoh H, Imai Y. Ambulatory blood pressure and 10-year risk of cardiovascular and noncardiovascular mortality: the Ohasama study. Hypertension. 2005;45:240–245. doi: 10.1161/01.HYP.0000152079.04553.2c. [DOI] [PubMed] [Google Scholar]
- 4.Ingelsson E, Bjorklund-Bodegard K, Lind L, Arnlov J, Sundstrom J. Diurnal blood pressure pattern and risk of congestive heart failure. JAMA. 2006;295:2859–2866. doi: 10.1001/jama.295.24.2859. [DOI] [PubMed] [Google Scholar]
- 5.Dolan E, Stanton A, Thijs L, Hinedi K, Atkins N, McClory S, Den Hond E, McCormack P, Staessen JA, O’Brien E. Superiority of ambulatory over clinic blood pressure measurement in predicting mortality: the Dublin outcome study. Hypertension. 2005;46:156–161. doi: 10.1161/01.HYP.0000170138.56903.7a. [DOI] [PubMed] [Google Scholar]
- 6.Staessen JA, Thijs L, Fagard R, O’Brien ET, Clement D, de Leeuw PW, Mancia G, Nachev C, Palatini P, Parati G, Tuomilehto J, Webster J, Systolic Hypertension in Europe Trial Investigators Predicting cardiovascular risk using conventional vs. ambulatory blood pressure in older patients with systolic hypertension. JAMA. 1999;282:539–546. doi: 10.1001/jama.282.6.539. [DOI] [PubMed] [Google Scholar]
- 7.Leary AC, Donnan PT, MacDonald TM, Murphy MB. Physical activity level is an independent predictor of the diurnal variation in blood pressure. J Hypertens. 2000;18:405–410. doi: 10.1097/00004872-200018040-00008. [DOI] [PubMed] [Google Scholar]
- 8.Kario K, Schwartz JE, Pickering TG. Ambulatory physical activity as a determinant of diurnal blood pressure variation. Hypertension. 1999;34:685–691. doi: 10.1161/01.hyp.34.4.685. [DOI] [PubMed] [Google Scholar]
- 9.Loredo JS, Nelesen R, Ancoli-Israel S, Dimsdale JE. Sleep quality and blood pressure dipping in normal adults. Sleep. 2004;27:1097–1103. doi: 10.1093/sleep/27.6.1097. [DOI] [PubMed] [Google Scholar]
- 10.Suzuki M, Guilleminault C, Otsuka K, Shiomi T. Blood pressure “dipping” and “non-dipping” in obstructive sleep apnea syndrome patients. Sleep. 1996;19:382–387. doi: 10.1093/sleep/19.5.382. [DOI] [PubMed] [Google Scholar]
- 11.Portaluppi F, Provini F, Cortelli P, Piazzi G, Bertozzi N, Manfredini R, Fersini C, Lugaresi E. Undiagnosed sleep-disordered breathing among male nondippers with essential hypertension. J Hypertens. 1997;15:1227–1233. doi: 10.1097/00004872-199715110-00006. [DOI] [PubMed] [Google Scholar]
- 12.Sherwood A, Steffen PR, Blumenthal JA, Kuhn C, Hinderliter AL. Nighttime blood pressure dipping: the role of the sympathetic nervous system. Am J Hypertens. 2002;15(2 Pt 1):111–118. doi: 10.1016/s0895-7061(01)02251-8. [DOI] [PubMed] [Google Scholar]
- 13.Holl RW, Pavlovic M, Heinze E, Thon A. Circadian blood pressure during the early course of type 1 diabetes: analysis of 1,011 ambulatory blood pressure recordings in 354 adolescents and young adults. Diabetes Care. 1999;22:1151–1157. doi: 10.2337/diacare.22.7.1151. [DOI] [PubMed] [Google Scholar]
- 14.Yamasaki F, Schwartz JE, Gerber LM, Warren K, Pickering TG. Impact of shift work and race/ethnicity on the diurnal rhythm of blood pressure and catecholamines. Hypertension. 1998;32:417–423. doi: 10.1161/01.hyp.32.3.417. [DOI] [PubMed] [Google Scholar]
- 15.Smolensky MH, Hermida RC, Castriotta RJ, Portaluppi F. Role of sleep-wake cycle on blood pressure circadian rhythms and hypertension. Sleep Med. 2007;8:668–680. doi: 10.1016/j.sleep.2006.11.011. [DOI] [PubMed] [Google Scholar]
- 16.Aiyer AN, Kip KE, Marroquin OC, Mulukutla SR, Edmundowicz D, Reis SE. Racial differences in coronary artery calcification are not attributed to differences in lipoprotein particle sizes: the Heart Strategies Concentrating on Risk Evaluation (HeartSCORE) Study. Am Heart J. 2007;153:328–334. doi: 10.1016/j.ahj.2006.11.002. [DOI] [PubMed] [Google Scholar]
- 17.O’Brien E, Coats A, Owens P, Petrie J, Padfield PL, Littler WA, de Swiet M, Mee F. Use and interpretation of ambulatory blood pressure monitoring: recommendations of the British Hypertension Society. Br Med J. 2000;320:1128–1134. doi: 10.1136/bmj.320.7242.1128. [DOI] [PMC free article] [PubMed] [Google Scholar]
- 18.Ancoli-Israel S, Cole R, Alessi C, Chambers M, Moorcroft W, Pollak CP. The role of actigraphy in the study of sleep and circadian rhythms. Sleep. 2003;26:342–392. doi: 10.1093/sleep/26.3.342. [DOI] [PubMed] [Google Scholar]
- 19.Buysse DJ, Reynolds CF, Monk TH, Berman SR, Kupfer DJ. The Pittsburgh Sleep Quality Index: a new instrument for psychiatric practice and research. Psychiatry Res. 1989;28:193–213. doi: 10.1016/0165-1781(89)90047-4. [DOI] [PubMed] [Google Scholar]
- 20.Johns MW. A new method for measuring daytime sleepiness: the Epworth sleepiness scale. Sleep. 1991;14:540–545. doi: 10.1093/sleep/14.6.540. [DOI] [PubMed] [Google Scholar]
- 21.Rechtschaffen A, Kales A. A manual of standardized terminology, techniques and scoring system for sleep stages of human subjects NIH Publication 204. US Government Printing Office, Department of Health Education and Welfare; Washington, DC: 1986. [Google Scholar]
- 22.American Academy of Sleep Medicine Task Force Sleep-related breathing disorders in adults: recommendations for syndrome definition and measurement techniques in clinical research. Sleep. 1999;22:667–689. [PubMed] [Google Scholar]
- 23.Bromberger JT, Matthews KA. A longitudinal study of the effects of pessimism, trait anxiety and life stress on depressive symptoms in middle-aged women. Psychol Aging. 1996;11:207–213. doi: 10.1037//0882-7974.11.2.207. [DOI] [PubMed] [Google Scholar]
- 24.Cohen S, Williamson GM. Perceived stress in a probability sample of the United States. In: Spacapan S, Oskamp S, editors. The Social Psychology of Health. Sage; Newbury Park, CA: 1988. pp. 31–67. [Google Scholar]
- 25.Wilson PW, D’Agostino RB, Levy D, Belanger AM, Silbershatz H, Kannel WB. Prediction of coronary heart disease using risk factor categories. Circulation. 1998;97:1837–1847. doi: 10.1161/01.cir.97.18.1837. [DOI] [PubMed] [Google Scholar]
- 26.Lenz M, Martinez D. Awakenings change results of nighttime ambulatory blood pressure monitoring. Blood Press Monit. 2007;12:9–15. doi: 10.1097/MBP.0b013e3280858c70. [DOI] [PubMed] [Google Scholar]
- 27.Loredo JS, Ancoli-Israel S, Dimsdale JE. Sleep quality and blood pressure dipping in obstructive sleep apnea. Am J Hypertes. 2001;14:887–892. doi: 10.1016/s0895-7061(01)02143-4. [DOI] [PubMed] [Google Scholar]
- 28.Sulit L, Storfer-Isser A, Kirchner HL, Redline S. Differences in polysomnography predictors for hypertension and impaired glucose tolerance. Sleep. 2006;29:7777–7783. doi: 10.1093/sleep/29.6.777. [DOI] [PubMed] [Google Scholar]
- 29.Holt-Lunsta J, Steffen PR. Diurnal cortisol variation is associated with nocturnal blood pressure dipping. Psychosom Med. 2007;69:339–343. doi: 10.1097/PSY.0b013e318050d6cc. [DOI] [PubMed] [Google Scholar]
- 30.Ekstedt M, Akerstedt T, Soderstrom M. Microarousals during sleep are associated with increased levels of lipids, cortisol, and blood pressure. Psychosom Med. 2004;66:925–931. doi: 10.1097/01.psy.0000145821.25453.f7. [DOI] [PubMed] [Google Scholar]
- 31.Dimsdale JE, Heeren MM. How reliable is nighttime blood pressure dipping? Am J Hypertens. 1998;11:606–609. doi: 10.1016/s0895-7061(98)00033-8. [DOI] [PubMed] [Google Scholar]
- 32.Knutson KL, Spiegel K, Penev P, Van Cauter E. The metabolic consequences of sleep deprivation. Sleep Med Rev. 2007;11:163–178. doi: 10.1016/j.smrv.2007.01.002. [DOI] [PMC free article] [PubMed] [Google Scholar]