

Abstract
The microscopic mechanics of DNA stretching was characterized using extensive molecular dynamics simulations. By employing an anisotropic pressure control method, realistic force-extension dependences of effectively infinite DNA molecules were obtained. A coexistence of B- and S-DNA domains was observed during the overstretching transition. The simulations revealed that strain softening may occur in the process of stretching torsionally constrained DNA. The latter observation was qualitatively reconciled with available experimental data using a random-field Ising model.
The mechanical properties of double-stranded DNA (dsDNA) have been the subject of extensive studies [1–7] because of their fundamental importance to gene regulation processes in biological cells. Single molecule manipulation experiments revealed a characteristic plateau in the force-extension curve of dsDNA that signifies a highly cooperative transition from a canonical B-DNA structure to an overstretched S-DNA conformation, the so-called B to S transition [2]. Despite extensive experimental and theoretical studies, the nature of the B to S transition remains controversial [5]. Molecular dynamics (MD) simulations revealed that stretching DNA with a force transforms the canonical B-DNA structure into a ladder-like conformation [2, 6]. However, subsequent thermodynamic analysis of DNA stretching suggested that the “B–S” plateau indicates a melting transition, i.e., separation of the two DNA strands that occurs at the begining of (and throughout) the plateau [7]. Furthermore, both theory [3] and experiment [8] suggest that depending on the twist of the DNA helix, i.e., the number of base pairs per turn of the helix, several DNA conformations may coexist during the transition.
In contrast to previous MD studies of short ds-DNA fragments [2, 6, 9–11], in this letter we report the force-extension dependence of an effectively infinite DNA molecule that was stretched using an anisotropic pressure-control method. Figure 1(a) illustrates the setup of our simulations. A fragment of dsDNA two helical turns in length was submerged in an aqueous solution of 1 M KCl. Each strand of the DNA helix was covalently linked to itself over the periodic boundary of the system. Thus, any deformation modes with wave lengths bigger than the system size were suppressed. We constructed three systems having the following nucleotide sequences: poly(dA)·poly(dT), poly(d(CGATATATCG))·poly(d(GCTATATAGC)), and poly(dC)·poly(dG), which are referred to as sequence A, B and C, respectively. Note that sequence A and C is homogeneous, and sequence B is heterogeneous. According to experiment, the systems were built to contain 20 base pairs (bps) in two helical turns for sequences A and B [12, 13], and 21 bps for sequence C [12].
FIG. 1.
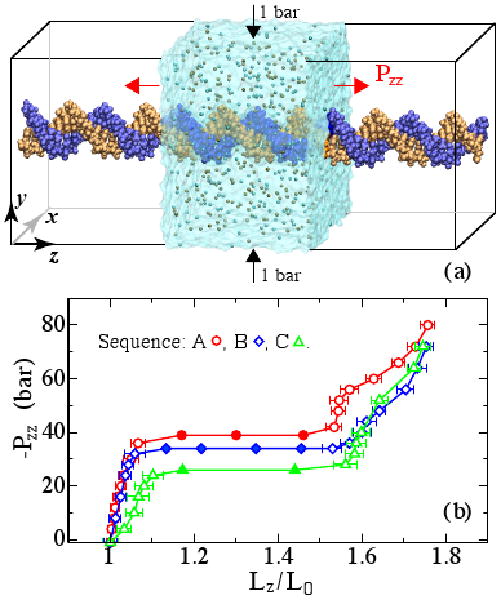
Anisotropic pressure control simulations of DNA stretching. (a) Setup of MD simulations. The transparent box illustrates the boundaries of the simulated system. Ions are shown as spheres. The DNA outside the transparent box illustrates the periodic boundary condition. (b) Simulated stress-extention dependence. The metastable states are shown as filled symbols with no error bars.
Following assembly, each system was equilibrated in the NPT ensemble [14] (P = 1 bar, T=310 K) for 10 ns using the program NAMD [15], the parm94 force field for DNA [16], the TIP3P model of water [17], standard parameters for ions [18], particle-mesh Ewald (PME) electrostatics and multiple time stepping [19]. Van der Waals interactions were calculated using a smooth (10-12 Å) cutoff. The temperature was kept constant by applying a Langevin thermostat [20] with damping rate 1 ps−1 to all non-hydrogen atoms. After equilibration, the systems measured about 78 × 78 × L0 Å3, where the average DNA contour length L0 was 65.8, 65.3 and 67.0 Å for sequence A, B, and C, respectively. During the equilibration, DNA remained in the B-form conformation.
To obtain the force-extension curve, each system was simulated under anisotropic pressure conditions that were maintained using the Nosé-Hoover Langevin piston pressure control [14]. While the Pxx and Pyy components of the pressure tensor were kept at 1 bar, the Pzz component was stepwise decreased [Fig. 1(a)]. When Pzz was assigned a negative value, the system stretched in the z direction until the total internal stress in the simulated system balanced the applied pressure Pzz. The water density remained constant. Repeating such simulations at different (negative) values of Pzz yielded the stress-strain curves shown in Fig. 1(b). Each point in the curves was obtained by equilibrating the system at a preset value of Pzz, requiring from 5 to 40 ns. Such equilibration times are considerably larger than a typical relaxation time of the internal stress, 2Lz/υ ∼ 10 ps, where υ (∼ 15 Å/ps) is the speed of sound in water.
Each stress-extention curve shown in Fig. 1(b) has three characteristic regions: elastic, transition, and overstretched. The DNA was observed to deform elastically up to a normalized extension (Lz/L0) of 1.06 for sequence A and B and up to 1.12 for sequence C. A plateau indicating a transition from canonical to overstretched structure was observed in a very narrow range of negative pressures [Fig. 1(a)]. The overstretched region begins at the end of the transition plateau where DNA extends to 1.6L0, in excellent agreement with experiment [2, 21]. Small plateaus in the overstretched region are reminiscent of the experimentally observed melting transition that follows the B to S transition [22, 23].
The kinetics of the B to S transition is illustrated in Fig. 2. At Pzz = −24 bar, the DNA molecule is elastically stretched; its average length is 67.7 Å [Fig. 2(a)]. When Pzz was set to −32 bar, the DNA's length was about 69.1 Å for the most of the 20 ns trajectory but could transiently increase to 78 Å as a group of 7-10 bps transiently lost its canonical B-DNA structure [Fig. 2(b)]. These elastic instabilities indicated proximity of the transition. When temperature was raised to 350 K, the transition occurred within 5 ns [Fig. 2(b)]. Further decreasing Pzz to −34 bar (at 310 K) initiated transition to the overstretched conformation [Fig. 2(c)]. After about 40 ns, the length of the DNA molecule reached 100 Å, i.e.,1.54L0. During the transition, the system visited several metastable states, which were identified as steps (Lz = 74, 80, 88 and 94 Å) in the DNA extension curve [Fig. 2(c)]. When Pzz was decreased directly from −32 to −36 bar, the transition occurred much faster than when quenched to −34 bar [Fig. 2(d)]; the system visited only two metastabe states (Lz = 85 and 93 Å). Decreasing Pzz from −36 to −44 bar increased the DNA length by 3 Å only [Fig. 2(e)], indicating the end of the transition plateau.
FIG. 2.

Kinetics of the B to S transition. (a-e) The length of a DNA fragment Lz versus simulation time under different values of Pzz (sequence B), decreasing in steps from −24 to −44 bar. At Pzz = −34 bar (panel c), the grey line corresponds to the last 20-ns fragment of the 40-ns MD trajectory.
In our simulations, the applied external pressure Pzz is balanced by the internal stress in DNA and water. Assuming the pressure in bulk water is isotropic, the zz component of the water stress tensor bar. Hence, the tensile force inside DNA can be computed as , where S and SDNA are the area of the simulation system and of DNA, respectively, in the x–y plane. Because pN, we use the following approximate formula to compute the tensile force in DNA: F = −(Pzz − 1) × S.
Using the above formula, the force-extension dependence of a DNA molecule, Fig. 3(a), was computed from the stress-extension dependence of the entire system [Fig. 1(b)]. Estimated from the slope of the force-extension curve, the elastic modulus of sequence C is much smaller than that of sequence A and B, which is consistent with previous MD studies [24]. A striking feature of the force-extension curves is a monotonic decrease of the tensile force in the transition region after initial increase to the yield force fy, i.e., a strain softening effect. This effect was also observed using an 11 pb per turn model of sequence A, and in the simulations performed using the latest parm-bsc0 force field [25] (data not shown). Microscopically, the strain softening effect is caused by the break up of the base pairing and base stacking interactions. Thus, depending on the history of the stretching process, the same stretching force can drive dsDNA into different conformations.
FIG. 3.

(a) Force-extension dependence of a torsionally constrained DNA. Solid symbols indicate the metastable states in the transition region [Fig. 2(c)]. (b) Force-extension dependence of nicked (circles, triangles) and torsionally constrained (squares) DNA. The inset shows the stable conformation of the heterogeneous sequence DNA at Lz/L0=1.27. The adenine, thymine, cytosine and guanine are shown in blue (black), purple (dark grey), orange (grey) and yellow (light grey), respectively.
Figure 4(a-c) illustrates three possible conformations of DNA under the tensile force of 170 pN. The local deformation of the DNA structure was quantified by plotting the averaged over six bps distance between the phosphorous atoms of the DNA backbone versus the bp number [Fig 4(d)].
FIG. 4.

Phase coexistence during the B to S transition. (a-c) Possible conformations of a DNA molecule (sequence B) in the elastically stretched (a), transition (b), and overstretched (c) regions under the tensile force of 170 pN. The nucleotides are colored as in Fig. 3b. Panel (c) illustrates a typical conformation of overstretched S-DNA, i.e., a partially melted duplex DNA. (d) The average distance between the phosphorous atoms of the DNA backbone (see text) for the DNA conformations shown in (a-c).
The conformation of the elastically stretched ds-DNA [Fig 4(a)] is close to the canonical B-DNA form, in which the tensile force is partially borne by orderly stacked bases. Beyond the elastic region, as the hydrogen bonds and base stacking yield, the DNA backbone stretches to bear a higher fraction of the tensile force. In the metastable state [Fig 4(b)], domains of B-DNA and overstretched S-DNA coexist, as also indicated by a non-uniform deformation of the DNA backbone [Fig 4(d)]. An independent 10-ns MD simulation restarted from a metastable state revealed a stable coexistence of B- and S-DNA domains when the DNA length Lz was kept constant. The tensile force in that simulation was constant and lower than the yield force. The coexistence of the Band S-DNA states, observed for the first time in our simulations, was postulated in previous theoretical models of DNA deformation [2, 26]. In the overstretched conformation [Fig. 4(c)], most of the bps are broken. Large fluctuations of in this regime reflect a variation of the local DNA structure. The small value of at n = 5 is due to the locally overwound DNA (the angle between consecutive bases in the same strand is ∼150°), while the large value of at n = 14 corresponds to a “bubble” (the angle is ≤20°) of broken bps [Fig. 4(c)]. The convergence of the three force-extension curves in the overstretched region [Fig. 3(a)] indicates that the tensile force in this region is likely borne by DNA backbone only.
It has been established that a force-extension curve of a long DNA fragment such as λ-DNA exhibits an overstretching plateau at a tension of about 70 pN and that the tension slightly increases in the plateau region [2, 21]. In our simulations, the DNA molecules were torsionally restrained via the periodic boundary condition. Under similar conditions, experiment has shown a significantly higher yield force of about 110 pN [8], which is close to the yield force of sequence C [Fig. 3(a)]. Allowing DNA to unwind in our simulations was observed to greatly reduce the yield force. Figure 3(b) shows the force-extension curves of DNA molecules that have a nick in one of their strands. As such nicked DNA unwinds, its tertiary structure continuously transforms from the B-DNA to ladder-like structure. Such a continuous transformation of the tertiary structure does not require the hydrogen bonds between the two strands to break; the strain softening effect is abolished, which is consistent with experiments on stretching DNA of homogeneous sequences without applying torsional restraints [22].
Even under torsional constraints, experiments using λ-DNA revealed a force-extension plateau [8], i.e., no strain softening effect. We believe that this apparent discrepancy is due to the highly heterogeneous sequence of λ-DNA. Our simulations have demonstrated a strong dependence of the yield force on the DNA sequence. Hence, the B to S transition in dsDNA of a heterogeneous sequence would start with the DNA fragments characterized by the lowest yield force. The initial metastable growth of the S-DNA domains that could be accompanied by strain-softening would be limited to the domains of DNA sequence having similar yield forces. Driving the domain boundary towards B-DNA domains would require a higher stretching force that could also nucleate S-DNA domains elsewhere. Overall, the force-extension dependence appears as the “B–S” plateau.
To provide a theoretical model for the above description, we treat the microscopic process of the B to S transition as the motion of a magnetic domain driven by an external magnetic field in the Ising model [26]. As the yield force was found to be sequence dependent, we considered a mean field model similar to the random field Ising model [27]. The hamiltonian H = −J Σi(lili−1 + lili+1) + Σi(f − fi)li with li = 0.5(LS + LB) − Li, where the length of a DNA fragment (e.g. one helical turn) Li equals LB or LS for B- or S-DNA conformation, respectively. The coupling term −J Σi(lili−1 + lili+1) describes the interaction between neighboring DNA fragments. The condition of J > 0 is consistent with our MD results: at the same tensile force, the DNA conformation is stable when the two neighboring DNA fragments are in the B-DNA state [Fig. 4a] but unstable when one of them is stretched [Fig. 4b]. The yield force of the i-th fragment fi is analogous to the random local field in the Ising model. We define fi = f0 + f′ρi, where ρi is a random number between -1 and 1. The hamiltonian can be rewritten as H = − Σi liFi, where the effective local field Fi = J(li−1 + li+1) − f + fi. In the case of a homogeneous DNA sequence, ρi (= ρ) is a constant and the yield force of the whole DNA fy = J(LS − LB) + f0 + f′ρ. Here, fy is the force to nucleate an S-DNA domain. The required force to drive the domain walls, however, can be as low as f0 + f′ρ, consistent with the strain softening effect. For a heterogeneous DNA sequence, this model predicts that the “hysteresis” (or strain softening) effect is reduced or even eliminated when the sequence is random. This phenomenon was investigated in detail for the hysteresis loop of magnetization [27].
To test our theory, we performed simulations of torsionally constrained DNA having the following heterogeneous sequence: poly(dA10dC11)·poly(dT10dG11). In the middle of the overstretching plateau [Fig. 3(b)], we observed a stable (over 35 ns) state in which only the poly(dC11)·poly(dG11) fragment was overstretched. A force higher than the yield force of the dC11 fragment was required to induce stretching of the dA10 fragment. Hence, strain softening was not observed. Note that sequence B is also heterogeneous. However, the CGCG segment of sequence B could not maintain the B-DNA structure after neighboring ATATAT segments became overstretched. Hence, strain softening was observed.
In conclusion, we investigated the B to S transition in stretched dsDNA using an anisotropic pressure control method. Our simulations suggest that the force-extension dependence of a torsionally constrained DNA molecule can exhibit a strain softening effect if no stable coexistence of B-DNA and S-DNA domains is possible at a tensile force higher than the yield force. We expect such behavior to emerge when stretching torsionally constrained simple repeat DNA sequences that are abundant in mammalian genomes [28]. The strain softening effect can be exploited in DNA nanotechnology to construct a mechanical “all or nothing” switch that unravels a torsionally constrained DNA helix when the tensile force exceeds a certain value. Physically, the strain softening effect is similar to the hysteresis effect in the first-order phase transition. Removing torsional restrains eliminates the strain softening effect, as in that case the DNA structure can continuously transform from B-DNA to S-DNA state through unwinding. Although the strain softening effect has not been experimentally observed in DNA, we believe such observations are possible using current experimental methods [8, 22].
Acknowledgments
The authors acknowledge useful discussions with Nigel Goldenfeld. Supercomputer time was provided via Large Resources Allocation Committee grant MCA05S028. This work was supported by grants from the National Institutes of Health (R01-HG003713 & PHS 5 P41-RR05969).
References
- 1.Smith SB, et al. Science. 1996;271:795. doi: 10.1126/science.271.5250.795. [DOI] [PubMed] [Google Scholar]
- 2.Cluzel P, et al. Science. 1996;271:792. doi: 10.1126/science.271.5250.792. [DOI] [PubMed] [Google Scholar]
- 3.Marko JF. Phys Rev E. 1998;57:2134. [Google Scholar]
- 4.Bockelmann U. Curr Op Struct Biol. 2004;14:368. doi: 10.1016/j.sbi.2004.03.016. [DOI] [PubMed] [Google Scholar]
- 5.Harris SA. Contemp Phys. 2004;45:11. [Google Scholar]
- 6.Konrad M, et al. J Am Chem Soc. 1996;118:10989. [Google Scholar]
- 7.Rouzina I, et al. Biophys J. 2001;80:882. doi: 10.1016/S0006-3495(01)76067-5. [DOI] [PMC free article] [PubMed] [Google Scholar]
- 8.Léger JF, et al. Phys Rev Lett. 1999;83:1066. [Google Scholar]
- 9.Ponomarev S, et al. Proc Natl Acad Sci USA. 2004;101:14771. doi: 10.1073/pnas.0406435101. [DOI] [PMC free article] [PubMed] [Google Scholar]
- 10.Feig M, Pettitt BM. Biophys J. 1998;75:134. doi: 10.1016/S0006-3495(98)77501-0. [DOI] [PMC free article] [PubMed] [Google Scholar]
- 11.Harris SA, et al. Biophys J. 2005;88:1684. doi: 10.1529/biophysj.104.046912. [DOI] [PMC free article] [PubMed] [Google Scholar]
- 12.Peck LJ, Wang JC. Nature. 1981;292:375. doi: 10.1038/292375a0. [DOI] [PubMed] [Google Scholar]
- 13.Yuan H, et al. Biochemistry. 1992;31:8009. [PubMed] [Google Scholar]
- 14.Martyna GJ, et al. J Chem Phys. 1994;101:4177. [Google Scholar]
- 15.Phillips JC, et al. J Comp Chem. 2005;26:1781. doi: 10.1002/jcc.20289. [DOI] [PMC free article] [PubMed] [Google Scholar]
- 16.Cornell WD, et al. J Am Chem Soc. 1995;117:5179. [Google Scholar]
- 17.Jorgensen WL, et al. J Chem Phys. 1983;79:926. [Google Scholar]
- 18.Beglov D, Roux B. J Chem Phys. 1994;100:9050. [Google Scholar]
- 19.Batcho PF, et al. J Chem Phys. 2001;115:4003. [Google Scholar]
- 20.Allen MP, Tildesley DJ. Computer Simulation of Liquids. Oxford University Press; New York: 1987. [Google Scholar]
- 21.Bustamante C, et al. Nature. 2003;421:423. doi: 10.1038/nature01405. [DOI] [PubMed] [Google Scholar]
- 22.Rief M, et al. Nature Struct Biol. 1999;6:346. doi: 10.1038/7582. [DOI] [PubMed] [Google Scholar]
- 23.Clausen-Schaumann H, et al. Biophys J. 2000;78:1997. doi: 10.1016/S0006-3495(00)76747-6. [DOI] [PMC free article] [PubMed] [Google Scholar]
- 24.Lankas˘ F, et al. J Mol Biol. 2000;299:695. doi: 10.1006/jmbi.2000.3781. [DOI] [PubMed] [Google Scholar]
- 25.Perez A, et al. Biophys J. 2007;92:3817. doi: 10.1529/biophysj.106.097782. [DOI] [PMC free article] [PubMed] [Google Scholar]
- 26.Hill T. J Chem Phys. 1958;30:383. [Google Scholar]
- 27.Ji H, Robbins MO. Phys Rev B. 1992;46:14519. doi: 10.1103/physrevb.46.14519. [DOI] [PubMed] [Google Scholar]
- 28.Subramanian S, et al. Bioinformatics. 2003;19:549. doi: 10.1093/bioinformatics/btg029. [DOI] [PubMed] [Google Scholar]