Abstract
NGR peptides have been designed as vehicles for the delivery of chemotherapeutics, magnetic resonance imaging (MRI) contrast agents, and fluorescence labels to tumor cells, and cardiac angiogenic tissue. Specificity is derived via an interaction with APN, also known as CD13, a cell surface receptor that is highly expressed in angiogenic tissue. Peptides containing the CNGRC homing sequence tethered to a pro-apoptotic peptide sequence have the ability to specifically induce apoptosis in tumor cells. We have now identified a modification to the Asn-Gly-Arg (NGR) homing sequence motif that improves overall binding affinity to Aminopeptidase N (APN). Through the addition of a proline residue, the new peptide with sequence, CPNGRC, inhibits APN proteolytic activity with an IC50 of 10 μM, a value that is 30-fold lower than that for CNGRC. Both peptides are cyclized via a disulfide bridge between cysteines. Steady-state kinetic experiments suggest that efficient APN inhibition is achieved through the highly cooperative binding of two molecules of CPNGRC. We have used NMR-derived structural constraints for the elucidation of the solution structures CNGRC and CPNGRC. Resulting structures of CNGRC and CPNGRC have significant differences in the backbone torsion angles, which may contribute to the enhanced binding affinity and demonstrated enzyme inhibition by CPNGRC.
Aminopeptidase N (APN), also known as CD13, is a cell surface receptor expressed in endothelial cells and is involved in angiogenesis of tumors. A small cyclic peptide (CNGRC) has previously been identified to have tumor homing properties (1) and binding affinity to APN(2). This CNGRC peptide has been exploited as a vehicle for tumor cell homing with applications toward cancer cell imaging (3), the design of potential anti-tumor therapeutics (1, 4-9) and magnetic resonance imaging of cardiac angiogenesis (10). When conjugated to a pro-apoptotic amino acid sequence (klaklak)2 via a glycinyl glycine linker, the peptide induces apoptosis selectively in cells expressing APN (11). Attachment of the CNGRC peptide to tumor necrosis factor (TNF) increases its anti-tumor activity more than ten-fold (4, 6). The growing body of work exploiting the NGR peptide motif for tissue delivery suggests that identification of new peptides with higher affinity to APN would be of significant value.
Originally reported as a ligand for αvβ3 integrin (12, 13), more recent reports have identified the ligand for this integrin to be a deamidated and isomerized form of the peptide CDisoGRC, where Diso is β aspartic acid (14, 15). This rearrangement occurs spontaneously at elevated pH and temperature. Quantitative assessment of binding by CNGRC to APN has not been carried out and analysis of published experiments in vivo has been complicated by this discovery (16, 17).
APN is a large transmembrane receptor expressed in elevated levels in myeloid cells, epithelia, and tumor-associated blood vessels (18). APN has also been implicated in tumor progression of thyroid carcinoma (19). A soluble form has been isolated from human serum (20, 21). APN has aminopeptidase activity, and has been identified in the processing of hormonal peptides including conversion of kallidin into bradykinin (22). Bradykinin is an inhibitor of APN aminopeptidase activity because it has a proline in the second position. Many aminopeptidases are inactive at proteolyzing peptides with proline adjacent to the amino terminal amino acid.
The location of the CNGRC interaction with APN has not been previously identified and structural details for this protein are lacking. Sequence analysis of full length 150 kD APN suggest seven putative domains (23) including a small intracellular tail (domain I) and a single transmembrane sequence (domain II). Papain treatment of rat intestinal APN yields a soluble form of the enzyme containing domains III –VII.
Rational design of new peptides and small molecules that bind selectively to APN with higher affinity is challenged by the absence of structural details of the protein but has potential to advance efforts to target tumor cells for chemotherapeutic and imaging purposes. In this work, we report a proline-containing variant of the CNGRC peptide that has increased affinity for APN, as evidenced by enzyme inhibition studies. Initially, the proline was introduced into the peptide to prevent potential amino terminal proteolytic processing by APN. CPNGRC demonstrates a 30-fold increase in potency for inhibition of APN activity over CNGRC. Higher affinity is achieved through the cooperative binding of two inhibitor peptides to APN. Elucidation of the three dimensional structures of CNGRC and CPNGRC in solution by NMR spectroscopy highlight some important differences that may be associated with the observed differences in affinity.
Methods and Materials
Materials
CPNGRC, CPNGRC-GG-(klaklak)2, and CNGRC peptides in purified form with intramolecular disulfide bridging were purchased from Anaspec Inc (San Jose, CA) and Biopeptide Company, LLC (San Diego, CA). Lower case letters indicate amino acids with D-stereochemical configuration. Amino acid analysis was carried out for the purpose of obtaining accurate concentrations for the inhibition and toxicity studies. For NMR studies, peptide samples were suspended in 10% D2O/90% H2O with pH 4.5 and concentrations 5 mM and 15 mM for CPNGRC and CNGRC peptides, respectively. L-Leucine-p-nitroanilide (pLeuNA) was purchased from Sigma–Aldrich (St. Louis, MO). Aminopeptidase N (APN) isolated from rat renal brush-border membranes and treated with papain to solubilize the extracellular domains was purchased from EMD Biosciences (San Diego, CA) and used without further purification.
Inhibition of Aminopeptidase activity
Inhibition of the aminopeptidase activity of APN by the CNGRC and CPNGRC peptides was examined by spectrophotometric assay using L-Leucine-p-nitroanilide (pLeuNA) as substrate (24-26). The formation of p-nitroaniline product was monitored continuously for two minutes at 405 nm using a Jasco V-570 UV/VIS/NIR or Uvikon XS spectrophotometer at 25°C. Initial rates were calculated from the slopes of the first minute of the reaction, using an extinction coefficient of 10,800 M-1cm-1. For the initial studies, APN was preincubated with CNGRC, CPNGRC, bestatin or buffer (control), and activity was measured after 5 and 10 minutes of incubation. Incubation mixtures contained HEPES buffer (50 mM, pH 7.8), Aminopeptidase N (3 nM), and the respective inhibitors (50 μM). After each 5 and 10 minute incubation period the assay was initiated with the addition of pLeuNA (2 mM final concentration) and monitored for 2 minutes per sample.
Subsequent to initial studies at a single peptide concentration, activity assays were performed at increasing concentrations of CPNGRC or CNGRC at a fixed pLeuNA concentration (2 mM) to obtain apparent IC50's for the inhibitors. Assays were run in 50 mM Tris, pH 8.0 with 3 nM APN at room temperature. The concentration of CNGRC and CPNGRC ranged from 27 μM to 545 μM and 5 μM to 98 μM, respectively.
Steady-State Kinetic Analyses of Inhibition
For inhibition experiments with CPNGRC, steady-state assays were carried out in 20 mM Tris pH 8.0 using increasing concentrations of pLeuNA (0.1-3 mM), at fixed concentrations of CPNGRC ranging from 0 to 22 μM. Enzyme assays were initiated with the addition of APN, rather than preincubation with peptide, as was done in the screening experiments. The enzymatic activity of APN is intolerant to freeze:thaw cycles and activity decreases over time at room temperature. For initial velocity studies large quantities of APN purchased from a single lot were combined, aliquoted into quantities for a single substrate series and stored at -70°C. APN was thawed and consumed in a single use. All of the data presented and analyzed here were acquired in a single sitting, and are largely single data points at each concentration of pLeuNA and peptide. Entire series were repeated at two concentrations of CPNGRC on a separate day with similar results. Steady-state kinetic experiments were additionally performed with the homing apoptotic peptide, CPNGRC-GG-klaklak2.
Plots of initial velocity were expressed in Lineweaver-Burk format to identify the mode of inhibition and analyzed using Kaleidagraph (Synergy Software, Reading, PA). Steady-state kinetic data using CPNGRC-GG-klaklak2 were fit to equation (1) for competitive inhibition,
| (1) |
where νo is the initial rate of product formation, [S] and [I] are the concentrations of pLeuNA and peptide, respectively. Ki is the dissociation constant for the inhibitor. Inhibition data using CPNGRC were initially fit to equation (2) for mixed inhibition,
| (2) |
where, Ki and Ki′ are the dissociation constants for CPNGRC in the absence and presence of substrate. Vmax and Km are the Michaelis values in the absence of inhibitor. The intercepts and slopes from the double reciprocal plots using CPNGRC were non linear and were best fit to the parabolic equations (3) and (4)
| (3) |
| (4) |
where A, B, C and D are coefficients. In these equations, kcat is the rate constant for the conversion of the ES complex to enzyme and product.
Analytical Ultracentrifugation
Sedimentation equilibrium experiments were performed in ProteomeLab XL-I (Beckman Coulter) analytical ultracentrifuge. Protein samples in 25 mM Tris (pH 7.5), 100 mM NaCl at concentrations 0.5, 0.167 and 0.056 mg/ml were loaded in 6-channel equilibrium cells and spun in An-50 Ti 8-place rotor at 8,000 and 10,000 rpm, at 20°C for 24 hrs at each speed. Data were analyzed using HeteroAnalysis software (by J.L. Cole and J.W. Lary, University of Connecticut). The best fit of the sedimentation equilibrium data was achieved using a monomer-dimer equilibrium model.
Detection of Isoaspartic Acid
The Isoquant kit for the specific detection of isoaspartic acid (Promega Corporation) was employed for the identification of the inactivating modification of the CPNGRC peptide. The assay was performed according to manufacturer instructions. One sample of CPNGRC peptide was incubated at 37°C at pH 8.5 overnight, while an additional CPNGRC solution was maintained on ice at pH 7.5 for the same period of time. Each peptide solution was in 50 mM Tris buffer. From these 40 μM peptide stock solutions, 10 μl was combined with the 40 μl of the described assay solution including S-adenosylmethionine (SAM), Protein Isoaspartyl Methyltransferase (PIMT) and reaction buffer for the methyl transfer reaction. The final reaction solutions included 8 μM peptide, 20 μM SAM, PIMT, 100 mM sodium phosphate, pH 6.8, 1 mM EGTA, 0.004% sodium azide and 0.16% triton X-100. The reaction mixture was incubated for 30 minutes at 30°C and then quenched with 10 μl of the 0.3 M phosphoric acid quencher solution. A buffer negative control and an isoaspartic acid peptide positive control (sequence DisoSIP) were run in parallel. The resulting mixtures were analyzed by reverse phase HPLC using a Waters Symmetry C18 5 μm column (4.6 × 150 mm). The manufacturer recommended buffers and gradient profile were employed. The column was equilibrated in 90% mobile phase A (50 mM potassium phosphate pH 6.2) and 10% mobile phase B (100% methanol) with a flow rate of 1 ml/min. After sample injection, a gradient increasing to 30% mobile phase B was executed over 5 minutes. SAH eluted from the column at 4.05 minutes (and milliliters).
NMR data collection
Unless otherwise stated, NMR spectra were recorded on a Varian Inova 500 MHz NMR spectrometer (Varian Incorporated, Palo Alto, CA) equipped with gradients, three radio frequency channels, extended range variable temperature controller, pre-conditioning unit and PFG Penta probe at 10°C. Pulse sequences from the BioPack library of experiments were employed. Water suppression was achieved with WATERGATE(27, 28). For the purpose of 1H assignment, TOCSY spectra(29) were acquired with 60 ms mixing time and ROESY spectra(30) were recorded. Intermolecular distance constraints were obtained from ROESY data acquired with mixing times ranging from 50 ms to 400 ms. High resolution DQF COSY data was collected for the measurement of JHNHα. E. COSY data were collected on a Bruker, Avance 500 MHz NMR on CPNGRC and CNGRC samples in D2O. TOCSY buildup curves with 10 ms, 20 ms, 30 ms and 40 ms mixing times were then also carried out on the Inova for verification of 3JHαHβ and 3J HNHα coupling constants measured in E.COSY and DQF COSY spectra(31). 1H-13C HSQC natural abundance spectra were acquired with sensitivity enhancement for assignment of proton-attached carbon resonances. 1H-13C HMBC experiments were acquired for the purpose of assigning backbone and sidechain carbonyl 13C resonances. HMBC spectra were also acquired on CPNGRC samples with buffer pH values of 2.5, 3.7, 4.2, 4.9, 5.4 and 5.7. Assignments were made using Sparky (Goddard, UCSF).
Structure calculations
Non-glycine 3JHα-HN coupling constants were measured from 1H 1D NMR spectra of the CNGRC peptide. For CPNGRC 3JHα-HN coupling constants were measured from DQF COSY experiments. Glycine pro-chiral protons were assigned based on coupling constants measured from high resolution DQF COSY spectra, TOCSY buildup curves and intermolecular distances obtained from ROESY data. ROESY crosspeak intensities were measured, normalized to the number of hydrogens involved in the crosspeak and then grouped into strong (3.5 Å), medium (4.0 Å) and weak (5.0 Å) categories. Lower bounds for distance restraints were set to the sum of the van der Waal's radii. An additional 1.0 Angstrom per hydrogen was added to the distance upper bound for pseudoatom restraints. For the generation of model structures, NMR-derived distance and dihedral constraints were incorporated into a simulated annealing protocol, using internal coordinates dynamics in XPLOR-NIH (32, 33). NOE restraints were initially set to 20 kcal mol-1 Å-2 force constant and ramped to 100 kcal mol-1 Å-2 over the course of the annealing. Restraints for Φ dihedrals were set using the Xplor class phi, directly from 3JHα-HN with 0.5 Hz tolerance and employed with a 400 kcal mol-1 rad-2 force constant. Additional dihedral restraints were assigned using modified Karplus relation (34) with 40 degree tolerance on the angle with a 400 kcal mol-1 rad-2 force constant.
Results
Proline Enhances Peptide Inhibitor Binding to APN
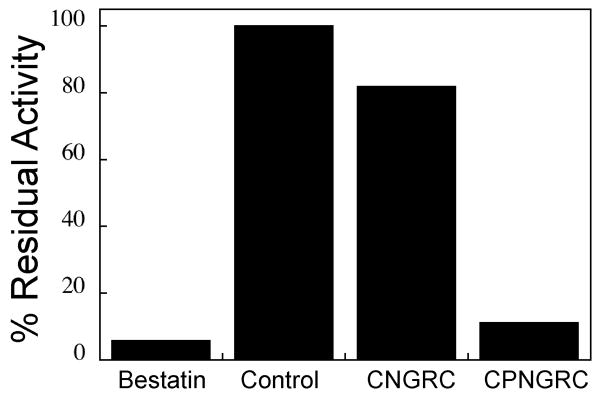
Initial screens for inhibition of APN activity by the peptides were carried out at a single substrate concentration and a single peptide concentration (Figure 1A). Bestatin, a highly potent but nonspecific protease inhibitor with slow binding nanomolar affinity for APN from Aeromonas proteolytica (35), was used as a control for inhibition. At 50 μM concentration, CNGRC inhibition of APN activity was relatively weak with about 82% residual activity relative to the uninhibited control. However, peptides containing proline at the second position of the peptide display a substantial increase of inhibitory potency at the same concentration. Enzyme activity of the APN can decrease under assay conditions over five and ten minute time frame for these assays even in the absence of bestatin or peptide. At each time point, the activity of CPNGRC relative to the control is approximately 11%, with greater residual activity than the bestatin inhibited APN but less than the CNGRC peptide. There was no evidence of the slow binding inhibition demonstrated by bestatin for cytosolic aminopeptidase from Aeromonas proteolytica where the equilibrium condition for binding is not established for hours (35).
Figure 1.
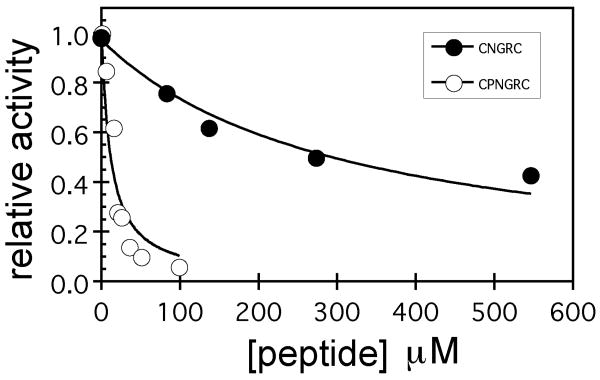
(A) Hydrolysis of 2 mM pLeuNA as catalyzed by APN in the presence of bestatin, CNGRC and CPNGRC. The assay of activity was initiated with substrate after a 10 minute preincubation of enzyme and inhibitor. (B) Relative activity of APN in the presence of CNGRC (λ) or CPNGRC (○). Activity was quantified by the rate of hydrolysis of 0.20 mM pLeuNA at room temperature in the presence of increasing quantities of peptide.
To gain insight into the apparent affinities of the inhibitors, activity assays were performed using varying CNGRC or CPNGRC concentrations ranging from 5 to 550 μM (Figure 1B). CPNGRC inhibits the APN-catalyzed hydrolysis of 0.20 mM pLeuNA at significantly lower concentrations than CNGRC. The IC50 values observed for CPNGRC and CNGRC are approximately 10 μM and 300 μM, respectively. The illustrated curve-fitting assumes a single peptide binding site. A better fit of the CPNGRC data is described later (see Discussion and Figure 12). CPNGRC inhibits hydrolysis of pLeuNA to near background levels, indicating that APN saturated with CPNGRC has near zero activity. Higher concentrations of peptide are necessary to characterize the full inhibitory potency of CNGRC. Nonetheless, our measured binding affinity of CNGRC is in the range demonstrated by antibody competition experiments (4). In other reported experiments, treatment of KS1767 and MDA-MB-435 cells expressing APN resulted in LC50 values ranging from 40 μM to 400 μM.
Figure 12.
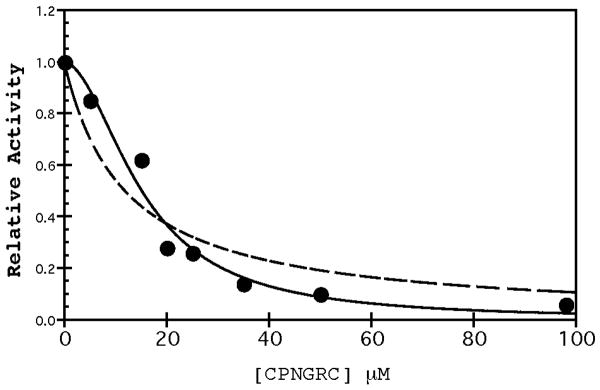
Sigmoidal dose-response curve for CPNGRC. The velocity data from Figure 1B in the presence of CPNGRC was fit using a simple mixed inhibition (dotted line) or equation 5 (solid line) for the two site binding model. The R value for the simple mixed curve fitting is 0.950; whereas, the fitting
APN Inhibition by CPNGRC and CPNGRC-GG-klaklak2
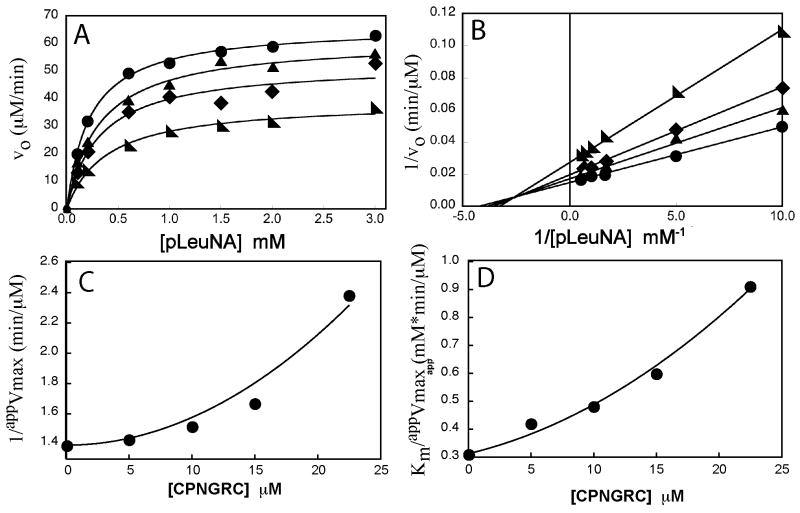
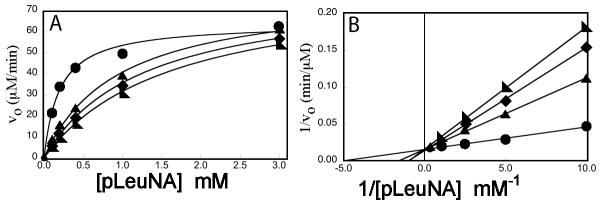
Detailed analysis of the inhibitory activity of CPNGRC was carried out using steady-state kinetic methods. Plots of initial velocity versus pLeuNA concentration are hyperbolic (Figure 2A) and demonstrate that the inhibitor lowers Vmax suggesting that it can bind to APN in the presence of the substrate. Double reciprocal plots of these data suggest that CPNGRC is a mixed-type inhibitor (Figure 2B) capable of impacting both Vmax and Km. Inhibitors of this type are often referred to as linear inhibitors if replots of both the intercept (1/Vmax) and slope (Km/Vmax) terms vary linearly as a function of inhibitor concentration. Interestingly, both the slope and intercept terms vary in a parabolic rather than a traditional linear fashion with CPNGRC concentration (Figure 2 C,D). This mode of inhibition is consistent with the binding of two inhibitor molecules to APN (see Discussion).
Figure 2.
Steady-state kinetic profile for APN in the presence of CPNGRC. Panels A and B illustrate velocity and double reciprocal plots of the same experimental data for CPNGRC. The concentrations of CPNGRC are 0 μM (λ), 10 μM (σ), 15 μM (ν), and 23 μM (◣). Panels C and D are replots of the intercepts (1/Vmax) and slopes (Km/Vmax), respectively, obtained from the double reciprocal plots (panel B) exhibiting a quadratic dependence on the inhibitor concentration.
Steady-state kinetic experiments were then performed using CPNGRC-GG-(klaklak)2 to determine whether a similar inhibitor binding mode is observed for this longer peptide. As shown in Figure 3A and 3B, CPNGRC-GG-(klaklak)2 did not impact Vmax suggesting that this peptide does not bind to APN in the presence of substrate, a hallmark of classic competitive inhibition. In separate experiments we showed that increasing concentrations of CPNGRC-GG-(klaklak)2 inhibited APN activity to near background velocities suggesting that the inhibitor is not a partial competitive inhibitor. The Ki calculated from fits of both the double reciprocal plots and substrate plots are 7 ± 3 μM, a value close to the IC50 for CPNGRC (Fig.1B). Because the value of Ki for CPNGRC-GG-klaklak2 is quite low in comparison to the weaker inhibition of APN by CNGRC (Figure 1), the expectation is that the CPNGRC variant of the pro-apoptotic peptide would be more potent.
Figure 3.
Steady-state kinetic profile for APN in the presence of CPNGRC-GG-(klaklak)2. Panels A and B illustrate data obtained with CPNGRC-GG-klaklak2 in velocity and double reciprocal format. The concentrations of CPNGRC-GG-klaklak2 are 0 μM (λ), 10 μM (σ), 20μM (ν) and 50 μM (◣).
Oligomeric state of APN
Because the double-reciprocal plots of the CPNGRC peptide suggested mixed inhibition, which can be consistent with allosteric effects across oligomers, we performed analytical ultracentrifugation (AUC) to identify the oligomeric state of the APN under the assay conditions. Dimer formation by APN has been observed in the intestinal epithelial membrane associated form in pig, rat, rabbit, and human(36-38). The results showed that APN is monomeric at the concentrations for the kinetic assays but is in equilibrium with a dimeric form. Analysis of experiments at three concentrations of APN revealed anequilibrium dissociation constant, KD, of 1.6 μM. With the enzyme concentration in the assays at 3 nM, less than 0.4% of APN would be in the dimeric state, which rules out inter-subunit allosteric mechanisms for inhibition. AUC experiments were repeated in the presence of CPNGRC with no change on the monomer-dimer equilibrium.
Active CPNGRC was not deamidated
The CNGRC peptide has been shown to undergo deamidation at asparagine at elevated temperatures and pH above 8 to form isoaspartate (Diso). The resulting CDisoGRC peptide has a higher affinity for αvβ3 integrins than CNGRC (14, 15). To minimize any potential deamidation in the biochemical and NMR samples, assay solutions of CPNGRC were stored at neutral pH and kept on ice prior to the kinetic assays. NMR studies were carried out with samples at lower pH and at 10°C. Mass spectral analysis of CPNGRC is expected to show a change of one atomic mass unit upon deamidation. Given this very subtle change in mass, we verified that the CPNGRC peptide in our studies is not deamidated using NMR pH titration studies. 1H-13C HMBC experiments were recorded at pH ranging between 2.0 and 5.4. The sidechain carbonyl resonance for asparagine did not undergo any changes in chemical shift over this pH range, as would be expected for an aspartic acid upon deprotonation. Thus we conclude that the inhibitory peptide does not contain aspartic acid or isoaspartic acid.
APN is not Inhibited by CPDisoGRC
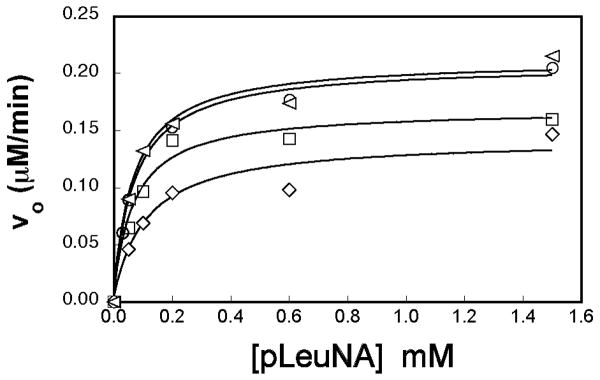
Similar to CNGRC, changes in pH affect the stability of the CPNGRC peptide. At pH's higher than 8.0, loss of CPNGRC inhibitory potency was observed in a time-dependent fashion. Deamidation of NGR peptides at elevated pH and temperature has been described previously (14, 15), and demonstrated to lead to an increase in binding affinity for αvβ3 integrin. Here, we have also observed a pH and temperature dependent deamidation of CPNGRC, which corresponds to a decrease in APN inhibition and binding affinity (Figure 4). Inhibition studies were carried out in the presence of CPNGRC at pH 7.5 and at pH 8.5. The peptide at pH 8.5 was incubated at 37°C for 2 hours and 24 hours, then checked for the ability to inhibit APN. After 2 hours, a significant decrease in inhibitory potency is observed. After 24 hour incubation, the peptide no longer inhibits APN hydrolysis of pLeuNA at the 50 μM concentrations of peptide that were used in these studies.
Figure 4.
Loss of inhibitory potency when CPNGRC is incubated at elevated temperatures and pH. CPNGRC was incubated at 37°C and pH 8.5 for 2 hours (□) and then 24 hours (◁). The resultant peptide was assayed for its ability to inhibit APN catalyzed hydrolysis of pLeuNA, relative to peptide kept at pH 7.5 and at 4°C (◇). After 24 hours, the peptide shows almost no inhibition when compared to activity assays in the absence of peptide (○). The concentration of CPNGRC was 50 μM concentration in these assays.
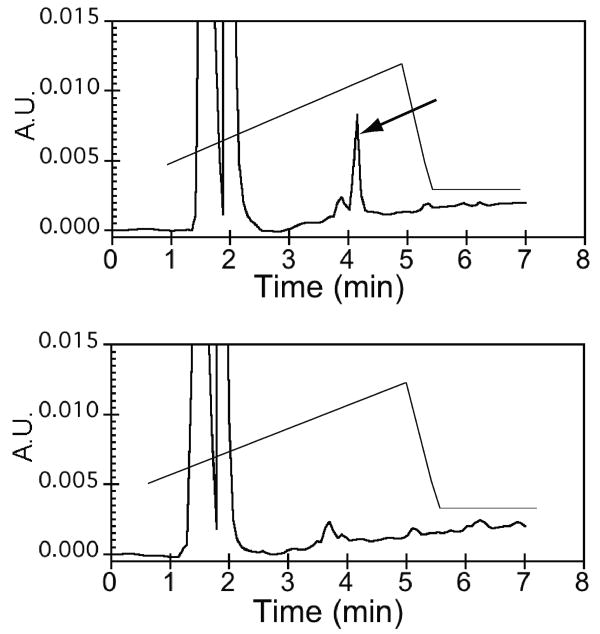
Detection of isoaspartic acid was carried out using the Isoquant kit. CPNGRC peptide was kept at pH 7.5 at 4°C or pH 8.5 overnight at 37°C. In the assay, PIMT specifically transfers a methyl group from S-adenosylmethionine (SAM) to isoaspartic acid. The detection of the product, S-adenyosyl-homocysteine (SAH), by reverse phase HPLC indicates the presence of isoaspartic acid in the peptide. Chromatograms of the pH 7.5 and pH 8.5 peptides are shown in Figure 5. The peak indicated by an arrow is the elution of SAH, indicating that under elevated pH and temperature, CPNGRC undergoes deamidation and isomerization to β aspartic acid.
Figure 5.
Detection of SAH indicates formation of Diso in CPDisoGRC. The chromatograms of assay solutions of CPNGRC peptide that were kept at pH 7.5 on ice (bottom) or pH 8.5 at 37°C overnight (top). In the top panel, an arrow indicates the elution of SAH, which is a product of the methyltransferase reaction with Diso.
Assignment of NMR resonances
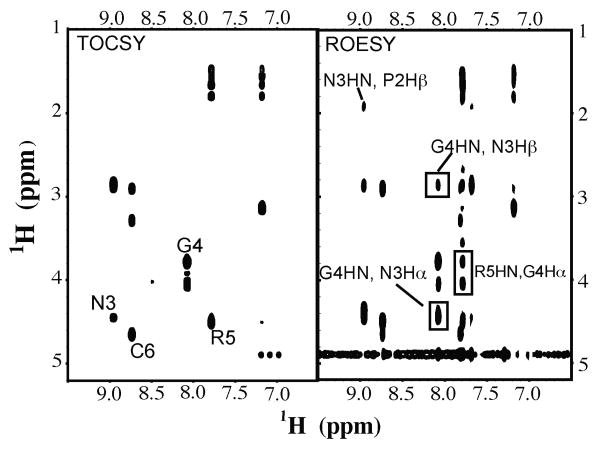
NMR structural analysis of the two homing sequences was carried out for the purpose of identifying key structural and dynamic features that may confer the increased potency of the CPNGRC peptide in binding to APN. Assignment of the 1H resonances were carried out with traditional homonuclear TOCSY and ROESY spectra of the peptides. Expanded regions of spectra for CPNGRC are shown with identified crosspeaks (Figure 6). Correlations from 1H-13C HSQC spectra were used to identify alpha and beta 13C chemical shifts (data not shown). 1H-13C HMBC spectra were then used to identify 13C resonances lacking an attached hydrogen. Tabulated chemical shifts are shown in Table 1. The high solubility of both peptides, small number of signals and fast tumbling times result in TOCSY data for peptides of similar signal/noise ratio and containing all expected peaks facilitating complete assignment of the peptides.
Figure 6.
Expanded regions amide proton, side chain regions of the TOCSY and ROESY NMR spectra of CPNGRC with a subset of peaks annotated. The data were collected at 500 MHz at 10°C.
Table 1. NMR Chemical shifts of CNGRC and CPNGRC.
| CNGRC | |||||||
|---|---|---|---|---|---|---|---|
| HN | C' | Cα(Hα) | Cβ(Hβ) | Cγ(Hγ) | Cδ (Hδ) | other | |
| C1 | 59.19 (4.11) | 48.20(3.14, 3.37) | |||||
| N2 | 8.94 | 55.50 (4.84) | 42.40 (2.69, 2.82) | ||||
| G3 | 8.71 | 48.79 (4.11, 3.63) | |||||
| R4 | 8.51 | 60.10 (4.25) | 33.53 (1.71,1.78) | 30.74 (1.58, 1.62) | 46.73 (3.15) | ||
| C5 | 8.41 | 59.26 (4.57) | 46.60 (2.97, 3.27) | ||||
| CPNGRC | |||||||
| HN | C' | Cα(Hα) | Cβ(Hβ) | Cγ(Hγ) | Cδ (Hδ) | other | |
| C1 | 169.7 | 54.79 (4.47) | 43.9 (2.68, 3.56) | ||||
| P2 | 177.1 | 64.44 (4.37) | 31.90 (1.89, 1.97) | 27.8 (2.09, 2.26) | 50.93 (3.58, 3.70) | ||
| N3 | 8.97 | 174.9 | 54.33 (4.46) | 38.56 (2.87) | 177.6 | ||
| G4 | 8.08 | 174.7 | 46.06 (3.79, 4.06) | ||||
| R5 | 7.79 | 175.3 | 55.39 (4.51) | 30.9 (1.67, 1.80) | 27.09 (1.48, 1.55) | 43.55 (3.13) | 159.7 (CZ) |
| C6 | 8.75 | 177.2 | 55.08 (4.66) | 41.6 (2.92, 3.30) | |||
NMR Distance Restraints
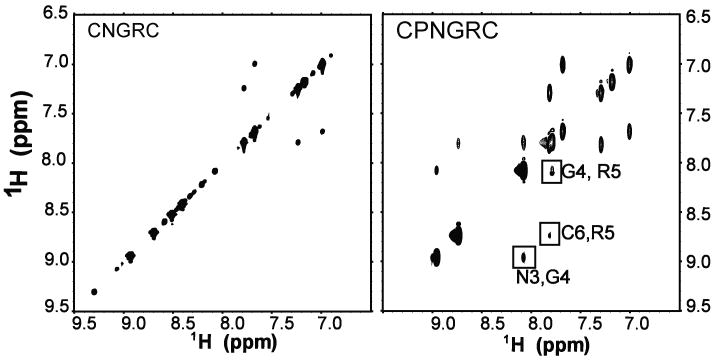
ROESY spectra were recorded at mixing times ranging from 50 ms to 400 ms for both CNGRC and CPNGRC. Crosspeaks from 200 ms mixing time ROESY spectra were tabulated for restraint input for structure calculations. ROESY peak heights and volumes were measured from 50 ms to 200 ms and then grouped into strong, medium and weak categories. Generally, the signal/noise ratio of crosspeaks in the ROESY spectra of CPNGRC was better than CNGRC, suggesting a less dynamic structure in solution. The region of the ROESY spectrum containing crosspeaks between amide and sidechain protons is shown in Figure 6. The amide regions of ROESY spectra for both CNGRC and CPNGRC are shown in Figure 7. Despite concentrations as high as 15 mM and long data collection times over the range of mixing times, no amide, amide connectivities (dNN) were observed in the CNGRC peptide. In contrast, all possible dNN crosspeaks are observed in the CPNGRC spectrum.
Figure 7.
Amide proton region of the ROESY spectra recorded for CNGRC and CPNGRC peptides. The absence of amide proton connections in the ROESY spectra of CNGRC probably reflect dynamics in the peptide, as the circular peptide cannot adopt an extended conformation.
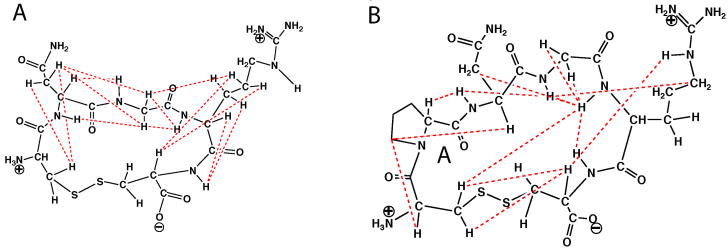
The structures of CNGRC and CPNGRC are significantly restrained to limited conformations by the disulfide bridging between the amino and carboxy terminus. Therefore, even a limited number of ROE distance restraints can significantly impact elucidation of the structure in solution. A subset of ROE crosspeaks are mapped onto the chemical structures of CNGRC and CPNGRC in Figure 8. In CNGRC, ROESY crosspeaks between a single Cys1 Hβ and both Asn2 Hβ atoms limits rotameric states of the χ1 dihedral angle for Cys1. Similarly, the amide proton of Asn2 has a crosspeak with one but not both Hα atoms for Gly3. In CPNGRC, ROE restraints between Pro2 Hδ protons and Cys1 Hα, and another crosspeak between Pro2 Hα and the Asn3 HN, indicate that Pro2 has a trans peptide bond. There was no evidence of cis-trans isomerization at the proline peptide bond. Additionally, a single Cys1 Hβ has an important cross ring constraint to Arg5 HN. A total of 19 and 21 distance restraints were tabulated for CNGRC and CPNGRC, respectively.
Figure 8.
Chemical structures of CNGRC and CPNGRC with dotted lines indicating selected observed crosspeaks in ROESY spectra.
Measurement of Coupling Constants
The proton linewidths and amide peak dispersion for CNGRC were such that non-glycine 3JHNHα could be measured from high resolution 1H 1D spectra. For CPNGRC, J-coupling splittings were never observed in the amide peaks in 1D spectra, so high resolution DQF COSY spectra were used for obtaining 3JHNHα couplings. The 3JHNHα coupling constants were of intermediate values, ranging from 6.6 Hz to 8.5 Hz in both peptides. Interestingly, in CNGRC Asn2 3JHNHα was 8.5 Hz and Arg4 6.7 Hz, which confirms a pattern reported by others(15). The relative magnitude of these two coupling constants are swapped in CPNGRC with Asn3 having 3JHNHα of 6.6 Hz and 8.4 Hz for Arg5, indicating some differences in the backbone dihedral angles between the two peptides. The carboxy terminal 3JHNHα in the peptides were 7.2 Hz and 7.7 Hz for CNGRC and CPNGRC, respectively. In CNGRC, the values for 3JHαHβ ranged from 4.0 Hz to 9.0 Hz. From the Karplus relation for 3JHαHβ with coefficients 9.5, -1.0 and 1.4, for A, B and C (34), respectively, only values above 8 Hz can be used to restrict χ1 to less than four rotameric states. Cys5 was the only residue with a significant difference between the two 3JHαHβ values, 4.0 Hz and 9.0 Hz. Therefore, a dihedral restraint limiting χ1 for Hβ1 to less than 20°±40° was incorporated into the simulated annealing calculations. For CPNGRC, there were three residues with 3JHαHβ values 10 Hz or greater with vicinal pairs of 5 Hz or less, Cys1, Asn3 and Cys6. In practice, dihedral restraints for χ1 of Cys1 and Cys6 were employed in structure calculations. Stereospecific assignments were initially based on preliminary structure calculations without dihedral restraints and distance restraints and adjusted iteratively against restraint violations and energies of resulting structures.
Structure calculations
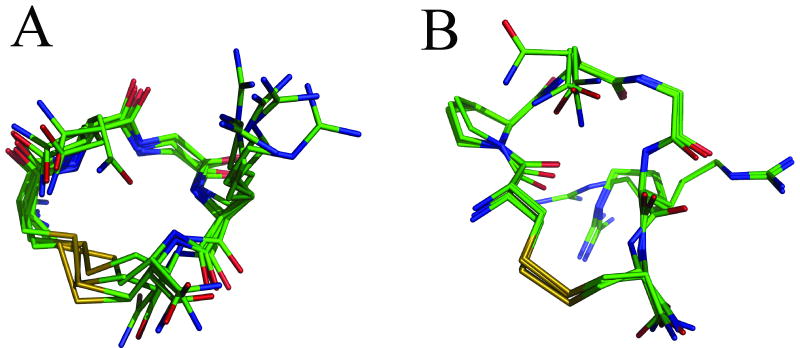
The structure calculations produced ensembles of structures for CNGRC and CPNGRC with relatively small deviation among heavy backbone atoms for each peptide (Figure 9). We examined the top ten lowest energy structures for each peptide and evaluated the rmsd for each ensemble. For visual clarity, only five structures are shown in Figure 9. In the CPNGRC family of ten structures, the backbone rmsd to a calculated mean structure is 0.50 Å. Including heavy side chain atoms, the rmsd is 1.7 Å. Among the five structures shown, the rmsd in the backbone is 0.26 Å and 1.1 Å among all heavy atoms. Differences among structures occurred primarily around the proline ring, which in some structures is rotated. The result is a displacement of 1.2 Å in Cγ of proline between the two most distant structures in the ensemble of ten. Ramachandran plots of all ten structures place Φ and Ψ in close proximity. In the CNGRC family of ten structures, the rmsd to a calculated average structure is 0.35 Å among backbone atoms and 1.0 Å among all heavy atoms. For the five structures shown, the rmsd is 0.35 Å and 1.0 Å among backbone and all heavy atoms, respectively. Generally, for both peptides the sidechains are less well-defined and probably do not adopt a single conformation in solution. The additional restriction of the proline residue in CPNGRC contributes to a smaller backbone rmsd among the five displayed structures than among calculated CNGRC structures. PROCHECK-NMR (39, 40) analysis of the resulting structures was performed to check the strain on backbone torsion angles. Ramachandran plots of the backbone torsions of CNGRC place all residues in allowable regions of Φ - Ψ space. However, plots for structures of CPNGRC show that glycine falls into an allowed region of phi-psi space but asparagine and arginine are clustered at the border between allowable regions and generously allowed regions. Given that the peptide contains a proline in a highly constrained ring, these torsions are probably acceptable.
Figure 9.
Families of 5 lowest energy structures of (A) CNGRC and (B)CPNGRC obtained from simulated annealing calculations with incorporated NMR restraints. The presence of the proline in CPNGRC forces the peptide backbone into a more elongated ring than in CNGRC.
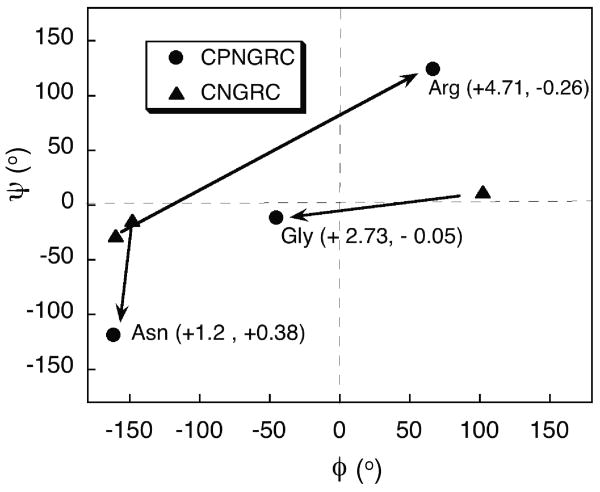
Comparison of the backbone torsion angles highlight significant differences between the calculated structures of CNGRC and CPNGRC. The asparagine Ψ value shifts significantly from -15° in CNGRC to -120° in CPNGRC. For glycine, the shift in Ψ is small; however Φ in CNGRC is 102° but -45° in CPNGRC. Finally, both Φ and Ψ for arginine change (Figure 10). Changes in the backbone conformation were suggested by both JHNHα and by the chemical shifts for Hα and Cα for these peptides. The chemical shifts changes for Cα and Hα are indicated in parentheses, respectively, in Figure 10. Earlier reports of molecular dynamics simulations of the CNGRC and related cyclic and linear peptides suggested that the preferred conformation for APN binding may be a β turn (7). We see no evidence of the hydrogen bonding and torsion angles of a β turn in our calculated structures for CPNGRC.
Figure 10.
Ramachandran plot of the APN recognition elements in CNGRC (σ) and CPNGRC (λ) indicating rather large changes in backbone torsion angles. In parentheses next to the CPNGRC points are the ppm changes in chemical shift (CNGRC vs. CPNGRC), observed for the alpha carbon and alpha proton resonances, respectively.
Discussion
Kinetic Model for Inhibition
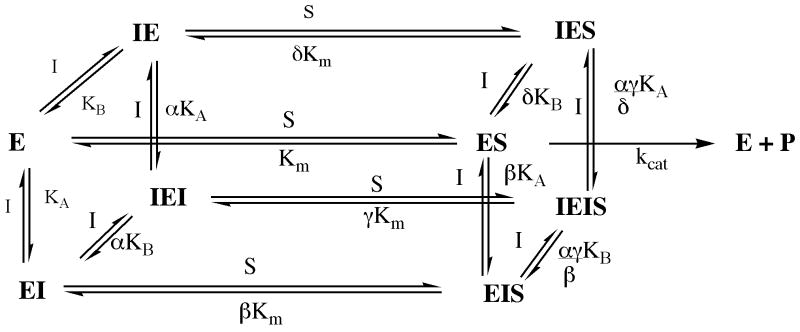
We have shown that the addition of a proline residue to the homing sequence CNGRC leads to a significant increase in apparent binding affinity to the target APN through a cooperative binding mechanism. Although double reciprocal plots suggest that CPNGRC is a traditional mixed-type inhibitor that binds outside the active site, examination of replot data suggest that two molecules of CPNGRC are essential for APN inhibition (Figure 2). To explain these kinetic phenomena we assembled the kinetic scheme shown in Figure 11, which takes into account the binding of two molecules of CPNGRC per APN. No assumptions are made about order of binding between the two CPNGRC sites, or interactions among substrate and CPNGRC binding sites. EI and IE are distinct species of APN in complex with CPNGRC at different locations. In this scheme, we assume that enzyme species bound with only one inhibitor molecule (IES and EIS) are not active. Using this model, the velocity expression shown in equation (5) can be derived
Figure 11.
Kinetic scheme for the inhibition of APN (E) by CPNGRC (I). IE and EI are distinct enzyme species with the inhibitor bound in 2 distinct sites.
| (5) |
where,
| (6) |
| (7) |
| (8) |
and
| (9) |
The best fits of the replot data using equations 3 and 4 (Figure 2C & 2D), are obtained with values of A ≤ 0.003 μM-1, B=0.0013 μM-2, C = 0.031 μM-1 and D=0.0024 μM-2. These parameter fits can now be used to evaluate the net binding constants for both inhibitors in the absence (1/D) and presence (1/B) of substrate. Using these parameters, we obtain values of 400 and 900 μM for αKAKB and αγKAKB in the kinetic scheme of Figure 11. These data indicate that the substrate antagonizes the binding of the inhibitors. Although we cannot directly evaluate the individual binding constants for each inhibitor molecule at each site, we can place limits on their values. For example, parameter C places a lower limit of 30 μM on the binding constant for the first inhibitor in the absence of substrate (KA or KB). Likewise, parameter A places a lower limit of 300 μM on the binding constant of the first inhibitor in the presence of substrate (βKA or δKB). The ratio of C and D places an upper limit of 13 μM on the binding constant for the second inhibitor in the absence of substrate (αKA or αKB). These data imply that in the absence of substrate the binding of the first inhibitor enhances the binding of the second by, at least, 2-fold. Likewise, the ratio of A and B places an upper limit of 2 μM on the binding affinity of the second inhibitor in the presence of substrate (αγKB/β or αγKA/δ). These data imply that in the presence of the substrate the binding of the first inhibitor enhances the binding of the second by, at least, 100-fold. Overall, although precise values are not available, the data fitting suggests that both inhibitors bind in a cooperative manner to fully inactivate APN.
Predicting Dose-Response Curves
The results derived from fitting the parabolic slope and intercept replots suggest that two inhibitors bind cooperatively to APN with the first enhancing the binding of the second. Such a mechanism should yield a sigmoidal dose-response curve toward total inhibitor concentration. As shown in Figure 12, this plot is, indeed, sigmoidal showing progressively more potent activity declines at higher inhibitor concentrations. This type of inhibition is not adequately described by classical single site inhibition for a non allosteric enzyme. To better simulate this activity-peptide response curve, we used the parameter fits from replot data and equation (5). We attained a good fit to the velocity data in Figure 12 using values of 0.003, 0.0013, 0.031 and 0.0045 for A, B, C, and D, respectively. While the values of A, B, and C are used directly from replot data, to obtain the best fit the value for D was raised by 80%. This deviation leads to a small increase of cooperativity for inhibitor binding in the absence of substrate. Rather than a minimum of a 2-fold enhancement in inhibitor binding, the new fitting indicates that the minimum enhancement is 4-fold. Despite this small discrepancy, the velocity plot in Figure 12 is consistent with the inhibitor binding mechanism in Figure 11 and adequately predicts the sigmoidal dependence and cooperative association of two inhibitors.
Potential Substrate-Inhibitor Interactions
At present, it is unknown how CPNGRC binds and inhibits APN. Although APN can form a dimer at concentrations far outside the assay conditions, the inability to alter this equilibrium by ligand binding in equilbrium sedimentation experiments suggests that CPNGRC does not contact the enzyme at the dimer interface. The cooperativity between the two inhibitor sites suggests that they could be near each other or reside at positions that are coupled over distance. APN recognizes the precursor decapeptide kallidin and converts it into the nonapeptide bradykinin. As a peptidase, APN possesses distinct subsites for this recognition. It is conceivable that CPNGRC could bind weakly to one of these subsites and illicit a conformational change that promotes binding to a second subsite. Whatever the mechanism, it is interesting that the binding of both inhibitors completely eliminates catalytic activity without excluding substrate binding. Based on the model in Figure 11, we can calculate the impact of the binding of both inhibitors on substrate affinity since the ratio of equations (9) and (7) provide a value for γ. By taking the ratio of D and B we can show that the inhibitors weaken the affinity of the substrate by about 2-3-fold. Such findings suggest that these sites are linked to the catalytic residues. For these kinetic studies we used a small substrate for APN that may permit mutual binding of inhibitor and substrate. Further substrate analyses are likely to provide more information on the mode of binding. Indeed, addition of the pro-apoptotic sequence to CPNGRC (CPNGRC-GG-klaklak2) leads to classic competitive-type inhibition suggesting that the longer inhibitor peptide may better displace the short substrate (Figure 3).
Conclusions
In summary, we have reported a new peptide inhibitor, CPNGRC, with increased affinity for APN, a membrane bound aminopeptidase, that is expressed on the surface of tumor cells and that has been associated with the spread of vasculature in tumor progression. We found that CPNGRC binds about 30-fold more tightly than CNGRC and appears to use an interesting cooperative binding mechanism. Whether the proline is the cause of this mechanism is not clear since we were not able to evaluate the binding mechanism of CNGRC owing to its weak affinity and difficulty in saturating APN. Thus, it is not apparent whether proline insertion allows for the binding of two inhibtor molecules to APN or whether the homing sequence alone possesses the necessary binding determinants for this inhibitory mode.
The NMR analyses suggest that the increased potency from proline insertion into the homing sequence may be the result of either bias toward a productive binding conformation in solution by CPNGRC or may be entropically driven by the loss of conformational freedom in solution, as a result of the proline backbone ring structure. The polar sidechain content of the NGR motif suggests that hydrogen bonding and electrostatics are important determinants for recognition by APN. The loss of inhibitory potency toward APN upon deamidation of CPNGRC, further suggests that the asparagine forms critical hydrogen bonds with the receptor. The insertion of a proline in the peptide creates significant changes in backbone torsion angles that may position sidechain hydrogen bond partners in better alignment with the receptor. Among the CNGRC family of structures the average distance between the two Cγ of Asn and Cζ of Arg is 7.3 Å (std dev 1.4 Å). In the CPNGRC family of structures this average distance between these two carbons is 8.4 Å (std dev 1.2 Å), increasing the distance between the two nearby polar recognition elements of the NGR motif. Whatever the cause, the new proline-containing peptide clearly binds to APN with improved efficiency, a characteristic that may be useful for future implementation of cellular studies incorporating this new sequence modification.
Acknowledgments
This work was supported by NIH AREA grant GM068431-02A1 and MRI award 0417731. The authors thank Dr. Andrey Bobkov for performing the analytical ultracentrifugation experiments at the BIMR Protein Production and Analysis Facility.
ABBREVIATIONS
- APN
aminopeptidase N
- DQF COSY
double quantum filtered cosy
- Diso
β aspartic acid
- ECOSY
exclusive correlated spectroscopy
- HSQC
heteronuclear single quantum correlation spectroscopy
- klaklak2
KLAKLAKKLAKLAK with D stereochemical configuration
- pLeuNA
L-Leucine-p-nitroanilide
- PIMT
Protein Isoaspartyl Methyltransferase
- ROESY
rotating frame spectroscopy
- SAH
S-adenyosyl-homocysteine
- SAM
S-adenosylmethionine
- TNF
tumor necrosis factor
- TOCSY
total correlation spectroscopy
References
- 1.Arap W, Pasqualini R, Ruoslahti E. Cancer Treatment by Targeted Drug Delivery to Tumor Vasculature in a Mouse Model. Science. 1998;279:377–80. doi: 10.1126/science.279.5349.377. [DOI] [PubMed] [Google Scholar]
- 2.Pasqualini R, Koivunen E, Kain R, Lahdenranta J, Sakamoto M, Stryhn A, et al. Aminopeptidase N is a receptor for tumor-homing peptides and a target for inhibiting angiogenesis. Cancer Res. 2000;60:722–7. [PMC free article] [PubMed] [Google Scholar]
- 3.Zhang Z, Harada H, Tanabe K, Hatta H, Hiraoka M, Nishimoto S. Aminopeptidase N/CD13 targeting fluorescent probes: synthesis and application to tumor cell imaging. Peptides. 2005;26:2182–7. doi: 10.1016/j.peptides.2005.03.049. [DOI] [PubMed] [Google Scholar]
- 4.Colombo G, Curnis F, De Mori GM, Gasparri A, Longoni C, Sacchi A, et al. Structure-activity relationships of linear and cyclic peptides containing the NGR tumor-homing motif. J Biol Chem. 2002;277:47891–7. doi: 10.1074/jbc.M207500200. [DOI] [PubMed] [Google Scholar]
- 5.Corti A, Ponzoni M. Tumor vascular targeting with tumor necrosis factor alpha and chemotherapeutic drugs. Ann N Y Acad Sci. 2004;1028:104–12. doi: 10.1196/annals.1322.011. [DOI] [PubMed] [Google Scholar]
- 6.Curnis F, Sacchi A, Borgna L, Magni F, Gasparri A, Corti A. Enhancement of tumor necrosis factor alpha antitumor immunotherapeutic properties by targeted delivery to aminopeptidase N (CD13) Nat Biotechnol. 2000;18:1185–90. doi: 10.1038/81183. [DOI] [PubMed] [Google Scholar]
- 7.Di Matteo P, Curnis F, Longhi R, Colombo G, Sacchi A, Crippa L, et al. Immunogenic and structural properties of the Asn-Gly-Arg (NGR) tumor neovasculature-homing motif. Mol Immunol. 2005 doi: 10.1016/j.molimm.2005.10.009. [DOI] [PubMed] [Google Scholar]
- 8.Moffatt S, Wiehle S, Cristiano RJ. Tumor-specific gene delivery mediated by a novel peptide-polyethylenimine-DNA polyplex targeting aminopeptidase N/CD13. Hum Gene Ther. 2005;16:57–67. doi: 10.1089/hum.2005.16.57. [DOI] [PubMed] [Google Scholar]
- 9.van Hensbergen Y, Broxterman HJ, Elderkamp YW, Lankelma J, Beers JC, Heijn M, et al. A doxorubicin-CNGRC-peptide conjugate with prodrug properties. Biochem Pharmacol. 2002;63:897–908. doi: 10.1016/s0006-2952(01)00928-5. [DOI] [PubMed] [Google Scholar]
- 10.Buehler A, van Zandvoort MA, Stelt BJ, Hackeng TM, Schrans-Stassen BH, Bennaghmouch A, et al. cNGR: a novel homing sequence for CD13/APN targeted molecular imaging of murine cardiac angiogenesis in vivo. Arterioscler Thromb Vasc Biol. 2006;26:2681–7. doi: 10.1161/01.ATV.0000245807.65714.0b. [DOI] [PubMed] [Google Scholar]
- 11.Ellerby HM, Arap W, Ellerby LM, Kain R, Andrusiak R, Rio GD, et al. Anti-cancer Activity of Targeted Pro-Apoptotic Peptides. Nature Medicine. 1999;5:1032–8. doi: 10.1038/12469. [DOI] [PubMed] [Google Scholar]
- 12.Koivunen E, Gay DA, Ruoslahti E. Selection of peptides binding to the alpha 5 beta 1 integrin from phage display library. J Biol Chem. 1993;268:20205–10. [PubMed] [Google Scholar]
- 13.Koivunen E, Wang B, Ruoslahti E. Isolation of a highly specific ligand for the alpha 5 beta 1 integrin from a phage display library. J Cell Biol. 1994;124:373–80. doi: 10.1083/jcb.124.3.373. [DOI] [PMC free article] [PubMed] [Google Scholar]
- 14.Curnis F, Longhi R, Crippa L, Cattaneo A, Dondossola E, Bachi A, et al. Spontaneous formation of L-isoaspartate and gain of function in fibronectin. J Biol Chem. 2006;281:36466–76. doi: 10.1074/jbc.M604812200. [DOI] [PubMed] [Google Scholar]
- 15.Spitaleri A, Mari S, Curnis F, Traversari C, Longhi R, Bordignon C, et al. Structural basis for the interaction of isoDGR with the RGD-binding site of alphavbeta3 integrin. J Biol Chem. 2008;283:19757–68. doi: 10.1074/jbc.M710273200. [DOI] [PubMed] [Google Scholar]
- 16.Rizzardi GP, Bordignon C. NGR and isoDGR are separate moieties binding to different receptors. Blood. 2009;113:5366. doi: 10.1182/blood-2009-02-207068. author reply 7. [DOI] [PubMed] [Google Scholar]
- 17.Bieker R, Kessler T, Schwoppe C, Padro T, Persigehl T, Bremer C, et al. Infarction of tumor vessels by NGR-peptide-directed targeting of tissue factor: experimental results and first-in-man experience. Blood. 2009;113:5019–27. doi: 10.1182/blood-2008-04-150318. [DOI] [PubMed] [Google Scholar]
- 18.Curnis F, Arrigoni G, Sacchi A, Fischetti L, Arap W, Pasqualini R, et al. Differential binding of drugs containing the NGR motif to CD13 isoforms in tumor vessels, epithelia, and myeloid cells. Cancer Res. 2002;62:867–74. [PubMed] [Google Scholar]
- 19.Kehlen A, Lendeckel U, Dralle H, Langner J, Hoang-Vu C. Biological significance of aminopeptidase N/CD13 in thyroid carcinomas. Cancer Res. 2003;63:8500–6. [PubMed] [Google Scholar]
- 20.Kawai M, Hara Y, Miyazato I, Hosaki S. Novel, aberrantly truncated isoform of serum CD13 in a family with high serum aminopeptidase N (CD13) activity. Clin Chem. 2001;47:223–30. [PubMed] [Google Scholar]
- 21.Watanabe Y, Ito K, Iwaki-Egawa S, Yamaguchi R, Fujimoto Y. Aminopeptidase N in sera of healthy subjects is a different N-terminal processed derivative from the one obtained from maternal serum. Mol Genet Metab. 1998;63:289–94. doi: 10.1006/mgme.1998.2676. [DOI] [PubMed] [Google Scholar]
- 22.Palmieri FE, Petrelli JJ, Ward PE. Vascular, plasma membrane aminopeptidase M. Metabolism of vasoactive peptides. Biochem Pharmacol. 1985;34:2309–17. doi: 10.1016/0006-2952(85)90787-7. [DOI] [PubMed] [Google Scholar]
- 23.Sjostrom H, Noren O, Olsen J. Structure and function of aminopeptidase N. Adv Exp Med Biol. 2000;477:25–34. doi: 10.1007/0-306-46826-3_2. [DOI] [PubMed] [Google Scholar]
- 24.Willig F, Greiner I, Stork H, Schmidt FH. Leucine aminopeptidase (arylamidase) activity in the serum. Determination using leucine-p-nitroanilide as substrate. Klin Wochenschr. 1967;45:474–81. doi: 10.1007/BF01717434. [DOI] [PubMed] [Google Scholar]
- 25.Pfleiderer A, Jr, Kidess E, Jung G. Aminopeptidases in ovarian carcinomas in relation to clinical and pathological findings. A biochemical and histochemical study. Arch Gynakol. 1970;209:121–35. doi: 10.1007/BF00668179. [DOI] [PubMed] [Google Scholar]
- 26.Achstetter T, Ehmann C, Wolf DH. Proteolysis in eucaryotic cells: aminopeptidases and dipeptidyl aminopeptidases of yeast revisited. Arch Biochem Biophys. 1983;226:292–305. doi: 10.1016/0003-9861(83)90296-5. [DOI] [PubMed] [Google Scholar]
- 27.Piotto M, Saudek V, Sklenar V. Gradient-tailored excitation for single-quantum NMR spectroscopy of aqueous solutions. J Biomol NMR. 1992;2:661–5. doi: 10.1007/BF02192855. [DOI] [PubMed] [Google Scholar]
- 28.Liu M, Mao Xa, Ye C, Huang H, Nicholson JK, Lindon JC. Improved WATERGATE Pulse Sequences for Solvent Suppression in NMR Spectroscopy. Journal of Magnetic Resonance. 1998;132:125–9. [Google Scholar]
- 29.Bax A, Davies DG. Mlev-17-Based Two-Dimensional Homonuclear Magnetization Transfer Spectroscopy. J Magn Reson. 1985;65:355–60. [Google Scholar]
- 30.Bothner-By AA, Stephens RL, Lee J, Warren CD, Jeanloz RW. Structure determination of a tetrasaccharide: transient nuclear Overhauser effects in the rotating frame. J Am Chem Soc. 1984;106:811–3. [Google Scholar]
- 31.Rance M, Sørensen OW, Bodenhausen G, Wagner G, Ernst RR, Wüthrich K. Improved Spectral Resolution in COSY 1H NMR Spectra of Proteins Via Double Quantum Filtering. Biochem Biophys Res Commun. 1983;117:479–85. doi: 10.1016/0006-291x(83)91225-1. [DOI] [PubMed] [Google Scholar]
- 32.Schwieters CD, Clore GM. Internal coordinates for molecular dynamics and minimization in structure determination and refinement. J Magn Reson. 2001;152:288–302. doi: 10.1006/jmre.2001.2413. [DOI] [PubMed] [Google Scholar]
- 33.Schwieters CD, Kuszewski JJ, Tjandra N, Clore GM. The Xplor-NIH NMR molecular structure determination package. J Magn Reson. 2003;160:65–73. doi: 10.1016/s1090-7807(02)00014-9. [DOI] [PubMed] [Google Scholar]
- 34.Cavanagh J, Fairbrother WJ, Palmer AG, Skelton NJ. Protein NMR Spectroscopy: Principles and Practice. San Diego: Academic Press Inc.; 1996. [Google Scholar]
- 35.Wilkes SH, Prescott JM. The slow, tight binding of bestatin and amastatin to aminopeptidases. J Biol Chem. 1985;260:13154–62. [PubMed] [Google Scholar]
- 36.Semenza G. Anchoring and biosynthesis of stalked brush border membrane proteins: glycosidases and peptidases of enterocytes and renal tubuli. Annu Rev Cell Biol. 1986;2:255–313. doi: 10.1146/annurev.cb.02.110186.001351. [DOI] [PubMed] [Google Scholar]
- 37.Kenny AJ, Maroux S. Topology of microvillar membrance hydrolases of kidney and intestine. Physiol Rev. 1982;62:91–128. doi: 10.1152/physrev.1982.62.1.91. [DOI] [PubMed] [Google Scholar]
- 38.Gorvel JP, Mishal Z, Liegey F, Rigal A, Maroux S. Conformational change of rabbit aminopeptidase N into enterocyte plasma membrane domains analyzed by flow cytometry fluorescence energy transfer. J Cell Biol. 1989;108:2193–200. doi: 10.1083/jcb.108.6.2193. [DOI] [PMC free article] [PubMed] [Google Scholar]
- 39.Laskowski RA, Rullmannn JA, MacArthur MW, Kaptein R, Thornton JM. AQUA and PROCHECK-NMR: programs for checking the quality of protein structures solved by NMR. J Biomol NMR. 1996;8:477–86. doi: 10.1007/BF00228148. [DOI] [PubMed] [Google Scholar]
- 40.Laskowski RA, MacArthur MW, Moss DS, Thornton JM. PROCHECK: a Program to Check the Stereochemical Quality of Protein Structures. J Appl Cryst. 1993;26:283–91. [Google Scholar]


