Abstract
Murine norovirus (MNV) is prevalent in SPF mouse facilities in the United States, and we currently lack sufficient data to determine whether it should be eliminated. It is generally accepted that the virus does not cause clinical symptoms in immunocompetent mice. However, we previously reported that MNV infection alters the phenotype of a mouse model of bacteria-induced inflammatory bowel disease in part through its effects on dendritic cells. The tropism of MNV toward macrophages and dendritic cells makes MNV a potential intercurrent variable in murine models of macrophage-driven inflammatory diseases, such as obesity, insulin resistance, and atherosclerosis. Therefore, we determined whether MNV infection altered obesity and insulin resistance phenotypes in C57BL/6 mice, a widely used model of diet-induced obesity. We found that MNV did not alter weight gain, food intake, and glucose metabolism in this model, but it did induce subtle changes in lymphoid tissue. Further studies using other models of metabolic diseases are needed to provide additional information on the potential role this ‘subclinical’ virus might have on disease progression in mouse models of inflammatory diseases.
Abbreviations: HFD, high-fat diet; IPGTT, intraperitoneal glucose tolerance test; IPITT, intraperitoneal insulin tolerance test; MLN, mesenteric lymph node; MNV, murine norovirus
Murine norovirus (MNV) is endemic in many SPF mouse colonies across North America,5 creating considerable potential for this virus to interfere with mouse models of human diseases. In addition, the presence of MNV in some mouse colonies and not in others may help explain phenotypic variability in mouse models across institutions. This virus is related to the human Norwalk virus that causes gastrointestinal inflammation in humans. Although MNV does not cause any overt illness in immunocompetent mice, significant inflammation and mortality can be induced in mice with abnormal innate immunity.7 Previously, we investigated the influence of MNV on the development of bacteria-induced inflammatory bowel disease in FVB.129P2-PAbcb1atm1Bor (Mdr1a−/−) mice.8 We found that infection with MNV accelerated the progression of inflammatory bowel disease in this mouse model when mice were coinfected with Helicobacter bilis. In addition, infection with MNV alone altered the immune response, probably through changes in dendritic cells.8 These findings suggest that MNV may induce subtle changes in immune responses even in immunocompetent mice, given that MNV is known to preferentially infect macrophages and dendritic cells.22
Obesity has been defined as a disease of chronic inflammation, and in recent years, the prominent role that macrophages play in this process has been recognized.9,10,21,24 Obesity is a risk factor for various chronic diseases that share inflammation as a critical component of the disease process, such as metabolic syndrome, diabetes, and atherosclerosis.3 Because MNV has tropism for macrophages, we wished to determine whether MNV infection influences the development of obesity and insulin resistance in a widely used animal model of diet-induced obesity. C57BL/6 mice are the most frequently used ‘wild-type’ strain and are prone to develop insulin resistance as obesity develops during high-fat feeding.1 We hypothesized that MNV may accelerate inflammation by stimulating macrophage accumulation in adipose tissue, resulting in a more severe obesity or insulin resistance phenotype when mice are fed a high-fat diet.
Materials and Methods
Animals.
Male C57BL/6J mice (age, 5 wk) certified to be MNV-negative were purchased from Jackson Laboratories (Bar Harbor, ME) and housed in an SPF facility in a temperature (20 to 23 °C) and humidity(30% to 70%)-controlled room with a 12:12-h light:dark cycle. Infectious agents excluded from our facility include mouse hepatitis virus, mouse parvovirus, minute virus of mice, reovirus 3, pneumonia virus of mice, epizootic diarrhea of infant mice, Theiler murine encephalomyelitis virus, lymphocytic choriomeningitis virus, ectromelia virus, Sendai virus, sialodacryoadenitis virus, rat parvoviruses, Mycoplasma pulmonis, pinworms, and fur mites. In addition, Helicobacter spp. and MNV were excluded in our room except for experimental infection. To prevent cross-contamination, standard operating procedures were developed that included using separate changing stations when handling MNV-infected versus noninfected animals, using separate supplies, and handling noninfected animals before infected animals. All experimental procedures involving animals were approved by the Institutional Animal Care and Use Committee of the University of Washington.
Diet-induced obesity and MNV infection.
Mice were acclimated for 1 wk before being assigned randomly to 1 of 3 groups: 1) vehicle treatment at initiation of high fat-diet (control); 2) MNV infection at initiation of high-fat diet (HFD; MNV-infected, 10 wk); and 3) MNV infection 4 wk after initiation of HFD (MNV-infected, 6 wk). During the acclimation period, mice received regular rodent chow (PicoLab Rodent Diet 20, LabDiet, St Louis, MO). All mice were given HFD (5A3N, Test Diet) during the 10-wk study period; the HFD fed was AIN93M14 modified to provide 58.9% of calories as fat (mostly lard), 31.4% calories as carbohydrates, and 9.6% calories as protein, according to the data listed by the manufacturer. Mice were weighed weekly, and food intake was determined daily for 5 d beginning 2 wk after infection with MNV. Mice were infected with 5 × 10⁶ pfu MNV45 (a gift from Dr Lela Riley, University of Missouri) in 200 µL PBS by oral gavage as previously described.8 Briefly, MNV stocks were propagated in RAW 264.7 cells, a transformed murine macrophage cell line. Subconfluent cultured cells were infected with MNV at a multiplicity of infection of 0.05 and incubated for 48 to 72 h.6 MNV was recovered by successive freeze–thaw cycles, concentrated by centrifugation at 90,000 × g for 3 h, and titered by plaque assay using RAW 264.7 cells. Infection status was determined at the start of the diet, 2 wk after infection, and at the end of study (10 wk on the diet) by fecal PCR.6 Infection status was confirmed by testing for serum antiMNV antibodies (Research Animal Diagnostic Laboratory, University of Missouri, Columbia, MO) in sera collected at the end of the study.
Fasting glucose concentration, intraperitoneal glucose tolerance test (IPGTT), and intraperitoneal insulin tolerance test (IPITT).
Mice were fasted for 6 h prior to analysis of fasting blood glucose concentration, IPGTT, and IPITT. Fasting blood glucose concentrations were determined (OneTouch Ultra glucometer, Lifescan, Milpitas, CA) from tail blood at 3, 6, and 10 wk after initiation of HFD. For IPGTT and IPITT, blood glucose was measured (OneTouch Ultra glucometer, Lifescan) just before intraperitoneal injection of glucose (2 g/kg in sterile PBS) or insulin (1 U/kg Humilin R [Lilly, Indianapolis, IN] in sterile PBS) and at 30, 60, and 90 (for IPITT) or 120 (for IPGTT) min after injection.
Tissue collection.
At the end of the study, mice were fasted for 4 h, weighed, and bled from the tail vein to determine blood glucose levels. Mice then were euthanized by CO2 asphyxiation followed by cardiocentesis. Serum was separated and stored at –80 °C until analysis. Peritoneal macrophages were collected by peritoneal lavage with 10 mL PBS, pelleted by centrifugation, and stored at –80 °C for later RNA extraction. Liver, pancreas, and mesenteric lymph nodes (MLN) were dissected, and portions of liver and pancreas and all MLN were processed for paraffinated or frozen blocks for histologic analyses. Tissue not used for histologic studies was immediately snap-frozen in liquid N2 and stored at –80 °C. Four major adipose depots (epididymal, mesenteric, retroperitoneal, and inguinal fat pads) were dissected, individually weighed, and frozen in liquid nitrogen.
Histology.
Liver and MLN were fixed in 10% phosphate-buffered formalin for 24 h and paraffinated. MLN and liver were sectioned (4 to 5 µm), stained with hematoxylin and eosin, and analyzed (Figure 1) by a board-certified veterinary pathologist (PMT) blinded to treatment groups. The liver was assessed for lipidosis by using a 5-point severity scale, with 0 set as normal and 4 as marked lipidosis.
Figure 1.
Histologic scoring system for MLN pathology.
Serum lipids and insulin.
Serum insulin was measured by using commercial ELISA kits (Millipore, MA) according to the manufacturer's instructions. Serum cholesterol levels were determined by using a colorimetric kit (Diagnostic Chemicals Limited, Oxford, CT) with cholesterol standards (Pointe Scientific, Canton, MI). Serum triglyceride levels were analyzed colorimetrically after removal of free glycerol (Trig-GB kit, Roche Diagnostics, Mannheim, Germany).
Liver lipids.
Lipids were extracted from liver pieces (approximately 100 mg) by using the Folch method.4 Extracted lipids were dried under a gentle stream of N2 in a water bath at 45 °C and reconstituted with 1 mL chloroform. An aliquot (50 µL) was dried and solubilized in 100 µL 3% Triton X100 in water. Triglycerides and cholesterol were measured from 5 µL solubilized lipid extract by using a colorimetric method (Trig-GB kit, Roche Diagnostics).
RT-PCR.
Total RNA was extracted from liver, peritoneal macrophage, and mesenteric fat (100 mg) by using RNeasy Tissue Mini Kit (Qiagen, Valencia, CA), RNAqueous-Micro Kit (Ambion, Austin, TX), and RNeasy Lipid Tissue Mini Kit (Qiagen), respectively. RT-PCR according to previously reported protocols8 was used to identify the presence of MNV in liver, peritoneal macrophages, and mesenteric fat.
Statistical analysis.
Data were analyzed by using statistical software (Prism, GraphPad, La Jolla, CA). One-way ANOVA with Bonferroni correction was used for comparison between 3 groups. Statistically significant differences were defined as having a P value of 0.05 or less.
Results
Infection status and tissue tropism of MNV.
To determine infection status of animals, fecal RT-PCR was performed at initiation of the study, 2 wk after infection, and the end of the study. In addition, serologic responses to MNV in serum were measured from the terminal bleed. Throughout the study period, vehicle-treated control animals (n = 10) remained negative for MNV by fecal PCR, which correlated with seronegativity to MNV (Table 1).
Table 1.
MNV infection status according to results of RT-PCR and serology
| Fecal PCR |
Serology (10 wk on HFD) |
|||||
| Mouse ID | 2 wk on HFD | 6 wk on HFD | 10 wk on HFD | MFI | ||
| Vehicle controls | ||||||
| 1 | negative | negative | 190 | |||
| 2 | negative | negative | negative | negative | 187 | |
| 3 | negative | negative | negative | 149 | ||
| 4 | negative | negative | negative | 556 | ||
| 5 | negative | negative | 139 | |||
| 6 | negative | negative | 282 | |||
| 7 | negative | negative | 827 | |||
| 8 | negative | negative | negative | negative | 200 | |
| 9 | negative | negative | negative | negative | 138 | |
| 10 |
negative |
negative |
387 |
|||
| MNV-infected, 6 wk | ||||||
| 11 | positive | positive | 7775 | |||
| 12 | positive | negative | positive | 2243 | ||
| 13 | positive | positive | 4398 | |||
| 14 | positive | positive | positive | 5239 | ||
| 15 | negative | positive | positive | positive | 3112 | |
| 16 | positive | positive | 2584 | |||
| 17 | positive | negative | positive | 2078 | ||
| 18 | positive | positive | 6043 | |||
| 19 | positive | positive | positive | 8261 | ||
| 20 | negative | positive | positive | positive | 1674 | |
| MNV-infected, 10 wk | ||||||
| 21 | positive | positive | positive | 3994 | ||
| 22 | positive | positive | positive | positive | 2586 | |
| 23 | positive | positive | positive | positive | 3503 | |
| 24 | positive | positive | positive | 4118 | ||
| 25 | negative | positive | positive | 4986 | ||
| 26 | positive | positive | positive | 2559 | ||
| 27 | negative | positive | positive | 5453 | ||
| 28 | positive | positive | positive | 5143 | ||
| 29 | positive | positive | positive | positive | 4876 | |
| 30 | positive | positive | positive | positive | 2099 | |
Blank cells indicate that the assay was not done.
Because MNV has been shown to infect mouse macrophages and dendritic cells in tissue culture,22,23 we determined the presence of MNV in peritoneal macrophages, mesenteric adipose tissue (including macrophages), and liver by RT-PCR. Regardless of infection status, MNV was not found in any of these tissues at the end of the study.
MNV infection did not alter food intake, body weight gain, or adiposity.
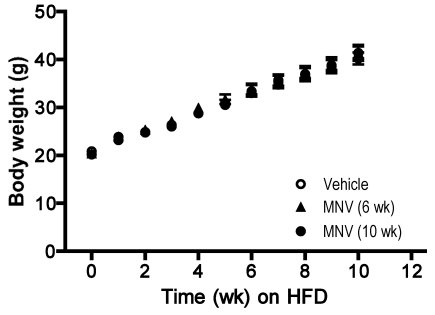
To determine whether MNV infection affected body weight gain, mice were weighed and monitored weekly for the duration of the study. Rate of weight gain between the 3 treatment groups was indistinguishable, and all groups gained an average of 100% over their initial body weights (approximately 20 g for all groups; Figure 2). In agreement with this observation, we did not detect significant differences in food intake determined at 2 different time points during the experimental period in the 3 groups (vehicle, 3.4 ± 0.4 g; MNV infection for 6 wk, 3.1 ± 0.7 g; MNV infection for 10 wk, 3.0 ± 0.3 g,). At the end of the study, 4 major adipose depots (epididymal, retroperitoneal, mesenteric, and inguinal) were dissected and weighed to estimate alterations in fat deposition in each site. Mean weights for all of the fat depots did not differ significantly between treatment groups. In addition, adiposity (defined as the sum of all 4 fat depots/body weight × 100%) was not different between the 3 groups (vehicle, 14.8 ± 2.4; MNV infection for 6 wk, 15.3 ± 2.1; MNV infection for 10 wk, 15.4 ± 3.5).
Figure 2.
Body weight gain associated with feeding HFD over 10 wk. C57BL/6 male mice (n = 10 per group) were infected with MNV at initiation of (MNV, 10 wk) or 4 wk after the diet (MNV, 6 wk). The control group was gavaged with vehicle only at the initiation of the diet. Each data point represents mean ± SEM. No significant differences occurred among treatment groups at any time points during the 10-wk period.
MNV infection did not appreciably alter glucose homeostasis and lipid metabolism.
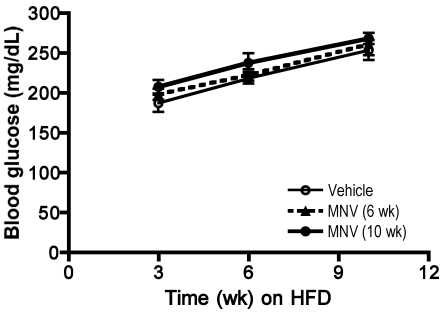
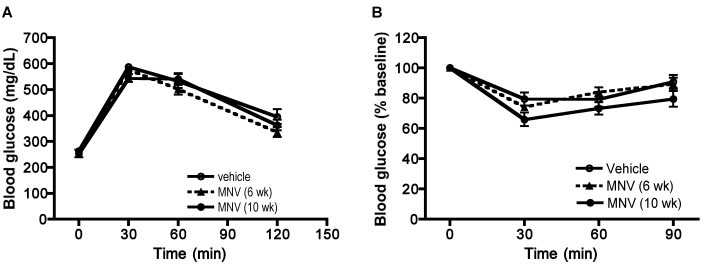
Fasting glucose levels increased gradually with weight gain, as expected, in all 3 groups; however, differences between the 3 groups were not observed (Figure 3). Glucose and insulin tolerance tests performed at 8 and 9 wk after initiation of HFD also showed no differences among the 3 groups (Figure 4). Insulin and fasting glucose levels determined from serum samples collected at the end of the study were not significantly different among the 3 groups (data not shown). Total cholesterol and triglycerides concentrations were measured from serum at the end of the study. Although triglycerides did not differ between the 3 groups, total cholesterol showed a trend (P = 0.054, one-way ANOVA) toward increased levels in infected animals (vehicle group, 180.4 ± 30.1; MNV infection for 6 wk, 208.8 ± 38.4; MNV infection for 10 wk, 241.3 ± 29.7).
Figure 3.
Changes in fasting blood glucose levels associated with feeding HFD over 10 wk. Fasting blood glucose levels increased with increasing duration on HFD in all mice regardless of MNV treatment (2-way ANOVA, P < 0.0001), whereas no significant differences occurred between treatment groups at any time points.
Figure 4.
IPGTT and IGITT. Mice were fasted for 6 h prior to (A) IPGTT or (B) IPITT. Blood glucose levels were determined after injection of glucose (2 g/kg) or insulin (1 U/kg) at predetermined times. MNV treatment did not alter the glucose clearance rate or insulin sensitivity in mice fed HFD.
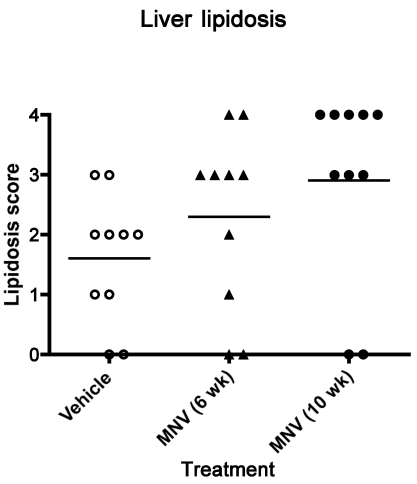
Insulin resistance in obese animals is often associated with lipid accumulation in the liver.19 In the current study, 2 measures of liver lipid accumulation showed no effect due to MNV infection. All mice fed HFD exhibited various degrees of lipidosis as determined by histologic analysis, with no significant differences between groups (Figure 5). In addition, MNV infection did not affect lipid accumulation in the liver as determined by triglyceride and total cholesterol contents (Table 2).
Figure 5.
Lipid accumulation in liver. After 10 wk of receiving HFD, mice (n = 10 per group) were euthanized, and a piece of liver tissue was taken from the left lateral lobe of each mouse. Paraffin-embedded tissue sections were stained with hematoxylin and eosin, and the degree of lipid accumulation was scored by a board-certified veterinary pathologist blinded to treatment group. Horizontal line indicates the mean value. No significant differences were found among treatment groups.
Table 2.
Liver lipid contents
| Triglycerides (mg/g liver) | Cholesterol (mg/g liver) | |
| Vehicle controls | 54.18 ± 16.17 | 5.1 ± 1.2 |
| MNV-infected, 6 wk | 61.93 ± 17.37 | 5.1 ± 0.7 |
| MNV-infected, 10 wk | 57.06 ± 19.05 | 5.5 ± 1.1 |
MNV infection was associated with minimal changes in lymph nodes.
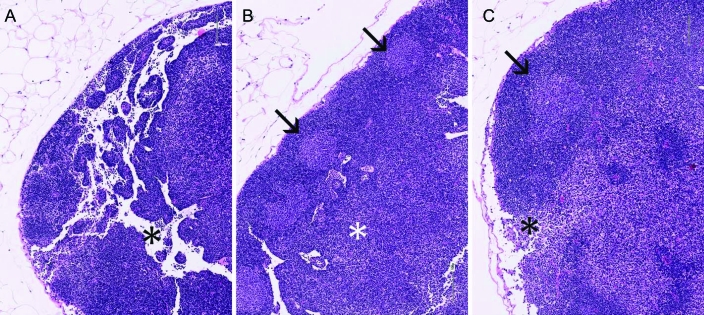
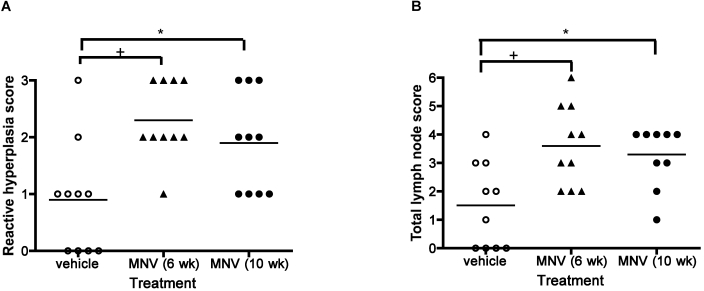
Based on our previous report of changes in MLN of MNV infected animals,8 a histologic scoring system (Figure 1) was used to evaluate the MLN of mice fed HFD. All mice fed HFD showed various degrees of reactive hyperplasia, with mild inflammation in lymphatic vessels (Figure 6). Although severity of lymphangitis did not differ significantly between the 3 groups (data not shown), reactive lymphoid hyperplasia was increased significantly (overall P = 0.0034; control versus 6-wk MNV, P < 0.01; control versus 10-wk MNV, P < 0.05) with MNV infection, as assessed by one-way ANOVA followed by multiple comparisons with Bonferroni correction (Figure 7 A). Further analysis of lymph node lesions (combined scores of lymphangitis, reactive hyperplasia, and lymph node size) showed that the 3 treatment groups were significantly (one-way ANOVA analysis, P = 0.0033) different from each other (Figure 7 B). The combined lymph node score of uninfected mice was significantly (multiple comparison analysis with Bonferroni correction; control versus 6-wk MNV, P < 0.01; control versus 10-wk MNV, P < 0.05) different from that of MNV-infected mice (Figure 7 B).
Figure 6.
Representative sections of MLN from uninfected (A; total score, 0) and MNV-infected (B: MNV 6 wk, total score = 5; C: MNV 10 wk, total score = 4) mice. Hematoxylin and eosin stain; magnification, ×10. Note the relative hypocellularity of the control node with prominent empty sinuses (*, A) and the presence of germinal centers (arrows) and sinusoidal hypercellularity in infected mice (B, C).
Figure 7.
Pathology of MLN in mice fed HFD. MLN of mice fed HFD for 10 wk were stained with hematoxylin and eosin and analyzed morphologically by a veterinary pathologist blinded to treatment group. (A) MNV infection was significantly (one-way ANOVA, P = 0.0034) associated with increased reactive hyperplasia. A multiple comparisons test found significant (*, P < 0.05; +, P < 0.01) differences between infected and uninfected groups. (B) The total lymph node score was significantly different between 3 groups (one-way ANOVA, P = 0.0033). Horizontal bar indicates the mean value. A posthoc test (Bonferroni) showed that the MNV-uninfected group was significantly different from the MNV-infected group (*, P < 0.05; +, P < 0.01)
Discussion
MNV is endemic in many SPF research mouse colonies across the country,13 but little information is available upon which to base decisions whether MNV-infected mouse colonies should be rederived and maintained MNV-free. Since the initial report that MNV could induce significant systemic pathology and mortality in mice with impaired innate immunity,7 few studies have reported an adverse response to MNV infection in either immunocompetent mice or genetically modified mice.23 One study20 identified inflammation in liver, lung, peritoneal, and pleural cavities in MNV-infected immunodeficient mouse lines excluding Rag2−/− mice. Our group showed that MNV infection can accelerate the progression of inflammatory bowel disease in Mdr1a−/− mice and that the effect may in part be mediated through interactions between MNV-infected dendritic cells and T cells with altered proinflammatory cytokines;8 this finding raised the possibility that other inflammatory disease models that involve antigen-presenting cells (for example, macrophages) might be modified by the presence of MNV.
Macrophages are thought to play an important role in disorders such as obesity, diabetes, and atherosclerosis.9,10,15,21 C57BL/6 mice fed HFD are commonly used to assess the correlations between obesity and the development of insulin resistance and type 2 diabetes.2 We wanted to determine whether the introduction of MNV into this model would alter any aspects of the dietary induced-obesity and insulin-resistance phenotype. We tested 2 situations: 1) MNV is introduced at the beginning of the study and 2) MNV infection occurs while the study is ongoing and after the animals have been on HFD for 4 wk. MNV-infected mice were fecal PCR-positive at 2 wk after infection, and the majority of mice continued to shed virus at 6 and 10 wk after infection (Table 1). Uninfected (vehicle-treated) mice remained free of MNV for the entire study. Some of the infected animals that tested negative by fecal PCR had low mean fluorescent indices by serum immunoassay (Luminex). Consistent with previous findings involving MNV4 infections in ICR mice,11 all mice in the current study that were infected with MNV were serologically positive at the end of the study regardless of duration of infection (10 wk versus 6 wk) and were still shedding virus in feces. However, at the end of the study, we did not detect viral RNA in the peritoneal macrophages, mesenteric fat, or livers of mice infected with MNV. Others23 have reported tropism of MNV toward macrophages and dendritic cells in vivo by immunohistochemical demonstration of virus in liver (Kupffer cells) and spleen 2 d after infection. The absence of MNV in macrophage-containing tissues in our study is likely due to the low level of MNV in these tissues rather than to clearance of the virus, given that infected mice were still shedding the virus in feces.
MNV infection status did not alter food intake, rate of weight gain, or severity or onset of insulin resistance due to high-fat feeding. Hepatic insulin resistance may occur in part due to increased lipid accumulation in liver, although the precise mechanisms of insulin resistance are not known. One explanation for this phenomenon is the failure of fatty acid β-oxidation and increased triglycerides, ceramides, and diacylglycerol synthesis in the liver due to overload of substrate derived from increased lipolysis in adipose tissues.12 In our study, lipid accumulation in liver was not significantly different in MNV-infected and uninfected animals, consistent with the absence of altered blood glucose levels in the 2 groups. Because we terminated the study after 10 wk of HFD, we cannot rule out that a longer study duration might reveal more pronounced changes in glucose metabolism and insulin response.
We did note a minimal yet significant change in lymphoid tissue in MNV-infected mice. MNV infection was associated with increased reactive hyperplasia of the MLN. This result may reflect an increased immune response to MNV and suggests that this virus may induce subclinical yet histologically notable changes.
In summary, using a single strain of MNV (MNV4), we showed that MNV infection did not change glucose homeostasis (namely food intake, weight gain, insulin resistance, fasting blood glucose, liver lipid accumulation) in a C57BL/6 mouse model of diet induced-obesity and insulin resistance. However, this was a short-term study, and findings may differ in a long-term study or in other models of obesity-induced metabolic disease (such as the Ldlr−/− mouse16-18) and atherosclerosis,25 in which macrophages play a larger role.
Acknowledgments
We thank Susan Phelps, Aimee McMillan, and Lino Torres for care and monitoring of mice. Histopathology imaging was performed at the University of Washington's Histology and Imaging Core.
References
- 1.Almind K, Kahn CR. 2004. Genetic determinants of energy expenditure and insulin resistance in diet-induced obesity in mice. Diabetes 53:3274–3285 [DOI] [PubMed] [Google Scholar]
- 2.Berglund ED, Li CY, Poffenberger G, Ayala JE, Fueger PT, Willis SE, Jewell MM, Powers AC, Wasserman DH. 2008. Glucose metabolism in vivo in 4 commonly used inbred mouse strains. Diabetes 57:1790–1799 [DOI] [PMC free article] [PubMed] [Google Scholar]
- 3.Chandalia M, Abate N. 2007. Metabolic complications of obesity: inflated or inflamed? J Diabetes Complications 21:128–136 [DOI] [PubMed] [Google Scholar]
- 4.Folch J, Lees M, Sloane Stanley GH. 1957. A simple method for the isolation and purification of total lipids from animal tissues. J Biol Chem 226:497–509 [PubMed] [Google Scholar]
- 5.Hsu CC, Riley LK, Wills HM, Livingston RS. 2006. Persistent infection with and serologic cross-reactivity of 3 novel murine noroviruses. Comp Med 56:247–251 [PubMed] [Google Scholar]
- 6.Hsu CC, Wobus CE, Steffen EK, Riley LK, Livingston RS. 2005. Development of a microsphere-based serologic multiplexed fluorescent immunoassay and a revers- transcriptase PCR assay to detect murine norovirus 1 infection in mice. Clin Diagn Lab Immunol 12:1145–1151 [DOI] [PMC free article] [PubMed] [Google Scholar]
- 7.Karst SM, Wobus CE, Lay M, Davidson J, Virgin HW, 4th, 2003. STAT1-dependent innate immunity to a Norwalk-like virus. Science 299:1575–1578 [DOI] [PubMed] [Google Scholar]
- 8.Lencioni KC, Seamons A, Treuting PM, Maggio-Price L, Brabb T. 2008. Murine norovirus: an intercurrent variable in a mouse model of bacteria-induced inflammatory bowel disease. Comp Med 58:522–533 [PMC free article] [PubMed] [Google Scholar]
- 9.Lumeng CN, Bodzin JL, Saltiel AR. 2007. Obesity induces a phenotypic switch in adipose tissue macrophage polarization. J Clin Invest 117:175–184 [DOI] [PMC free article] [PubMed] [Google Scholar]
- 10.Lumeng CN, Deyoung SM, Bodzin JL, Saltiel AR. 2007. Increased inflammatory properties of adipose tissue macrophages recruited during diet-induced obesity. Diabetes 56:16–23 [DOI] [PubMed] [Google Scholar]
- 11.Manuel CA, Hsu CC, Riley LK, Livingston RS. 2008. Soiled-bedding sentinel detection of murine norovirus 4. J Am Assoc Lab Anim Sci 47:31–36 [PMC free article] [PubMed] [Google Scholar]
- 12.Muoio DM, Newgard CB. 2008. Mechanisms of disease: molecular and metabolic mechanisms of insulin resistance and β-cell failure in type 2 diabetes. Nat Rev Mol Cell Biol 9:193–205 [DOI] [PubMed] [Google Scholar]
- 13.Perdue KA, Green KY, Copeland M, Barron E, Mandel M, Faucette LJ, Williams EM, Sosnovtsev SV, Elkins WR, Ward JM. 2007. Naturally occurring murine norovirus infection in a large research institution. J Am Assoc Lab Anim Sci 46:39–45 [PubMed] [Google Scholar]
- 14.Reeves PG. 1997. Components of the AIN93 diets as improvements in the AIN76A diet. J Nutr 127:838S–841S [DOI] [PubMed] [Google Scholar]
- 15.Rigamonti E, Chinetti-Gbaguidi G, Staels B. 2008. Regulation of macrophage functions by PPARα, PPARγ, and LXRs in mice and men. Arterioscler Thromb Vasc Biol 28:1050–1059 [DOI] [PubMed] [Google Scholar]
- 16.Schreyer SA, Lystig TC, Vick CM, LeBoeuf RC. 2003. Mice deficient in apolipoprotein E but not LDL receptors are resistant to accelerated atherosclerosis associated with obesity. Atherosclerosis 171:49–55 [DOI] [PubMed] [Google Scholar]
- 17.Schreyer SA, Vick C, Lystig TC, Mystkowski P, LeBoeuf RC. 2002. LDL receptor but not apolipoprotein E deficiency increases diet-induced obesity and diabetes in mice. Am J Physiol Endocrinol Metab 282:E207–E214 [DOI] [PubMed] [Google Scholar]
- 18.Towler DA, Bidder M, Latifi T, Coleman T, Semenkovich CF. 1998. Diet-induced diabetes activates an osteogenic gene regulatory program in the aortas of low density lipoprotein receptor-deficient mice. J Biol Chem 273:30427–30434 [DOI] [PubMed] [Google Scholar]
- 19.Unger RH, Clark GO, Scherer PE, Orci L. 2010. Lipid homeostasis, lipotoxicity and the metabolic syndrome. Biochim Biophys Acta 1801:209–214 [DOI] [PubMed] [Google Scholar]
- 20.Ward JM, Wobus CE, Thackray LB, Erexson CR, Faucette LJ, Belliot G, Barron EL, Sosnovtsev SV, Green KY. 2006. Pathology of immunodeficient mice with naturally occurring murine norovirus infection. Toxicol Pathol 34:708–715 [DOI] [PubMed] [Google Scholar]
- 21.Weisberg SP, Hunter D, Huber R, Lemieux J, Slaymaker S, Vaddi K, Charo I, Leibel RL, Ferrante AW., Jr 2006. CCR2 modulates inflammatory and metabolic effects of high-fat feeding. J Clin Invest 116:115–124 [DOI] [PMC free article] [PubMed] [Google Scholar]
- 22.Wobus CE, Karst SM, Thackray LB, Chang KO, Sosnovtsev SV, Belliot G, Krug A, Mackenzie JM, Green KY, Virgin HW. 2004. Replication of norovirus in cell culture reveals a tropism for dendritic cells and macrophages. PLoS Biol 2:e432. [DOI] [PMC free article] [PubMed] [Google Scholar]
- 23.Wobus CE, Thackray LB, Virgin HW., 4th 2006. Murine norovirus: a model system to study norovirus biology and pathogenesis. J Virol 80:5104–5112 [DOI] [PMC free article] [PubMed] [Google Scholar]
- 24.Xu H, Barnes GT, Yang Q, Tan G, Yang D, Chou CJ, Sole J, Nichols A, Ross JS, Tartaglia LA, Chen H. 2003. Chronic inflammation in fat plays a crucial role in the development of obesity-related insulin resistance. J Clin Invest 112:1821–1830 [DOI] [PMC free article] [PubMed] [Google Scholar]
- 25.Yan ZQ, Hansson GK. 2007. Innate immunity, macrophage activation, and atherosclerosis. Immunol Rev 219:187–203 [DOI] [PubMed] [Google Scholar]


