

Abstract
The propagation of cell shape across generations is remarkably robust in most bacteria. Even when deformations are acquired, growing cells progressively recover their original shape once the deforming factors are eliminated. For instance, straight-rod-shaped bacteria grow curved when confined to circular microchambers, but straighten in a growth-dependent fashion when released. Bacterial cell shape is maintained by the peptidoglycan (PG) cell wall, a giant macromolecule of glycan strands that are synthesized by processive enzymes and cross-linked by peptide chains. Changes in cell geometry require modifying the PG and therefore depend directly on the molecular-scale properties of PG structure and synthesis. Using a mathematical model we quantify the straightening of curved Caulobacter crescentus cells after disruption of the cell-curving crescentin structure. We observe that cells straighten at a rate that is about half (57%) the cell growth rate. Next we show that in the absence of other effects there exists a mathematical relationship between the rate of cell straightening and the processivity of PG synthesis—the number of subunits incorporated before termination of synthesis. From the measured rate of cell straightening this relationship predicts processivity values that are in good agreement with our estimates from published data. Finally, we consider the possible role of three other mechanisms in cell straightening. We conclude that regardless of the involvement of other factors, intrinsic properties of PG processivity provide a robust mechanism for cell straightening that is hardwired to the cell wall synthesis machinery.
Keywords: cell shape, cell wall, cell curvature, modeling
Bacteria exhibit a wide variety of shapes, which are precisely maintained over countless generations in most species, though the mechanisms of the process are not well understood. Many bacteria display rod shape, which can confer selective advantages (1). In nature bacteria frequently grow in dense environments such as soil and colonies, and are therefore likely to experience physical constraints. For example, chemotactic rod-shaped bacteria are capable of penetrating channels narrower than their diameter to reach nutrient sources. Within the channels, growing and dividing cells undergo significant mechanical stress and acquire various deformed cell shapes (2). Similarly, recent experiments using microchambers showed that external physical forces can cause straight-rod-shaped cells to grow curved (3, 4). Once the force is released, cells gradually return to their native straight-rod shape as growth continues (2–4). The properties of cell shape recovery have not received much attention, yet they have important implications for the robust maintenance of cell shape throughout bacterial populations.
Here we focus on the straightening of curved rod-shaped cells. Using a mathematical model we show first that straightening of exponentially growing cells is a rather surprising phenomenon that would not occur without a specific mechanism. We then discuss potential mechanisms in light of cell structure and growth. The shape of an individual bacterial cell is largely maintained by the peptidoglycan (PG) cell wall, a strong and flexible meshwork of rigid glycan strands and flexible peptide cross-bridges that is under stress from internal hydrostatic (turgor) pressure (5). It is a single, covalently closed molecule, and thus bonds must be broken to generate sites for the insertion of new PG subunits (6). At such sites, penicillin-binding proteins (PBPs) processively elongate glycan strands by adding new subunits to their growing ends (7–10). According to the three-for-one model, a popular model for PG insertion, three new glycan strands are believed to be linked to the existing PG by cross-linking to both sides of a docking strand on the preexisting PG. Cleavage of the docking strand pulls the new strands into the stress-bearing layer (11, 12). An important consequence of processive gycan strand elongation is that newly inserted material is asymmetric, as glycan strands are much longer in one direction than in the other (length versus width). This suggests that not only the localization of new glycan strand synthesis, but also its orientation and length, are likely to directly affect cell shape.
Of these three parameters only the first two have received attention in the literature. The prevalent view proposes that cytoskeletal filaments such as tubulin-like FtsZ and actin-like MreB spatially regulate PG insertion (13–15). Experimental evidence suggests that the cell wall exhibits partial order with glycan strands roughly oriented perpendicular (possibly with some tilt) to the long axis of a rod-shaped cell (16–18). This orientation may be guided in part by MreB (13), which plays a critical role in maintaining the rod shape, because inactivation of MreB cables causes cells to grow spherically (19, 20). The orientation of glycan strands may also result in part from the asymmetric stresses present in the cell wall during growth (21). Moreover, it has been proposed that local differences in cell wall mechanical structure and stress might affect cell wall synthesis (3) and cell shape (22).
In addition to the localization and direction of new glycan strand synthesis, straightening might also depend crucially on the length of newly synthesized glycan strands. This possibility has received no attention until now, but it represents an additional degree of freedom for a cell to control its shape. In this work we use a mathematical model to quantify cell straightening in live Caulobacter crescentus cells, a naturally curved bacterium that straightens after disruption of the stress-bearing crescentin structure (3, 23). We show that cell straightening is critically affected by the processivity of PG synthesis, which we define as the mean number of subunits incorporated into a glycan chain before synthesis termination.
Results and Discussion
Cell Straightening Despite Exponential Growth.
Cell straightening via growth upon removal of physical constraints seems intuitive. However, it becomes nontrivial when considered together with another intuitive principle of bacterial growth—proportional growth. This idea states that cell elongation rate is proportional to length, resulting in exponential growth of the cell body. The simplest explanation for this is that PG insertion sites, enzymes, and precursors are randomly distributed across the cell surface. Therefore, longer cells elongate faster by having a greater area for incorporation of new material. Proportional growth was indirectly suggested by demonstrating exponential increase of protein synthesis in Escherichia coli (reviewed in ref. 24). Here we used time course microscopy and cell length measurements to show that cells blocked for cell division increase their cell length  exponentially (SI Appendix, Section I and Fig. S1). We concluded that the cell relative growth rate A defined as
  is constant.
However, proportional growth alone cannot explain why curved cells straighten (Fig. 1A). As illustrated in a recent study, proportional growth maintains curvature (25). Indeed a curved rod-shaped cell is longer on one side (outer side; L1 in Fig. 1B) than the other (inner side; L2 in Fig. 1B) (Fig. 1A); thus, if growth were proportional to the length of each side, a curved cell would elongate faster along the outer side than the inner side, favoring retention of curvature rather than straightening (Fig. 1 A and B). In this growth mode (hereafter “growth mode 1,” called also “self-similar growth” in ref. 25) the length L of every material line along the cell body increases proportionally to itself and the relative growth rate dL/(Ldt) is uniform over the entire cell surface. Thus, although the cell length  (average of L over the cell cross section; Fig. 1B) grows exponentially, the curvature C of the cell is maintained even if curvature-inducing constraints are removed. The curvature is constant because it only depends on the ratio between the lengths of the outer and inner lines according to rC = (L1/L2 - 1)/(L1/L2 + 1) (Fig. 1A, Left and Fig. 1B). Here we approximated the cell shape with a section of a torus of radius R = 1/C (the cell’s radius of curvature) and cross sectional radius r (SI Appendix, Section II and Fig. S2). According to growth mode 1, if a cell divides, it will produce two cells with identical curvature to the original one. However, experimental observations demonstrate that cells straighten (3, 4).
Fig. 1.

(A) Effect of different modes of PG growth on the straightening of a cell. If growth is proportional to local length (mode 1), curvature does not change. If growth is the same on both side and proportional to average length (mode 2), curvature decreases. Numbers represent lengths in arbitrary units; e.g., microns. (B) 3D shape of the cell is approximated by a torus. (Upper) Coordinate y and the directions of the two principal stress components T∥and T⊥ are indicated. (Lower) Small segment. The length L varies linearly with y from L2 (minimum) to L1 (maximum). The length of the centerline  is the average of L over the cross section. C. Theoretical cell curvature as a function of time (Eq. 2) for S = 0 (mode 1), 0.5 (intermediate mode), and 1 (mode 2). Cell length as a function of time assuming no division (dashed line).
For the cell to straighten, the relative growth rate dL/(Ldt) of the inner line must be larger than that of the outer line. An extreme case would be if the growth rate dL/dt were uniform over the cell surface and proportional to the mean length  of the cell (hereafter “growth mode 2” or “hooplike growth” in ref. 25). In this case all the pole-to-pole material lines on the surface of the cell elongate at the same speed. Hence the cell straightens at the same relative rate as it grows. In Fig. 1A (Right) both the outer and inner lines lengthen by the same amount. Because the ratio between the two lines decreases, the cell straightens. If this cell divides, the daughter cells will be less curved than the original cell. In growth mode 2 the radius of curvature increases at the same rate as the length of the cell
  (Eq. 2, below).
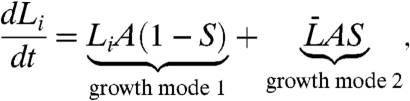
To quantify the behavior of bacterial cells observed in experiments, we describe growth and straightening as a linear combination of the two limit modes just described. Consider a line of length L on the surface of a narrow segment of a torus (Fig. 1B). During a small amount of time Δt, mode 1 would contribute an amount LAΔt to the elongation of the line, whereas mode 2 would contribute  , where A is the cell growth rate. Combining the two, the elongation of the line during Δt can be written
  . The “straightening coefficient” S represents the relative contribution of mode 2 to the total elongation rate and takes values between 0 (mode 1, no straightening) and 1 (mode 2, maximum straightening). With any value of S < 1, the greatest elongation occurs at the outer line, L1, and the least elongation occurs at the inner line, L2. Because the length of any other line around the cell circumference between these two will change linearly with the y coordinate, which we choose along the diameter connecting L1 to L2 (Fig. 1B), the increments ΔL will also change linearly with y. Therefore, we can simplify the math by considering only the growth along the outer and the inner lines
 |
[1] |
where i = 1,2 and  . Rewriting in terms of the average length
  and the curvature
  (here R is the radius of curvature of the centerline and r is the radius of curvature of the cross section of the cell) we obtain two equations that are conveniently decoupled,
 |
[2] |
the first describing changes in cell length and the second describing changes in cell curvature. The growth rate A fully determines the lengthening of the cell whereas S determines the straightening behavior. Eq. 2 further shows that what we call the straightening coefficient S is simply the ratio between the relative growth rate of the radius of curvature R = 1/C and that of the cell length  . When S = 0 the cell lengthens, but its curvature does not change. When S = 1, the radius of curvature of the cell grows at the same relative rate A as the cell length (Fig. 1C).
Quantification of the Straightening Coefficient.
To experimentally quantify the coefficients A and S we used Caulobacter crescentus as a model system. C. crescentus naturally grows curved because of an internal constraint posed by crescentin (23). This intermediate filament-like protein forms a single cytoskeletal filamentous structure that localizes to one lateral side of the cell and alters the kinetics of PG insertion around the cell circumference, leading to cell curvature (3). Expression of a dominant-negative crescentin mutant disrupts the crescentin structure. This stochastic process takes place during the first 2 h following induction of the crescentin mutant synthesis (Fig. 2D in ref. 3), and leads to cell straightening in a growth-dependent fashion over 8–10 h that recapitulates the straightening behavior of cells released from microchambers (3, 4).
To determine A and S from data, we needed simultaneous measurements of the cell straightening and growth rate of the culture as a function of time (Fig. 2A). For this reason we did three replicates of the experiment by Cabeen et al. (3). Note that these experiments are done in liquid culture rather than on agarose pads to minimize the effects from external forces that could affect cell shape. Consider first the data points for which virtually all of the crescentin structures are disrupted (after 2 h). Eq. 2 implies that the curvature of a cell declines exponentially as C(t) = Cie-t/τ, with Ci being the initial curvature of this cell and τ = 1/(AS) the decay time. Although we measure the distribution of individual cell curvature at specific time points, growth in liquid culture precludes measurements of τ and the growth rate A for individual cells. Accordingly, to extract the straightening coefficient S from these experiments, we fit the data to a simple model in which these constants are assumed to be identical for all cells.
Fig. 2.

Straightening of C. crescentus following disruption of the crescentin filamentous structure. (A) Cell curvature averaged over the population as a function of time (full circles). Error bars representing standard error of the mean from 3 replicates of the experiment are not visible because they are smaller than the circles. The solid line represents the mean of the fit to this particular experiment (one of three) with the parameters τ = 305 ± 4 min, C0 = 0.540 ± 0.003 μm-1, σ0 = 0.240 ± 0.008 μm-1, and σr = 0.152 ± 0.002 μm-1 (errors indicate 95% confidence levels). (B) Experimental (histogram) and theoretical (black line) distribution of cell curvature at times 0, 5, and 10 h.
Because different cells start with somewhat different curvatures, the initial distribution of cell curvatures in the population is not uniform. For simplicity we use a Gaussian distribution with mean C0 and standard deviation σ0 to describe the curvature of the cells in the liquid culture (before putting them on the pad). Placing the cells on an agarose-padded slide for microscopy introduces a small degree of random curvature. For this nonspecific random curvature we used a Gaussian distribution with zero mean and standard deviation σr. Because only the absolute value of the curvature can be measured, this effect causes the mean curvature of the population to be slightly larger than zero even after all the cells in the liquid culture have become straight. Taking into account these various effects (SI Appendix, Section III), and assuming the crescentin structure is disrupted at time t = 0, the probability density function of the measured curvature of an individual cell becomes
 |
[3] |
where C > 0 is the measured curvature,  , and
, and 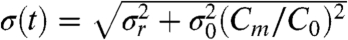 . Before the disruption of the filament, ρ(C,t < 0) = ρ(C,t = 0). We can extend the analysis to the initial data points following induction of the dominant-negative crescentin mutant by considering the fraction of cells n(t) with the crescentin structure still intact at time t: n(0) = 0.94, n(1 h) = 0.31, and n(≥2 h) ≈ 0 (numbers are taken from Fig. 2D in ref. 3). This effect is taken into account by convolving ρ(C,t) with the fraction of cells in which the filament is being disrupted at a given time point; i.e.,
  . We fitted ρΣ(C,t) to each replicate of our experiment using the Maximum Likelihood Estimation method (26) (SI Appendix, Section III). As shown in Fig. 2 for one of the 3 experiments chosen at random, these equations fit the mean (Fig. 2A) and the distribution (Fig. 2B) of cell curvature in the experiment as a function of time with a single set of parameter values.
For each of the three replicates of the experiment, we simultaneously determined the doubling time τ1/2 of the population, measured by optical density, and the decay time (e-folding time) of the curvature τ. From these measurements we extracted the growth rate A = ln 2/τ1/2 and the straightening coefficient S = 1/(Aτ). The errors of the fit to an individual experiment were much smaller than variations between experiments. Accordingly, we quote below the mean values obtained from the 3 fits together with their standard error. For the decay time of the curvature we obtained τ = 313 ± 28 min. The mean and standard deviation of the initial distribution of curvature in the population yielded, C0 = 0.480 ± 0.083 μm-1 and σ0 = 0.270 ± 0.034 μm-1, respectively. For the random curvature due to immobilization on the slide, we got the standard deviation σr = 0.140 ± 0.010 μm-1. The doubling time was τ1/2 = 123 ± 3 min and therefore A = ln 2/τ1/2 = (5.6 ± 0.2) × 10-3 min-1. From AS = 1/τ, we obtained for the straightening coefficient S = 0.57 ± 0.03.
These results indicate that in our model system cells straighten at a rate that is about 57% of the growth rate A of the cells. Thus, growth mode 2 plays a significant role in this process, but interestingly it is not the only growth mode involved. The curvature-conserving growth mode 1 still accounts for about 43% of the overall growth. Understanding the molecular origin of the straightening process is important because this mechanism enables rod-shaped bacteria to remain straight even after they experience physical constraints.
Possible Mechanisms Involved in Cell Straightening.
Nonuniform cross-linking.
Recently, an interesting theoretical study proposed that a nonuniform distribution of peptide cross-links between glycan strands, or other peptidoglycan defects, could cause some of the deformations experienced by Gram-negative bacteria in response to cell wall damage and perturbations (22). Could a similar process be responsible for cell straightening? In this case the cell wall would have the same number of glycan strands on both sides, but one side would have fewer peptide cross-links, causing turgor pressure to extend it farther and thus curving the cell. Straightening would require the density of cross-links on both sides to approach each other with time. This does not appear to be the case for C. crescentus because recent experiments show that purified PG sacculi of curved C. crescentus cells are curved and show no difference in the amount of cross-linking compared to straight (crescentin-null) cells (3). Rather, the curvature in these cells is due to an asymmetry in the amount of PG (3).
Mechanical stress-dependent synthesis.
Recent experiments have shown that mechanical stress can significantly accelerate the cleavage of chemical bonds (27). Thus the rate of insertion of new material in the cell wall may depend on the local mechanical stress in the wall. For example, the geometrical arrangement of bonds and cross-links as well as their cleavage might be stress-dependent. In this scheme, nonuniform stress in the wall would lead to nonuniform PG synthesis. We calculated the mechanical stress in the wall of a curved cell considering that the PG is a highly elastic structure (28, 29) stretched by turgor pressure, which when deflated (i.e., no longer stretched by the turgor pressure) remains curved (3, 30) (SI Appendix, Section IV). We found from this calculation that both the parallel stress T∥ (aligned with the main axis) and the perpendicular stress T⊥ depend on the curvature of the cell C = 1/R (Figs. 1B and 3C). The difference in parallel stress between the outer side of the cell and the centerline is quadratic in the small parameter ε = rC = r/R [i.e., ΔT∥ = O(ε2)] whereas it is linear in ε for the perpendicular stress T⊥ [i.e., ΔT⊥ = -T⊥0ε/2 + O(ε2)], where T⊥0 is the perpendicular stress at the centerline (SI Appendix, Section IV-1). If we assume a simple linear dependency of the relative growth rate on the stress, then dLi/Lidt = A(1 ± αΔT⊥/T⊥0) where α is a proportionality coefficient that measures the sensitivity of the local growth rate with respect to the perpendicular stress (here + and - correspond to the outer line i = 1 and inner line i = 2, respectively). Comparison with Eq. 1, dLi/Lidt = A(1∓Sε), then requires that α = -εST⊥0/ΔT⊥ = 2S. For the measured S value of 0.57, we obtain α = 1.14, which means that for this mechanism to account for cell straightening a 1% deviation in the perpendicular stress would have to cause a 1.14% deviation in the growth rate. Note that parallel stress cannot have a similar effect on straightening given its quadratic dependency on curvature. To reproduce the experiments, the dependence of the growth rate on parallel stress would not just have to be stronger to compensate for the low order of dependence, but also have to be nonlinear. Although it is plausible that the cleavage of bonds and cross-links might depend on stress (27), at the moment no molecular mechanism that could cause the effect described here in a live cell has been proposed or tested experimentally.
Fig. 3.

Possible contributions to cell straightening. (A) Nonuniform cross-linking: Glycan chains and peptide links are shown assuming ideal ordering. Turgor pressure causes the cell to curve when the density of cross-links is different between the two sides of the cell. (B) Stress-dependent synthesis. Perpendicular stress is larger on the inner side of the cell than on the outer one with the difference linearly proportional to the curvature. Thus, dependency of local growth rate on perpendicular stress could cause cell straightening. (C) MreB-dependent synthesis. The helical structure of MreB implies that the number of strands is the same on all sides of a cell causing growth mode 2 if synthesis is proportional to the local amount of MreB. (D) Processivity-dependent straightening. Greater processivity causes longer new strands (white) to be incorporated, which in turn causes faster straightening. (E) Straightening coefficient S as a function of the processivity s0 of the PG synthesis. The circle corresponds to the value of S = 0.57 ± 0.03 measured experimentally in C. crescentus (Fig. 2), which was used to determine the processivity 287 ± 18 nm.
MreB-dependent synthesis.
Another possibility is that straightening depends on the involvement of the MreB cytoskeleton in cell wall synthesis (Fig. 3B). MreB forms a helical structure beneath the cytoplasmic membrane of many rod-shaped bacteria (31) and this structure is thought to serve as a scaffold for cell wall enzymes (9). Assuming that synthesis is localized near or at the MreB structure and that the structure forms a perfect helix (i.e., uninterrupted and with a relatively constant tilt with respect to the cell axis), this mechanism provides an equal number of PG synthesis sites on all the sides of a bacterium. If this were the only mechanism responsible for straightening, we would expect the straightening coefficient to tend to S = 1 instead of the S = 0.57 that we measured.
However, it is possible that the probability to start synthesis might only partially depend on the local presence of MreB. Other effects might also reconcile this mechanism with the measured value of S. For example, MreB might not form a single helix spanning the whole cell but instead it might be made of multiple helical sections, each shorter than the cell’s circumference. Dynamic behavior of the MreB structure might also play a role.
Processivity-dependent straightening.
In the remainder of this section we show theoretically that the processivity of glycan strand synthesis can directly affect the rate of straightening of a growing cell, and therefore, could be the critical mechanism that maintains straight-rod-shape (Fig. 3D). For simplicity and clarity we analyze the effect of processivity on cell straightening independently from the possible contributions of the other mechanisms mentioned above. Here we assume that the PG grows by insertion of new glycan strands parallel to existing ones in a direction that on average is perpendicular to the main cell axis (16–18). There may be some tilt in the orientation of the glycan strands based on the observation that the insertion happens in helical bands (32). Analysis of these bands in Bacillus subtilis (Fig. 1A in ref. 32), yielded an estimated tilt angle of about 10°. The correction factor to the processivity is the cosine of the tilt angle, which is about 0.984 and thus can be considered equal to 1.
The synthesis of a new strand is processive (10, 33) and the length of a new strand depends directly on the probability per unit length of synthesis termination 1/s0. In the simplest case of constant rates of elongation and termination, this process gives rise to an exponential distribution of the lengths of the new strands. The mean of this distribution is the processivity s0 expressed in units of length. Notice that the average length of the mature glycan strands should be smaller than s0, because glycan strands are often subject to cleavage during and/or after synthesis (34). However, for our analysis the important parameter is the length of newly synthesized strands (i.e., s0).
Interestingly, the fact that glycan synthesis is processive and proceeds on average perpendicularly to the cell axis directly affects the rate of straightening of a cell during growth. Assume that the rate of synthesis initiation is uniform over the cell wall—the possible contributions of a nonuniform initiation of synthesis due to cytoskeletal guidance or local stresses have been considered in the previous sections. This gives rise to two limit cases. In the case of a very low processivity, glycan synthesis is essentially proportional to the local area and we have the mode 1 (S = 0). In the opposite case of extremely high processivity (i.e., if synthesis continues around the whole circumference of the cell), an even band of material is synthesized regardless of where the synthesis started. This yields approximately equal elongation at all points of the circumference, which corresponds to the mode 2 (S = 1). In the case of an intermediate processivity (e.g., 10–30% of the cell circumference) we obtain intermediate values of S.
In the Materials and Methods (SI Appendix, Section V and Fig. S3) we demonstrate that the geometry of the problem implies a direct connection between the processivity of the PG synthesis s0 and the straightening coefficient S. We find that S is a sigmoidal function of the processivity s0 with Hill coefficient 2 and half max reached when s0 equals the radius r of the cell cross section:
 |
[4] |
The relative growth rate of the cell A depends on the processivity s0, the effective width of the inserted material ΔL0, and the rate of synthesis initiation per unit surface kinit (assumed uniform). For the three-for-one model, ΔL0 is equal to the average width corresponding to the insertion of a triplet of glycan strands and removal of one existing strand (11), but Eq. 4 holds equally well if glycan strands are synthesized singly, in which case ΔL0 is the width of one strand. For processivities smaller than the radius r the straightening coefficient increases quadratically with the processivity S ∝ (s0/r)2 and therefore is very sensitive to processivity. On the other hand, for processivities larger than the radius r the straightening coefficient becomes insensitive to the processivity and asymptotically tends to 1 (Fig. 3E).
With S = 0.57 ± 0.03 measured in Fig. 2, Eq. 4 yields the processivity s0 = (1.15 ± 0.07)r (about 18% of the circumference) (Fig. 3E). The radius of a C. crescentus cell is r = 0.25 μm and the length of a disaccharide glycan subunit is near 1.03 nm [estimated using crystal structure of α-chitin and NMR measurements of glycan fragments (35–38)]. Therefore, the processivity required to explain the observed straightening coefficient based solely on this mechanism is 287 ± 18 nm, which is equivalent to 279 ± 17 subunits.
Note that strands of this length may never exist in the cell wall. To correctly interpret this value, it is important to keep in mind that in this study, the processivity is defined as the mean number of subunits incorporated into a glycan chain from the initiation to the termination of the elongation process, when the chain cannot be extended further. As shown by Glauner and Höltje (33), glycan strand cutting activity of lytic transglycosylases is high immediately following the initiation of synthesis, so a still-growing glycan strand is likely to be cut multiple times before elongation terminates. Accordingly, the processivity is likely much longer than the final average length of the glycan strands, because it corresponds to the combined length of all the products of such cleavage.
There are no direct measurements of the processivity in C. crescentus published to date. Nevertheless a value for the processivity in E. coli can be estimated using published data (33). In this paper, Glauner and Höltje used pulse labeling with radioactive diaminopimelic acid (A2pm) to measure the fraction of mature glycan strand ends (1,6-anhydro-muramic acid-containing muropeptides) as well as the fraction of strand ends that are being elongated (phosphorylated muropeptides) at small time intervals (20–85 s) following the beginning of a pulse. From this data we extracted an estimate for the processivity of 337 subunits with an absolute lower bound of 142 subunits (SI Appendix, Section VI and Fig. S4). From the same data we could not determine an upper bound for the processivity and it is possible that the actual value may be significantly larger.
Eq. 4 also allows calculation of the initiation rate of glycan strand synthesis kinit = A/(ΔL0s0) ≈ 3 μm-2 min-1 (i.e., 3 initiation events per square micron per minute), reflecting the fact that a relatively long strand is synthesized per initiation event. [A ≈ 0.0056 min-1 and ΔL0 ≈ 5.8 nm consisting of 8 peptide bonds (28) about 0.363 nm long each (39) times 2, for 3 inserted and 1 removed strand according to the three-for-one model (11).] This estimate of the value of kinit should be considered as an estimate of the order of magnitude only, because of the high uncertainty in determining ΔL0.
Conclusions
The straightening of rod-shaped cells described here is an essential process characteristic of multiple rod-shaped bacterial species. When curved by external or internal constraints, cells lose their curvature upon release of the constraints, making this process important for the recovery of rod shape following a disturbance. Our study demonstrates that regardless of the presence of additional effects, the processivity of PG synthesis can contribute significantly to the straightening of bent rod-shaped bacteria. Our model predicts that increases in processivity will cause higher rates of straightening and vice versa. This geometric relationship provides an important constraint on any model of synthesis and organization of PG in rod-shaped bacterial cells.
In the future, experiments may be devised to test the processivity model. For example, small flaps seen in a transglycoslylase crystal structure may contribute to processivity observed in vitro (10) and could be good targets for mutations altering processivity. It might also be possible to affect processivity by reducing the availability of lipid II, a PG precursor molecule.
Processivity can in principle depend on (or even mediate the effect of) various factors such as differential stresses or MreB. For simplicity we analyzed the relationship between processivity and cell curvature when processivity is uniform across the cell. In future studies it will be interesting to investigate how the interplay between processivity and MreB affects glycan strand synthesis to yield cells that are both straight and rod-shaped. Drug-mediated disruption of MreB largely abolishes glycan strand synthesis and leads to a buildup of precursor molecules in E. coli (40). Additionally, immunoprecipitation experiments have associated MreB with MurG (41). Hence, MreB may itself function or recruit other enzymes to ensure a steady supply of precursors to the point of synthesis, abetting processivity. In B. subtilis, MreB pulls down the transglycosylase PBP1 in cell extracts (42), raising the possibility that an MreB structure could form a track for processive motion of PBPs around the cylindrical sidewall.
More generally, in this study we showed that in addition to cytoskeleton-guided localization and synthesis directionality, cells possess one extra degree of freedom to control their shape. Because it is an integral part of the cell wall synthesis machinery, processivity-dependent straightening provides the cell with a robust mechanism that ensures the conservation of straight-rod shape over generations.
Materials and Methods
Derivation of the Geometric Relationship Between S and s0.
Consider a thin segment of a curved cell of radius r and radius of curvature R as depicted in Fig. 1B. Because of the curvature, the width L of the segment varies proportionally to 1 - (r/R) cos ϕ as a function of angular position ϕ along the circumference. Thus, if the rate of PG synthesis initiation kinit is a constant per unit surface, then the rate pinit of synthesis initiation per unit length measured along the center line of the cell becomes a function of ϕ:
 |
[5] |
Next, we calculate ΔLsingle(ϕ), the average contribution to the cell length of the insertion of a new glycan strand, assuming that synthesis was initiated at some randomly chosen point of the circumference. Without loss of generality we choose this point at ϕ = 0. For a constant probability of synthesis termination 1/s0, the length of new strands is exponentially distributed with a mean length equal to the processivity s0. ΔLsingle(ϕ) is the cumulative contribution of the strands long enough to reach the position ϕ, taking into account the periodicity of the circumference and the fact that synthesis may start with equal probability 1/2 in the positive and negative ϕ direction (SI Appendix, Section V and Fig. S3): ΔLsingle(ϕ) = ΔL0(e-ϕ/ϕ0 + e(ϕ-2π)/ϕ0)/2(1 - e-2π/ϕ0). Here ΔL0 is the width of the PG strand and ϕ0 = s0/r. Convolving with Eq. 5 yields the rate of growth:
 |
[6] |
On the other hand, from Eq. 1 and the fact that  we have:
 |
[7] |
Bacterial Strains and Growth Conditions.
Cells were grown in PYE medium or M2G medium supplemented with 1% PYE (43). Log-phase cultures were used for all experiments. The xylose-inducible promoter was induced by adding 0.3% xylose to the medium. The synchrony was performed as described (44).
We used the CJW1819 strain (CB15N ∆creS ftsZ∷pBJM1) (3) for the FtsZ-depletion experiment, and the CJW2788 strain (CB15N ∆creS xylX∷pHL23PxylcreS∆L1/pMR20creS-tc) (3) for the crescentin structure disruption experiment.
Microscopy and Image Analysis.
Cells were imaged at room temperature using a Nikon TI microscope equipped with a 100× phase-contrast objective and an Andor iXon EMCCD camera. The cells were immobilized on 1% agarose-M2G pads and imaged immediately.
Cell identification, outlining, and centerline detection for the length and curvature measurements was performed using our custom-made, MATLAB-based program MicrobeTracker (http://emonet.biology.yale.edu/microbetracker). This program uses bandpass 2D Fourier filtering, morphological opening, and thresholding for the initial guess, followed by a variant of the active contour (snake) model (45) for the refinement of the shape.
The curvature of the cells was determined using the same procedure as described in (3). Briefly, the centerline of each cell was calculated and represented by a chain of equidistant points. Then an arc of a circle was fitted to the centerline of each cell and the curvature determined as the reciprocal of the radius of this circle.
Supplementary Material
Acknowledgments.
We thank Waldemar Vollmer for comments on an earlier version of this manuscript. M.T.C. was supported by the National Science Foundation Graduate Research Fellowship Program and the Mustard Seed Foundation, C.J.-W. was supported by the National Institutes of Health Grant GM076698, and T.E. was supported by an Alfred P. Sloan Foundation Fellowship.
Footnotes
The authors declare no conflict of interest.
This article is a PNAS Direct Submission.
This article contains supporting information online at www.pnas.org/lookup/suppl/doi:10.1073/pnas.1000737107/-/DCSupplemental.
References
- 1.Young KD. The selective value of bacterial shape. Microbiol Mol Biol R. 2006;70(3):660–703. doi: 10.1128/MMBR.00001-06. [DOI] [PMC free article] [PubMed] [Google Scholar]
- 2.Mannik J, Driessen R, Galajda P, Keymer JE, Dekker C. Bacterial growth and motility in sub-micron constrictions. Proc Natl Acad Sci USA. 2009;106(35):14861–14866. doi: 10.1073/pnas.0907542106. [DOI] [PMC free article] [PubMed] [Google Scholar]
- 3.Cabeen MT, et al. Bacterial cell curvature through mechanical control of cell growth. EMBO J. 2009;28(9):1208–1219. doi: 10.1038/emboj.2009.61. [DOI] [PMC free article] [PubMed] [Google Scholar]
- 4.Takeuchi S, DiLuzio WR, Weibel DB, Whitesides GM. Controlling the shape of filamentous cells of Escherichia coli. Nano Lett. 2005;5(9):1819–1823. doi: 10.1021/nl0507360. [DOI] [PMC free article] [PubMed] [Google Scholar]
- 5.Weidel W, Pelzer H. Bagshaped macromolecules—A new outlook on bacterial cell walls. Adv Enzymol Relat Areas Mol Biol. 1964;26:193–232. doi: 10.1002/9780470122716.ch5. [DOI] [PubMed] [Google Scholar]
- 6.Koch AL, Doyle RJ. Inside-to-outside growth and turnover of the wall of Gram-positive rods. J Theor Biol. 1985;117(1):137–157. doi: 10.1016/s0022-5193(85)80169-7. [DOI] [PubMed] [Google Scholar]
- 7.Ward JB, Perkins HR. The direction of glycan synthesis in a bacterial peptidoglycan. Biochem J. 1973;135(4):721–728. doi: 10.1042/bj1350721. [DOI] [PMC free article] [PubMed] [Google Scholar]
- 8.van Heijenoort J. Formation of the glycan chains in the synthesis of bacterial peptidoglycan. Glycobiology. 2001;11(3):25R–36R. doi: 10.1093/glycob/11.3.25r. [DOI] [PubMed] [Google Scholar]
- 9.Vollmer W, Bertsche U. Murein (peptidoglycan) structure, architecture and biosynthesis in Escherichia coli. Biochim Biophys Acta. 2008;1778(9):1714–1734. doi: 10.1016/j.bbamem.2007.06.007. [DOI] [PubMed] [Google Scholar]
- 10.Yuan Y, et al. Crystal structure of a peptidoglycan glycosyltransferase suggests a model for processive glycan chain synthesis. Proc Natl Acad Sci USA. 2007;104(13):5348–5353. doi: 10.1073/pnas.0701160104. [DOI] [PMC free article] [PubMed] [Google Scholar]
- 11.Höltje J-V. Three for one—A simple mechanism that guarantees a precise copy of the thin, rod-shaped sacculus of Escherichia coli. In: de Pedro MA, Höltje J-V, Loffelhardt W, editors. Bacterial Growth and Lysis: Metabilism and Structure of the Bacterial Sacculus. New York: Plenum Press; 1993. pp. 419–426. [Google Scholar]
- 12.Höltje JV. Growth of the stress-bearing and shape-maintaining murein sacculus of Escherichia coli. Microbiol Mol Biol R. 1998;62(1):181–203. doi: 10.1128/mmbr.62.1.181-203.1998. [DOI] [PMC free article] [PubMed] [Google Scholar]
- 13.Margolin W. Sculpting the bacterial cell. Curr Biol. 2009;19(17):R812–R822. doi: 10.1016/j.cub.2009.06.033. [DOI] [PMC free article] [PubMed] [Google Scholar]
- 14.den Blaauwen T, de Pedro MA, Nguyen-Disteche M, Ayala JA. Morphogenesis of rod-shaped sacculi. FEMS Microbiol Rev. 2008;32(2):321–344. doi: 10.1111/j.1574-6976.2007.00090.x. [DOI] [PubMed] [Google Scholar]
- 15.Shih YL, Rothfield L. The bacterial cytoskeleton. Microbiol Mol Biol R. 2006;70(3):729–754. doi: 10.1128/MMBR.00017-06. [DOI] [PMC free article] [PubMed] [Google Scholar]
- 16.Gan L, Chen S, Jensen GJ. Molecular organization of Gram-negative peptidoglycan. Proc Natl Acad Sci USA. 2008;105(48):18953–18957. doi: 10.1073/pnas.0808035105. [DOI] [PMC free article] [PubMed] [Google Scholar]
- 17.Verwer RW, Nanninga N, Keck W, Schwarz U. Arrangement of glycan chains in the sacculus of Escherichia coli. J Bacteriol. 1978;136(2):723–729. doi: 10.1128/jb.136.2.723-729.1978. [DOI] [PMC free article] [PubMed] [Google Scholar]
- 18.Verwer RW, Beachey EH, Keck W, Stoub AM, Poldermans JE. Oriented fragmentation of Escherichia coli sacculi by sonication. J Bacteriol. 1980;141(1):327–332. doi: 10.1128/jb.141.1.327-332.1980. [DOI] [PMC free article] [PubMed] [Google Scholar]
- 19.Wachi M, et al. Mutant isolation and molecular cloning of mre genes, which determine cell shape, sensitivity to mecillinam, and amount of penicillin-binding proteins in Escherichia coli. J Bacteriol. 1987;169(11):4935–4940. doi: 10.1128/jb.169.11.4935-4940.1987. [DOI] [PMC free article] [PubMed] [Google Scholar]
- 20.Carballido-Lopez R, et al. Actin homolog MreBH governs cell morphogenesis by localization of the cell wall hydrolase LytE. Dev Cell. 2006;11(3):399–409. doi: 10.1016/j.devcel.2006.07.017. [DOI] [PubMed] [Google Scholar]
- 21.Koch AL. Biophysics of bacterial walls viewed as stress-bearing fabric. Microbiol Rev. 1988;52(3):337–353. doi: 10.1128/mr.52.3.337-353.1988. [DOI] [PMC free article] [PubMed] [Google Scholar]
- 22.Huang KC, Mukhopadhyay R, Wen B, Gitai Z, Wingreen NS. Cell shape and cell-wall organization in Gram-negative bacteria. Proc Natl Acad Sci USA. 2008;105(49):19282–19287. doi: 10.1073/pnas.0805309105. [DOI] [PMC free article] [PubMed] [Google Scholar]
- 23.Ausmees N, Kuhn JR, Jacobs-Wagner C. The bacterial cytoskeleton: An intermediate filament-like function in cell shape. Cell. 2003;115(6):705–713. doi: 10.1016/s0092-8674(03)00935-8. [DOI] [PubMed] [Google Scholar]
- 24.Cooper S. Distinguishing between linear and exponential cell growth during the division cycle: Single-cell studies, cell-culture studies, and the object of cell-cycle research. Theor Biol Med Model. 2006;3:10. doi: 10.1186/1742-4682-3-10. [DOI] [PMC free article] [PubMed] [Google Scholar]
- 25.Mukhopadhyay R, Wingreen NS. Curvature and shape determination of growing bacteria. Phys Rev E. 2009;80(6):062901. doi: 10.1103/PhysRevE.80.062901. [DOI] [PMC free article] [PubMed] [Google Scholar]
- 26.Edwards AWF. Likelihood. 1st Ed. Cambridge: Cambridge University Press; 1972. [Google Scholar]
- 27.Liang J, Fernandez JM. Mechanochemistry: One bond at a time. ACS Nano. 2009;3(7):1628–1645. doi: 10.1021/nn900294n. [DOI] [PMC free article] [PubMed] [Google Scholar]
- 28.Vollmer W, Blanot D, de Pedro MA. Peptidoglycan structure and architecture. FEMS Microbiol Rev. 2008;32(2):149–167. doi: 10.1111/j.1574-6976.2007.00094.x. [DOI] [PubMed] [Google Scholar]
- 29.Vadillo-Rodriguez V, Schooling S, Dutcher JR. In situ characterization of differences in the viscoelastic response of individual Gram-negative and Gram-positive bacterial cells. J Bacteriol. 2009;191(17):5518–5525. doi: 10.1128/JB.00528-09. [DOI] [PMC free article] [PubMed] [Google Scholar]
- 30.Poindexter JS, Hagenzieker JG. Novel peptidoglycans in Caulobacter and Asticcacaulis spp. J Bacteriol. 1982;150(1):332–347. doi: 10.1128/jb.150.1.332-347.1982. [DOI] [PMC free article] [PubMed] [Google Scholar]
- 31.Cabeen MT, Jacobs-Wagner C. Skin and bones: The bacterial cytoskeleton, cell wall, and cell morphogenesis. J Cell Biol. 2007;179(3):381–387. doi: 10.1083/jcb.200708001. [DOI] [PMC free article] [PubMed] [Google Scholar]
- 32.Daniel RA, Errington J. Control of cell morphogenesis in bacteria: Two distinct ways to make a rod-shaped cell. Cell. 2003;113(6):767–776. doi: 10.1016/s0092-8674(03)00421-5. [DOI] [PubMed] [Google Scholar]
- 33.Glauner B, Höltje J-V. Growth pattern of the murein sacculus of Escherichia coli. J Biol Chem. 1990;265(31):18988–18996. [PubMed] [Google Scholar]
- 34.Höltje JV, Mirelman D, Sharon N, Schwarz U. Novel type of murein transglycosylase in Escherichia coli. J Bacteriol. 1975;124:1067–1076. doi: 10.1128/jb.124.3.1067-1076.1975. [DOI] [PMC free article] [PubMed] [Google Scholar]
- 35.Braun V, Gnirke H, Henning U, Rehn K. Model for the structure of the shape-maintaining layer of the Escherichia coli cell envelope. J Bacteriol. 1973;114(3):1264–1270. doi: 10.1128/jb.114.3.1264-1270.1973. [DOI] [PMC free article] [PubMed] [Google Scholar]
- 36.Carlstrom D. The polysaccharide chain of chitin. Biochim Biophys Acta. 1962;59:361–364. doi: 10.1016/0006-3002(62)90185-3. [DOI] [PubMed] [Google Scholar]
- 37.Labischinski H, Barnickel G, Bradaczek H, Giesbrecht P. On the secondary and tertiary structure of murein. Low and medium-angle X-ray evidence against chitin-based conformations of bacterial peptidoglycan. Eur J Biochem. 1979;95(1):147–155. doi: 10.1111/j.1432-1033.1979.tb12949.x. [DOI] [PubMed] [Google Scholar]
- 38.Meroueh SO, et al. Three-dimensional structure of the bacterial cell wall peptidoglycan. Proc Natl Acad Sci USA. 2006;103(12):4404–4409. doi: 10.1073/pnas.0510182103. [DOI] [PMC free article] [PubMed] [Google Scholar]
- 39.Creighton TE. Proteins. 2nd Ed. New York: Freeman; 1992. p. 6. [Google Scholar]
- 40.Uehara T, Park JT. Growth of Escherichia coli: Significance of peptidoglycan degradation during elongation and septation. J Bacteriol. 2008;190(11):3914–3922. doi: 10.1128/JB.00207-08. [DOI] [PMC free article] [PubMed] [Google Scholar]
- 41.Mohammadi T, et al. The essential peptidoglycan glycosyltransferase MurG forms a complex with proteins involved in lateral envelope growth as well as with proteins involved in cell division in Escherichia coli. Mol Microbiol. 2007;65(4):1106–1121. doi: 10.1111/j.1365-2958.2007.05851.x. [DOI] [PMC free article] [PubMed] [Google Scholar]
- 42.Kawai Y, Daniel RA, Errington J. Regulation of cell wall morphogenesis in Bacillus subtilis by recruitment of PBP1 to the MreB helix. Mol Microbiol. 2009;71(5):1131–1144. doi: 10.1111/j.1365-2958.2009.06601.x. [DOI] [PubMed] [Google Scholar]
- 43.Ely B. Genetics of Caulobacter crescentus. Methods Enzymol. 1991;204:372–384. doi: 10.1016/0076-6879(91)04019-k. [DOI] [PubMed] [Google Scholar]
- 44.Evinger M, Agabian N. Envelope-associated nucleoid from Caulobacter crescentus stalked and swarmer cells. J Bacteriol. 1977;132(1):294–301. doi: 10.1128/jb.132.1.294-301.1977. [DOI] [PMC free article] [PubMed] [Google Scholar]
- 45.Kass M, Witkin A, Terzopoulos D. Snakes: Active contour models. Int J Comput Vision. 1988;1:321–331. [Google Scholar]
Associated Data
This section collects any data citations, data availability statements, or supplementary materials included in this article.