

Abstract
Background
Duchenne muscular dystrophy (DMD) is a fatal muscle wasting disorder caused by mutations in the dystrophin gene. DMD has a complex and as yet incompletely defined molecular pathophysiology hindering development of effective ameliorative approaches. Transcriptomic studies so far conducted on dystrophic cells and tissues suffer from non-specific changes and background noise due to heterogeneous comparisons and secondary pathologies. A study design in which a perfectly matched control cell population is used as reference for transcriptomic studies will give a much more specific insight into the effects of dystrophin deficiency and DMD pathophysiology.
Results
Using RNA interference (RNAi) to knock down dystrophin in myotubes from C57BL10 mice, we created a homogenous model to study the transcriptome of dystrophin-deficient myotubes. We noted significant differences in the global gene expression pattern between these myotubes and their matched control cultures. In particular, categorical analyses of the dysregulated genes demonstrated significant enrichment of molecules associated with the components of muscle cell contractile unit, ion channels, metabolic pathways and kinases. Additionally, some of the dysregulated genes could potentially explain conditions and endophenotypes associated with dystrophin deficiency, such as dysregulation of calcium homeostasis (Pvalb and Casq1), or cardiomyopathy (Obscurin, Tcap). In addition to be validated by qPCR, our data gains another level of validity by affirmatively reproducing several independent studies conducted previously at genes and/or protein levels in vivo and in vitro.
Conclusion
Our results suggest that in striated muscles, dystrophin is involved in orchestrating proper development and organization of myofibers as contractile units, depicting a novel pathophysiology for DMD where the absence of dystrophin results in maldeveloped myofibers prone to physical stress and damage. Therefore, it becomes apparent that any gene therapy approaches for DMD should target early stages in muscle development to attain a maximum clinical benefit. With a clear and specific definition of the transcriptome of dystrophin deficiency, manipulation of identified dysregulated molecules downstream of dystrophin may lead to novel ameliorative approaches for DMD.
Background
Duchenne Muscular Dystrophy (DMD) is a progressive and fatal muscle wasting disease, which occurs in 1 of 3500 male births worldwide [1]. DMD and related animal models such as that of the mdx mouse [2,3] are caused by mutations in the dystrophin gene that result in absence of the largest dystrophin isoform (Dp427) from skeletal, cardiac and smooth muscles, and the CNS [4,5]. While studies on whole animal and cell culture models of dystrophin deficiency have allowed significant progress in unraveling the molecular pathology underlying DMD, the precise pathophysiology remains poorly understood [6,7]. The cytoskeletal dystrophin protein exhibits complex interactions with many other structural and signalling molecules at the muscle sarcolemma, and its absence is associated with a diverse range of molecular and cellular disturbances [8,9]. For instance, alongside the absence of dystrophin, the stability and cellular localisation of many other proteins - the so called dystrophin associated proteins (DAPs) - are perturbed. These findings all suggest a complex primary and secondary pathophysiology associated with dystrophin deficiency.
Transcriptomic studies of diseased versus normal muscles could be very informative for understanding DMD pathophysiology. A number of groups have noted differences in the gene expression patterns between dystrophic muscle tissues of DMD patients and those of dystrophin-proficient individuals, or mdx compared to C57BL/6 (normal) mice [10-21]. However, studies of the direct and primary molecular sequelae of dystrophin deficiency in intact animals and tissues are complicated by secondary pathologies resulting from degenerative, regenerative, fibrotic and inflammatory changes. Cellular models of dystrophin deficiency can be complicated by non-clonal comparisons of cell lines, or by heterogeneous cellular composition (with variable myoblast, fibroblast, endothelial cell, and infiltrating blood cell content) when comparing deficient and control primary cultures. The optimum cellular model with which to evaluate the direct and primary molecular events associated with dystrophin deficiency involves a system in which expression of the protein can be manipulated experimentally in a cell autonomous manner.
RNA interference (RNAi) technology allows expression of a single gene transcript and protein product to be efficiently and specifically reduced or knocked down at the mRNA level [22]. This technique provides the opportunity to study these effects under controllable conditions, and is especially useful for multifunctional proteins such as dystrophin.
Here, we describe the specific and immediate effect of dystrophin deficiency on global gene transcription in primary muscle cell cultures in which dystrophin had efficiently been knocked down by RNAi. This approach provided the opportunity to compare the transcriptomes in dystrophin-deficient primary myotube cultures to that of their corresponding clonal cell populations, avoiding the heterogeneity routinely associated with primary cell cultures and tissue biopsies. Our results suggest that in striated myofibers, dystrophin is mainly required for proper development and organization of the contractile unit, implicating a novel pathophysiology for DMD. Genes associated with ion channels, metabolic pathways and kinases were also dysregulated in response to dystrophin deficiency. Abnormal expression of certain genes detected in our model could potentially explain conditions and endophenotypes associated with dystrophin deficiency, such as dysregulation of calcium homeostasis or cardiomyopathy.
Results
Transcriptome of dystrophin-deficient myotubes
We previously reported potent and specific knockdown of dystrophin using four different small interferring RNAs (siRNAs) [23]. Here, we used the most effective siRNA (referred to as D2) to knock down dystrophin in myotubes prepared from C57BL10 mice limb muscles. Briefly, siRNA transfections were performed at 100 nM on days two and four post-seeding and cells were collected on day six post-seeding, forty-eight hours after induction of differentiation (see Materials & Methods for further details). Figure 1 shows a western blot analysis of dystrophin expression in myotubes used for transcriptomic studies. This experiment showed close to zero expression of dystrophin in myotubes treated with the D2 siRNA, while this protein was well expressed both in myotubes treated with an siRNA targeting firefly GL2 luciferase (treatment control) and in untreated myotubes. No detectable change in myotube morphology was observed under phase-contrast microscopy, but immunostaining revealed an almost complete lack of dystrophin in D2 siRNA-treated myotubes (data not shown). In order to perform the transcriptomic analysis, we generated 7 biological replicates of primary myoblasts treated with the siRNA targeting dystrophin (D2), 7 biological replicates of primary myoblasts treated with the siRNA targeting luciferase (GL2, as treatment controls), and 4 replicates of untreated primary myoblasts (Untr.). The biological replicates were prepared and processed on 4 separate occasions, hence acting as independent replicates, too.
Figure 1.
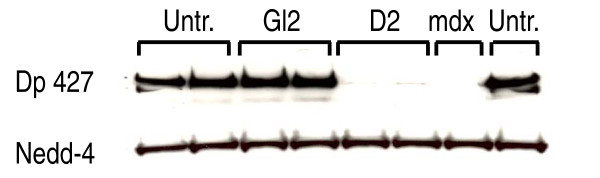
Western blot showing strong dystrophin (Dp427) downregulation in myotubes treated with siRNA targeting dystrophin (D2). The samples were obtained directly from those used for gene expression arrays. Untr.: Untreated myotubes. GL2: Myotubes treated with siRNA targeting firefly luciferase. D2: Myotubes treated with an optimal siRNA targeting dystrophin (referred to as D2 in a previous study [23]). mdx: Myotubes prepared from muscles from mdx mice. Nedd-4: loading control.
We used Illumina gene expression arrays (Mouse whole genome-6 v1.1) to evaluate the myotubes under investigation, and analysed the data to determine the differentially expressed genes (see Materials & Methods for details). We made two statistical comparisons: 1) global gene expression in myotubes knocked down for dystrophin compared to the untreated myotubes (list 1); and 2) global gene expression in firefly GL2 siRNA-treated myotubes compared to the untreated myotubes (list 2). By removing from list 1 the genes in common between lists 1 and 2, we created a main list of genes changed specifically by dystrophin knockdown (Additional file 1). Then we made a final list of dysregulated genes by compiling those from the main list that changed by more than 1.5 fold (with an adjusted (Benjamini-Hochberg multiple testing corrected) p values less than 0.05) (Additional file 2), and those that changed in both comparisons but in different directions (Additional file 2, italics; see Additional file 3 for all genes common to list 1 and 2). To confirm the array data, we performed RT-qPCR on six of the dysregulated genes. As demonstrated in Figure 2, RT-qPCR confirmed gene expression changes and corroborated the array data.
Figure 2.

RT-qPCR experiment supporting expression array data. For RT-qPCR, the cDNAs made using 4 untreated biological replicates were pooled in equal amounts and used in triplicate per experiment as a reference. For each of the treatments (dystrophin knockdown (KD) or GL2 siRNA), the biological replicates from two treatment occasions (two biological replicates per each treatment occasion) were used. For each treatment occasion, the cDNAs from each biological replicate were mixed in equal amounts and used in triplicate. Relative gene expression was calculated by the ΔΔCT method. Y axis: the normalised ratio (fold change) of expression between the treated samples (Dystrophin KD or GL2 siRNA control) versus untreated samples. Error bars indicate mean +/- 1 SD.
Many genes of interest with respect to skeletal muscle function or the DMD phenotype can be identified amongst the dysregulated genes displayed in Additional file 2. At first glance, several genes that have been associated with various myopathies are recognised amongst the differentially regulated genes. These include kyphoscoliosis peptidase (Ky) [24], cofilin 2 (Cfl2) [25,26], calpain 3 (Capn3) [27], titin-cap (Tcap) [28,29] and phosphofructokinase (Pfkm) [30-32] (see Table 1 for all genes from Additional file 2 cited in the text).
Table 1.
Gene differentially regulated by dystrophin deficiency and cited in the text
| Entrez ID | Gene Symbol | Gene Name | Fold Change | Adjusted p value |
|---|---|---|---|---|
| 66211 | Rpl3l | ribosomal protein l3-like | -6.3 | 3.80E-08 |
| 13405 | Dmd | dystrophin, muscular dystrophy | -3.7 | 9.54E-08 |
| 19293 | Pvalb | parvalbumin | -6.1 | 9.54E-08 |
| 78785 | Clip4 | CAP-GLY domain containing linker protein family, member 4 | -3 | 9.54E-08 |
| 16716 | Ky | kyphoscoliosis peptidase | -4.1 | 1.48E-07 |
| 59011 | Myoz1 | myozenin 1 | -3.6 | 2.46E-07 |
| 19130 | Prox1 | prospero-related homeobox 1 | 3 | 2.55E-05 |
| 233199 | Mybpc2 | myosin binding protein c, fast-type | -2.3 | 3.81E-05 |
| 12335 | Capn3 | calpain 3 | -2.1 | 3.82E-05 |
| 18682 | Phkg1 | phosphorylase kinase gamma 1 | -3.9 | 3.82E-05 |
| 14403 | Gabrd | gamma-aminobutyric acid (gaba-a) receptor, subunit delta | -4.2 | 8.94E-05 |
| 243912 | Hspb6 | heat shock protein, alpha-crystallin-related, b6 | -1.9 | 1.77E-04 |
| 140781 | Myh7 | myosin, heavy polypeptide 7, cardiac muscle | 2.7 | 2.10E-04 |
| 21393 | Tcap | titin-cap | -1.7 | 2.45E-04 |
| 76469 | Cmya5 | cardiomyopathy associated 5 | -1.8 | 2.74E-04 |
| 380698 | Obscn | obscurin, cytoskeletal calmodulin and titin-interacting RhoGEF | -2 | 3.19E-04 |
| 76884 | Cyfip2 | riken cdna 1500004i01 gene | -2.1 | 4.12E-04 |
| 12632 | Cfl2 | cofilin 2, muscle | -1.7 | 8.51E-04 |
| 100072 | Camta1 | calmodulin binding transcription activator 1 | -1.6 | 8.96E-04 |
| 20266 | Scn1b | sodium channel, voltage-gated, type i, beta | -1.7 | 9.09E-04 |
| 18642 | Pfkm | phosphofructokinase, muscle | -1.5 | 1.10E-03 |
| 11448 | Chrne | cholinergic receptor, nicotinic, epsilon polypeptide | -3.4 | 1.16E-03 |
| 74769 | Pik3cb | phosphatidylinositol 3-kinase, catalytic, beta polypeptide | 1.5 | 1.25E-03 |
| 12372 | Casq1 | calsequestrin 1 | -1.6 | 3.27E-03 |
| 14245 | Lpin1 | lipin 1 | -1.5 | 3.79E-03 |
| 109731 | Maob | monoamine oxidase b | -1.5 | 4.95E-03 |
| 12575 | Cdkn1a | cyclin-dependent kinase inhibitor 1a (p21) | -1.5 | 6.65E-03 |
| 14555 | Gpd1 | glycerol-3-phosphate dehydrogenase 1 (soluble) | -1.7 | 6.65E-03 |
| 19309 | Pygm | muscle glycogen phosphorylase | -1.6 | 7.55E-03 |
| 26409 | Map3k7 | mitogen activated protein kinase kinase kinase 7 (Synonym Tak1) | 1.5 | 1.22E-02 |
| 338372 | Map3k9 | mitogen-activated protein kinase kinase kinase 9 | 1.8 | 1.66E-02 |
| 11474 | Actn3 | actinin alpha 3 | -1.6 | 1.75E-02 |
| 20661 | Sort1 | sortilin 1 | 1.6 | 1.82E-02 |
This table details genes from Additional file 2 that were cited in the text. Table sorted by ascending adjusted p values. Italicized genes are those dysregulated in dystrophin siRNA treated samples versus untreated samples, but changing in the opposite direction in the GL2 siRNA treated versus untreated samples (see result section for details).
With respect to the significance of change, dystrophin transcript is positioned to the top of the list of significantly changing genes, only next to ribosomal protein L3-like (Rpl3l). 'CAP-GLY domain-containing linker protein family, member 4' (Clip4) and Parvalbumin (Pvalb) are two other transcripts with associated p values similar to that of dystrophin transcript.
Ion channels [33], metabolic pathways [34-37] and kinases-related signaling pathways [38-40] are affected in dystrophin-deficient muscle cells. Several genes of each group were dysregulated in dystrophin-deficient myotubes in our experiment. For ion channels, Scn1b is downregulated both as reported by Pescatori et. al. [14] and in our experiments. Pescatori et. al. used muscles from children affected with DMD under the age of 2 - before any overt skeletal muscle pathology - when one would expect to see a transcriptome related to dystrophin deficiency without secondary complications. Among metabolism associated molecules, 'muscle glycogen phosphorylase' (Pygm), 'phosphorylase kinase gamma 1' (Phkg1), 'phosphofructokinase, muscle' (Pfkm), 'glycerol-3-phosphate dehydrogenase 1' (Gpd1) were reproducibly downregulated in our experiment and as reported by the aforementioned group [14]. Further, despite different species being studied, we found comparable results for 'cholinergic receptor, nicotinic, epsilon polypeptide' (Chrne), 'cylin-dependent kinase inhibitor 1A' (Cdkn1a), calpain 3 (Capn3), lipin1 (Lpin1) and 'monoamine oxidase B' (Maob).
Transcripts of several kinases were dysregulated in our model; amongst them, 'mitogen-activated protein kinase kinase kinase 7' (Map3k7), 'mitogen-activated protein kinase kinase kinase 9' (Map3k9) and 'phosphatidylinositol 3-kinase, catalytic, beta polypeptide' (Pik3cb) and 'AP2-associated kinase 1 (Aak1)' all upregulated. Similarly, PI3K/Akt pathway is reported to be activated in pre-necrotic (<2 weeks) diaphragm and in myotubes from mdx mice [38]
Heart and brain are affected in DMD, in addition to skeletal muscles. There are several genes identified in our experiment that could potentially participate in the development of heart and brain associated endophenotypes in DMD. These genes include 'Beta myosin heavy chain' (Myh7), Obscurin (Obscn), 'heat shock protein, alpha-crystalline-related B6' (Hspb6), titin (Ttn), titin-cap (Tcap), and myospryn (Cmya5) for heart associated phenotypes, and 'Cytoplasmic fragile X mental retardation (Fmr1) interacting protein 2' (Cyfip2), 'gamma-aminobutyric acid A receptor, delta' (Gabrd), and 'sodium channel, voltage-gated, type I, beta' (Scn1b) (Table 1) for brain associated phenotypes.
Gene Ontology and Ingenuity pathway analyses
In order to have a systematic view on gene categories altered by dystrophin deficiency, we used the tool provided by the Database for Annotation, Visualisation and Integrated Discovery (DAVID) [41,42] to conduct Gene Ontology (GO) analysis on the genes listed in Additional file 2. As demonstrated in Table 2, a stringent approach to considering overrepresented GO terms (>2 fold enrichment with adjusted p values < 0.1) indicated enrichment for genes involved in muscle contraction, such as those contributing to sarcomere and ion channels structures. Furthermore, a less stringent but still significant (p < 0.05) approach revealed overrepresentation of molecules involved in metabolic pathways and kinases (Additional file 4).
Table 2.
Gene ontology (GO) analysis of differentially expressed genes listed in the Additional file 2
| Category | Term | Genes | FE | p val. | Adj. p val. |
|---|---|---|---|---|---|
| Cellular Component | GO:0044449 contractile fiber part | OBSCN, DMN, DMD, MYBPC2, TCAP, MYH13, MYH1, LDB3, ACTN3, MYBPC3, MYH7, PYGM, MYH4, TPM3, | 13.83 | 1.74E-11 | 6.77E-09 |
| Cellular Component | GO:0030017 sarcomere | OBSCN, DMN, DMD, MYBPC2, TCAP, MYH13, MYH1, LDB3, ACTN3, MYBPC3, MYH7, PYGM, MYH4, TPM3, | 14.25 | 1.16E-11 | 9.06E-09 |
| Cellular Component | GO:0030016 myofibril | OBSCN, DMN, DMD, MYBPC2, TCAP, MYH13, MYH1, LDB3, ACTN3, MYBPC3, MYH7, PYGM, MYH4, TPM3, | 12.89 | 4.47E-11 | 1.16E-08 |
| Cellular Component | GO:0043292 contractile fiber | OBSCN, DMN, DMD, MYBPC2, TCAP, MYH13, MYH1, LDB3, ACTN3, MYBPC3, MYH7, PYGM, MYH4, TPM3, | 12.38 | 7.61E-11 | 1.48E-08 |
| Cellular Component | GO:0005863 striated muscle thick filament | MYH7, OBSCN, MYH4, MYBPC2, MYH13, MYH1, MYBPC3, | 36.18 | 1.55E-08 | 2.01E-06 |
| Cellular Component | GO:0032982 myosin filament | MYH7, OBSCN, MYH4, MYBPC2, MYH13, MYH1, MYBPC3, | 36.18 | 1.55E-08 | 2.01E-06 |
| Cellular Component | GO:0005859 muscle myosin complex | MYH7, OBSCN, MYH4, MYBPC2, MYH13, MYH1, MYBPC3, | 33.60 | 2.67E-08 | 2.98E-06 |
| Cellular Component | GO:0016460 myosin II complex | MYH7, OBSCN, MYH4, MYBPC2, MYH13, MYH1, MYBPC3, | 29.40 | 6.95E-08 | 6.78E-06 |
| Molecular Function | GO:0008092 cytoskeletal protein binding | OBSCN, DMD, MYBPC2, MYH13, MYH1, ACTN3, EPB4.1L4B, MYBPC3, DCX, MTAP7, MYH7, MYH4, MYOZ1, TMOD4, PACSIN1, PSTPIP2, TPM3, SCIN, CFL2, SPNB1, | 3.79 | 1.37E-06 | 3.63E-03 |
| Cellular Component | GO:0030018 Z disc | DMN, OBSCN, PYGM, DMD, TCAP, LDB3, | 13.44 | 7.16E-05 | 5.57E-03 |
| Cellular Component | GO:0031674 I band | DMN, OBSCN, PYGM, DMD, TCAP, LDB3, | 11.52 | 1.54E-04 | 1.08E-02 |
| Cellular Component | GO:0005856 cytoskeleton | DMN, OBSCN, TTL, MYBPC2, MYH13, MYH1, ABI2, ACTN3, EPB4.1L4B, MTAP7, KRT18, TMOD4, PSTPIP2, CFL2, TPM3, DYNLRB2, GAN, DMD, LDB3, MYBPC3, DCX, MYH7, SGCG, KY, MYH4, MYOZ1, SCIN, SPNB1, | 2.16 | 2.14E-04 | 1.27E-02 |
| Cellular Component | GO:0016459 myosin complex | MYH7, OBSCN, MYH4, MYBPC2, MYH13, MYH1, MYBPC3, | 8.11 | 2.09E-04 | 1.35E-02 |
| Biological Process | GO:0003012 muscle system process | MYH7, MYH4, MYBPC2, CASQ1, KCNMA1, MYH13, MYH1, TPM3, ACTN3, MYBPC3, | 7.63 | 5.92E-06 | 1.51E-02 |
| Biological Process | GO:0006936 muscle contraction | MYH7, MYH4, MYBPC2, CASQ1, KCNMA1, MYH13, MYH1, TPM3, ACTN3, MYBPC3, | 7.63 | 5.92E-06 | 1.51E-02 |
| Molecular Function | GO:0031420 alkali metal ion binding | KCNC1, KCNA7, SCN3B, SCN1B, TTL, SLC9A7, ATP1B2, IMPA2, KCNMA1, KCNK3, SLC24A5, GMPR, | 4.82 | 3.95E-05 | 5.10E-02 |
| Molecular Function | GO:0030955 potassium ion binding | KCNC1, KCNA7, TTL, SLC9A7, ATP1B2, KCNMA1, KCNK3, SLC24A5, GMPR, | 6.08 | 1.13E-04 | 7.22E-02 |
| Molecular Function | GO:0003779 actin binding | DMD, MYBPC2, MYH13, MYH1, ACTN3, MYBPC3, MYH7, MYH4, TMOD4, PSTPIP2, TPM3, SCIN, CFL2, SPNB1, | 3.77 | 8.93E-05 | 7.59E-02 |
DAVID tool was used for this analysis. Only terms with Benjamini-Hochberg adjusted p values < 0.1 and Fold Enrichment (FE) greater than 2 are displayed. Table sorted by ascending adjusted p values.
We used Ingenuity Pathway Analysis (IPA) (Ingenuity® Systems, http://www.ingenuity.com) to further investigate the networks and functions possibly affected in dystrophic muscles. Among the genes in Additional file 2, IPA identified 229 network-eligible genes and suggested 14 main gene networks as being dysregulated by dystrophin deficiency (Additional file 5). Moreover, IPA discovered very significant enrichment (adjusted p value = 0.0006) of molecules involved in muscle contraction as well as significant enrichment (adjusted p value < 0.05) of other molecules involved in muscle (skeletal and cardiac) functions and disorders, metabolism of carbohydrates and neurological disorders amongst differentially expressed genes in our model (Table 3). IPA also indicated enrichment (adjusted p value < 0.05) of genes involved in actin cytoskeletal and calcium signaling canonical pathways (Table 4).
Table 3.
Top functions and disorders predicted by IPA to be affected by dystrophin deficiency
| Function or Disorder | Molecules | Adjusted p value |
|---|---|---|
| contraction of muscle | ACTN3, CASQ1, CHRNE, CKMT2, EGF, GJA5, HSPB6, KCNMA1, MYBPC1, MYBPC2, MYBPC3, MYH1, MYH7, MYLK2, TMOD4 | 6.33E-04 |
| atrophy of muscle cells | ACHE, FBXO32, PPARGC1A | 1.27E-02 |
| skeletal and muscular disorder | ACHE, ACTN3, AIG1, ALKBH8, ARPP-21, BAALC, BLNK, CACNA2D1, CAMK2B, CAMTA1, CAPN3, CASQ1, CDC42BPA, CDH13, CDKN1A, CENPM, CFL2, CHRNE, CLIP4, COL23A1, CYFIP2, DCLK3, DMD, DNAJB6, GABRD, GAN, GIGYF2, GPD1, HTR2B, IL12A, IMPA2, IP6K3, KCNC1, KCNMA1, KCNN3, LDB3, LPIN1, MAOB, MLF1, MLLT3, MYBPC1, MYH7, MYH8, MYT1L, NDRG2, NOG, PADI2, PFKM, PKD1L1, PPARGC1A, PVALB, RCSD1, SCN1B, SCN3B, SERPINB1, SGCG, SORT1, SPTB, STARD10, TBC1D4, TCAP, TNRC6B, TP53BP1, TPM3, UCK2, WBSCR17, WFDC1, XK | 1.46E-02 |
| cardiovascular disorder | ABI2, ACHE, ACTN3, ARHGAP20, BLNK, CACNA2D1, CAMK2B, CAMTA1, CDC42BPA, CDH13, CDKN1A, CHRNA10, CHRNE, COL23A1, CSRNP3, CYFIP2, DMD, ENTPD3, FAM65B, GABRD, GAN, GJA5, GRHL1, HERC1, HSD11B1, HTR2B, IL12A, IMPA2, KCNA7, KCNC1, KCNK3, KCNMA1, KCNN3, KIAA1409, MALL (includes EG:7851), MAOB, MLF1, MSI2, MYBPC1, MYBPC3, MYH7, MYH8, MYLK2, NPPB, PPARGC1A, PSTPIP2, PTPRO, RCSD1, SCN1B, SGCG, SLC46A3, SLC9A2, SPTB, TBC1D4, TCAP, TNRC6B, WBSCR17, XK | 2.07E-02 |
| cardiomyopathy | GJA5, HTR2B, MYBPC3, MYH7, MYLK2, NPPB, PPARGC1A, SGCG, TCAP | 2.07E-02 |
| variant angina | CACNA2D1, RCSD1, SGCG | 2.07E-02 |
| Huntington's disease | ACTN3, AIG1, ARPP-21, CAMK2B, CASQ1, CYFIP2 (includes EG:26999), GABRD, GPD1, KCNN3, MAOB, MLF1, MYH7, MYT1L, PFKM, PPARGC1A, PVALB, SCN1B, SCN3B, SORT1, STARD10, TPM3, UCK2 | 3.09E-02 |
| disease of muscle | CHRNE, FBXO32, MYH1, MYH4, PPARGC1A, SGCG, TPM3 | 4.23E-02 |
| fatigue | ACHE, CHRNE, PPARGC1A, SCN1B | 4.23E-02 |
| developmental disorder of muscle | FBXO32, MYH1, MYH4, SGCG, TPM3 | 4.39E-02 |
| pervasive developmental disorders | ACHE, CHRNA10, CHRNE, GABRD, HTR2B, SCN1B, SCN3B | 4.39E-02 |
| deformation of nucleus | CDKN1A, MAP7 | 4.39E-02 |
| metabolism of carbohydrate | CMAH, GPD1, IMPA2, IP6K3, NISCH, PDK4, PFKM, PHKG1, PPARGC1A, PPP1R3C, PYGM, SGSH, SOCS4, ST3GAL6 | 4.39E-02 |
| morphogenesis of cardiac muscle | MYBPC3, MYH7, MYLK2, TCAP | 4.63E-02 |
| muscular dystrophy | CAPN3, DMD, MYH7, SGCG, TCAP | 4.69E-02 |
| neurological disorder | ACHE, ACTN3, AIG1, ALKBH8, ARPP-21, BAALC, BLNK, CACNA2D1, CAMK2B, CAMTA1, CAPN3, CASQ1, CATSPER4, CDC42BPA, CDH13, CHRNA10, CHRNE, CLIP4, CNKSR1, COL23A1, CYFIP2, DFNA5, DMD, DNAJB6, DNAJC5, EGF, EYA3, FZD3, GABRD, GAN, GDAP1, GIGYF2, GPD1, HTR2B, IGFN1, IL12A, IMPA2, KCNC1, KCNMA1, KCNN3, KIAA1409, KPNA6, LRCH1, MAOB, MLF1, MLLT3, MSI2, MT3, MYH7, MYH8, MYT1L, NDRG2, OPN3, P2RY2, PADI2, PFKM, PKD1L1, PLA2G4E, PPARGC1A, PPP1R14C, PVALB, SCN1B, SCN3B, SERPINB1, SGCG, SORT1, SPTB, STARD10, SUSD4, TMEM108, TPM3, TTC7B, TTLL7, UCK2, WBSCR17, WWC1, XK | 4.80E-02 |
| developmental process of muscle | ACHE, CAPN3, CDKN1A, DMD, KY, MYBPC3, MYH7, MYLK2, MYOZ1, PDK4, SGCG, TCAP | 4.80E-02 |
Genes listed in the Additional file 2 were used for this analysis. Only functions and disorders with Benjamini-Hochberg corrected p values < 0.05 are displayed.
Table 4.
Top predicted (by IPA) canonical pathways to be affected in dystrophin-deficient muscle cells
| Canonical Pathways | Molecules | Adj p value |
|---|---|---|
| Actin Cytoskeleton Signaling | MYH4, ABI2, CYFIP2, MYH8, CFL2, MYLK2, EGF, PIK3CB, MYH7, ACTN3, MYH1 | 2.45E-02 |
| Calcium Signaling | MYH4, TPM3, MYH8, CASQ1, CHRNE, MYH7, CHRNA10, CAMK2B, MYH1 | 3.390E-02 |
Only Pathways with Benjamini-Hochberg corrected p values under 0.05 are displayed.
miRNAs at the dysregulated genes loci
To evaluate possible indirect microRNA (miRNA) dysregulation by dystrophin deficiency, we investigated the possible presence of miRNA loci at the intronic regions of the genes displayed in Additional file 2. Table 5 details the miRNAs identified to happen at the dysregulated genes loci. miRbase miRNA data base (Sanger Inst., UK [43]) Release 12 was used for this analysis.
Table 5.
Genes from Additional file 2 with miRNA loci at their intronic regions
| Gene | miRNA |
|---|---|
| Arpp21 | mmu-miR-128-2 |
| Dusp19 | mmu-miR-684-1 |
| Klf9 | mmu-miR-1192 |
| Myh7 | mmu-miR-208b |
| R3hdm1 | mmu-miR-128-1 |
miRbase miRNA database, Release 12 was used for this analysis.
Discussion
Despite much effort toward disentangling the molecular basis of DMD pathophysiology, it remains unclear how the absence of one molecule results in a complicated phenotype such as DMD. This is partly due to the complexity of dystrophin interactions in muscle cells. As shown by others and in the present work, the absence of dystrophin starts a cascade of derangements in several networks. This results in underdeveloped muscles, prone to the adverse effects of physical stresses that add another level of molecular complexity to the disorder. To capture the most direct effect of dystrophin deficiency, one has to get as close as possible to the early myogenesis stages when dystrophin naturally starts to be expressed. Having this in mind, we decided to use primary muscle cultures to study early myogenesis in the absence of dystrophin, by comparing the transcriptome of dystrophin-deficient cells to that of their normal counterparts shortly after induction of myogenesis. Similar approaches have been taken by others; however, we designed this experiment to avoid the cellular heterogeneity associated with the other studies. Accordingly, we used RNAi to knock down dystrophin in mouse primary myotubes, and compared transcriptomes in these cells to those in the same cell population but in which dystrophin had not been targeted. We have previously shown that RNAi is a robust technique for dystrophin knockdown [23]. Here, applying dystrophin RNAi to samples used for our transcriptomic studies resulted in close to zero dystrophin expression (Figure 1). We decided to analyze samples collected 48 hours after differentiation. At that time point, we did not observe any detectable change in myotube morphology or timing of fusion. We selected this early time point in order to focus on the early myogenesis events in the presence and absence of dystrophin expression, but avoid any unrelated secondary events such as myotube rupture and culture senescence. To account for possible unrelated variations, the experiment involved biological replicates prepared on four occasions (see Materials & Methods section). This design produced meaningful results, capable of giving mechanistic insights into the conditions and endophenotypes associated with DMD.
A systematic overview of genes listed in Additional file 2 by GO and IPA analyses indicated significant overrepresentation of genes associated with the physiology of contraction, kinases, or metabolic pathways. This indicates that dystrophin is not just a molecule providing structural support to myofibers, but its presence is crucial for proper development and function of striated muscle as a contractile unit.
Other earlier studies on dystrophin deficiency support our observation that ion channels [33], kinases [38-40] and metabolic pathways [34-37] are also affected in dystrophic muscles. Here, we provide a more comprehensive view of the genes dysregulated under these categories and indicate future lines of researches to address these pathways.
Dysregulated genes involved in development of skeletal muscle phenotype
Clip4 and Pvalb had associated p values similar to that of dystrophin transcript. Though not much is known about Clip4 function, Pvalb is reported to be downregulated in DMD [44] and mdx [45] muscles. PVALB binds to Ca2+ and its calcium buffering capacity is important for calcium homeostasis during muscle contraction when high level of calcium is released into the sarcoplasm. Dysregulation of calcium homeostasis, with increased intracellular [Ca2+]i is well documented in dystrophic muscles [46]. In line with this, Calsequestrin 1 (Casq1), the gene for CASQ1 calcium-binding protein located in sarcoplasmic reticulum (SR), was also downregulated in our model of dystrophin deficiency. Supportively, DMD muscles are reported to have deficiencies in this protein [47,48]. CASQ1 is believed to be essential for the normal development of the SR, and for calcium storage and regulation inside SR [49].
Kinases can initiate long range signaling activity by activating transcription factors that in turn will activate transcription of their target genes. One way for kinases to specify their local activity is by being targeted and anchored to the region where their activity is required [50]. A single molecule such as dystrophin could regulate the expression of a variety of myogenesis-related genes through its role in anchoring other molecules in the right locale. This property can help localise kinases and/or other signaling molecules to where their functions are required for proper myogenesis. For instance, dystrobrevin [51] and synemin [52], two dystrophin associated proteins [53,54], act to localise protein kinase A (PKA). Myospryn (Cmya5), a gene downregulated in dystrophin-deficient myotubes in our model, has binding sites for PKA, anchoring it at the costamere to localise PKA signaling at this complex region [55]. Supportively, it has been documented that dystrophin deficiency results in downregulation [19,40] and mislocalisation of myospryn in skeletal muscles, resulting in lower PKA activity [40]. Nearly two thirds of the genes dysregulated in our experiments were downregulated (220 of 333, Additional file 2) indicating possible under-activity of certain myogensis-related transcription factors normally activated by kinases. In fact, dysregulation of some transcription factors in mdx skeletal muscle has already been reported [56].
Our results also suggest that myofiber type fate determination may be affected by dystrophin deficiency. Upregulation of 'prospero-related homeobox 1' (Prox1) is a key step in formation of slow muscle fibres [57]. Our samples in which dystrophin had been downregulated showed three-fold increase in Prox1. Additionally, 'Fast type myosin binding protein c' (Mybpc2) and 'alpha actinin3' (Actn3) were downregulated in dystrophin deficient myotubes in our experiment. Actn3 levels increase in accord with increases in skeletal muscle fast fibers [58]; and specific expression of Mybpc2 in fast fibre muscles has also been documented [59].
Dysregulated genes involved in development of heart phenotype
Heart is another organ which is involved by the pathogenesis of dystrophin deficiency. There are several molecules identified by our model that can potentially explain the mechanism(s) by which heart is adversely affected in DMD. For instance, obscurin, which was downregulated in our experiment, is required for proper assembly of M-band and A-band and myofibrillar clusters and for the regular alignment of the SR network around the contractile apparatus [60,61]. Hspb6, which associates with actin, is a cardioprotector under stressful conditions [62] and its mRNA was downregulated in association with dystrophin deficiency in this experiment.
Z-disc and costamere and their associated molecules function as mechanosensors in striated muscles, and their perturbation can result in architectural distortion of the affected muscle cells [63]. Hence, mutations in some genes involved in this area, such as titin and titin-cap, can result in cardiomyopathy [64,65]. Titin-cap was downregulated in dystrophin-deficient myotubes in our experiment, as was myozenin 1, another Z-disc associated protein.
Expression of the myospryn gene was downregulated by dystrophin deficiency in our model. It is also downregulated in both DMD [19] and mdx [40]; and single nucleotide polymorphisms at the myospryn locus are associated with ventricular hypertrophy [66]. This gene is expressed exclusively in heart and skeletal muscle during embryogenesis and in adult striated muscle [67]. Interestingly, as it was mentioned earlier myospryn protein is a docking molecule for protein kinase A at the costamere, and involved in localising and specifying signal transduction at this region [40].
Conclusion
Our work depicts a specific transcriptome associated with dystrophin deficiency, with minimal noise from non-specific complications such as non-clonal cells or biopsy-associated issues such as necrosis/degeneration/regeneration. While our results are affirmatively reproducing several previous in vitro and in vivo experiments, indicating the soundness of the data, they additionally suggest that dystrophin may be crucial for proper development of striated muscles as an organized contractile unit, implicating a novel pathophysiology for DMD. Dysregulation of several molecules converging at functions associated with the contractile unit of the myofibers is indicative of an aberrant myogenesis process resulting in maldeveloped myofibers which may be susceptible to physical or cytotoxic stress. Future experiments should include time course studies to identify longer-term sequelae of dystrophin deficiency. These data complement our previous in vivo work with dystrophin shRNAs expressed from AAV vectors [23], which suggested that the presence of dystrophin is not as essential after striated muscles have fully developed. Accordingly, transient gene therapy or other approaches to counter dystrophin-deficiency at early stages of skeletal muscle maturation might confer long lasting therapeutic benefit. In addition, the identification of dysregulated genes linked to dystrophin deficiency will provide insights and experimental approaches to define novel therapeutic targets for the potential treatment of DMD.
Methods
Cell culture & siRNA transfection
Primary muscle cultures were prepared from limb muscles of 3 to 5 day old mice, as described previously [68]. Seven biological replicates of primary myoblasts treated with the siRNA targeting dystrophin, or the siRNA targeting GL2 luciferase (as treatment controls), and 4 replicates of untreated primary myoblasts were prepared on four occasions. In order to have a uniform cell population between replicates at each instance, the muscle cell homogenates from different mice were mixed well and the resulting cell mixture was used to prepare the cultures. The cells were seeded in 150 cm2 tissue culture plates and one animal per plate was used. After approximately 48 hours, the cultures were about 60% confluent and were subjected to the first transfection with siRNAs. The siRNA targeting dystrophin had been designed using an algorithm developed by Cenix BioScience GmbH (Dresden, Germany) and manufactured by Ambion (Austin, USA) (see [23] for more details). The control siRNA targeting firefly GL2 luciferase was ordered from Dharmacon (Lafayette, USA). siRNAs were introduced into the primary muscle cultures at a final concentration of 100 nM using Oligofectamine transfection reagent (Invitrogen, Paisley, UK), following the manufacturer's instructions. Briefly, at the time of transfection, media were replaced with 13.5 ml per plate of complete DMEM supplemented with 10% serum. To transfect the cells in each plate 45 μl oligofectamine was gently diluted in 105 μl OptiMEM (Invitrogen) and incubated at room temperature for 10 minutes. The oligofectamine preparation was then added to 75 μl (20 μM) oligonucleotide already diluted in 1275 μl of OpiMEM, mixed gently and incubated for 20 minutes at room temperature before adding to the plates. 7 hours after transfection 15 ml of complete DMEM supplemented with 20% serum was added to each plate. 96 hours after seeding, when cultures were fully confluent, media were changed to serum-free Dulbecco's Minimal Essential Medium (DMEM) to induce differentiation of myoblasts, and a second transfection was performed at this time in serum free media as explained above. Cells were harvested for protein and total RNA assays 48 hours after the second transfection.
RNA isolation
Total RNA was extracted using PARIS kit (Ambion) according to the manufacturer recommended protocol. The quality of RNAs was checked using Agilent Bioanalyser (Santa Clara, USA). RNAs were stored at -80°C until used.
Antibodies
We used the following antibodies in this experiment: mouse monoclonal antibody NCL-DYS2 detecting the C-terminus of dystrophin (Clone Dy8/6C5; Novocastra Laboratories, UK), Nedd-4 mouse monoclonal antibody detecting Nedd-4 (Transduction Laboratories, USA) and Goat anti-mouse HRP-secondary antibody (Jackson ImmunoResearch Laboratories, USA).
Western Blotting
Protein extracts were obtained by using a small portion of the same cell samples lysed for RNA isolation using a PARIS kit (Ambion) as instructed by the manual. The cell lysates were added with equal volumes of 2× lysis buffer. 1× lysis buffer contained 75 mM Tris-HCl (Sigma-Aldrich, UK) pH 6.8; 10% SDS (Sigma-Aldrich); 20% Glycerol (Sigma-Aldrich); 200 mg/ml EDTA (Sigma-Aldrich) and 20 μg/ml phenylmethylsulfonyl fluoride (Sigma-Aldrich). Cell lystes were then passed through a 25 gauge hypodermic needle several times to shear DNA and hence reduce viscosity. DTT (Dithiothreitol, Sigma-Aldrich) and bromophenol blue were excluded from the buffer in this stage as they interfered with protein assay. To determine the total protein amount in samples, the BCA protein assay kit and protocol (Perbio Science, UK) was used. Twenty micrograms of each of the samples was run on Tris-Acetate 3-8% NuPAGE gels (Invitrogen) using Tris-acetate SDS running buffer (Invitrogen) for dystrophin detection.
RNA amplification and Illumina expression array chip hybridisation
The RNA amplification, chip hybridization and data extraction was done as a service by The Centre for Applied Genomics, Toronto, Canada. Illumina MouseWG-6_V1_1 gene expression arrays (San Diego, USA) were used for global gene expression studies. 250 ng total RNA was used to make amplified cRNAs using Illumina TotalPrep RNA amplification kit (Ambion). 1.5 μg cRNA was then hybridized to each microarray chip following manufacturer instructions. The signals were detected and gathered using BeadArray Reader (Illumina). The data were then uploaded to Bead Studio software (Illumina) and after qualitative evaluation, the text file data were extracted and statistically analyzed as explained below. Gene expression data have been deposited in Gene Expression Omnibus (GEO) http://www.ncbi.nlm.nih.gov/geo/index.cgi with the assigned GEO accession number GSE20548.
Statistical analysis
Background correction was made as described by Irizarry et al. [69]. The background corrected data were then transformed into log2 scales, and quantile normalisation was performed between arrays as previously described [70]. The three-step normalisation procedure was carried out using the Lumi software package for the R programming environment [71]. To assess differential gene expression, LIMMA (linear models for microarray data) method [72] was used. p values were adjusted for multiple testing using the Benjamini and Hochberg method.
RT-qPCR and primers
RNA samples were first treated with DNase I (Qiagen, Germany) as instructed by the manufacturer to remove possible DNA contaminations. 1 μg total RNA was then reverse transcribed using the Supercript III reverse transcription kit (Invitrogen) following manufacturer instructions. 1-2 ul of 1:5 diluted cDNA were used for quantitative PCR reaction using Brilliant II fast SYBR Green qPCR master mix (Agilent Technologies) in a total of 15 μL reaction volume. PCR reaction was carried out as follows: 10 minutes at 95°C followed by 40 cycles at 95°C for 20 s and 60°C for 60 s. Specificity of the PCR product was checked by melting-curve analysis using the following program: 55°C increasing 0.5°C in 60 steps, each step was 10 s temperature. Expression levels were calculated according to the ΔΔCt method normalised to the Elval1 mRNA expression. The Elval1 gene was used as an internal normaliser, as it showed the least variation (based on our microarray data) among all different replicates and conditions.
RT-qPCR primers were designed at exon-exon boundaries using Primer 3 software [73], unless mentioned otherwise (Additional file 6). The primers were initially tested by running an end-point PCR for each using SybrGreen master mix. The products were run on agarose gel for the product size as well as being used to perform melting curve analysis.
Animal husbandry
Animals were bred in-house and food and water provided ad libitum. They were maintained, and experimentation conducted under statutory Home Office recommendation, regulatory, ethical and licensing procedures and under the Animals (Scientific Procedures) Act 1986 (PPL 70/6160).
Abbreviations
DMD: Duchenne muscular dystrophy; RNAi: RNA interference; siRNA: small interfering RNA; IPA: Ingenuity Pathway Analysis; DAVID: Database for Annotation, Visualization and Integrated Discovery; PKA: protein kinase A.
Authors' contributions
GD and MMGS designed the experiment. MMGS made primary cell cultures, performed RNAi, prepared the RNA, conducted qRT-PCR and performed GO and IPA analyses. CT helped with RNA and RT-qPCR data preparations. IRG helped with the cell culture and western blot experiment. TA helped with RNAi. PH performed statistical analysis of microarray data. GD, MMGS, CT, TA and PH wrote the paper. All authors read and approved the final manuscript.
Supplementary Material
A table listing genes initially prepared from genes changing by dystrophin deficiency.
A table listing all genes changing by dystrophin deficiency that was used for further GO and IPA analyses.
A table listing changing genes common to "dystrophin siRNA treated versus untreated samples" and "GL2 siRNA treated versus untreated samples" comparisons.
A table listing enriched GO terms amongst genes changing by dystrophin deficiency.
A table listing predicted networks by IPA to be dysregulated by dystrophin deficiency.
A table listing primers used for RT-qPCR.
Contributor Information
Mohammad M Ghahramani Seno, Email: mgseno@yahoo.com.
Capucine Trollet, Email: Capucine.Trollet@rhul.ac.uk.
Takis Athanasopoulos, Email: P.Athanasopoulos@rhul.ac.uk.
Ian R Graham, Email: ian.graham@sanger.co.uk.
Pingzhao Hu, Email: phu@sickkids.ca.
George Dickson, Email: G.Dickson@rhul.ac.uk.
Acknowledgements
We would like to thank Mr. Jeff McDonald for kindly helping with the identification of miRNAs happening at dysregulated gene loci and also Dr. Janet Buchanan for kindly reading critically and editing the manuscript; and also her very helpful comments/advice. This research work was supported by funds from the Muscular Dystrophy Campaign, UK, the Association Française contre les Myopathies (AFM) and the EU Clinigene Network of Excellence. MMGS was a recipient of a scholarship from Ministry of Science, Research and Technology, Iran.
References
- Emery AEH. Duchenne Muscular Dystrophy. Oxford Monographs on Medical Genetics. 2. Oxford, UK: Oxford Univ. Press; 1993. [Google Scholar]
- Bulfield G, Siller WG, Wight PA, Moore KJ. X chromosome-linked muscular dystrophy (mdx) in the mouse. Proc Natl Acad Sci USA. 1984;81(4):1189–1192. doi: 10.1073/pnas.81.4.1189. [DOI] [PMC free article] [PubMed] [Google Scholar]
- Sicinski P, Geng Y, Ryder-Cook AS, Barnard EA, Darlison MG, Barnard PJ. The molecular basis of muscular dystrophy in the mdx mouse: a point mutation. Science. 1989;244(4912):1578–1580. doi: 10.1126/science.2662404. [DOI] [PubMed] [Google Scholar]
- Hoffman EP, Brown RH Jr, Kunkel LM. Dystrophin: the protein product of the Duchenne muscular dystrophy locus. Cell. 1987;51(6):919–928. doi: 10.1016/0092-8674(87)90579-4. [DOI] [PubMed] [Google Scholar]
- Muntoni F, Torelli S, Ferlini A. Dystrophin and mutations: one gene, several proteins, multiple phenotypes. Lancet Neurol. 2003;2(12):731–740. doi: 10.1016/S1474-4422(03)00585-4. [DOI] [PubMed] [Google Scholar]
- Deconinck N, Dan B. Pathophysiology of duchenne muscular dystrophy: current hypotheses. Pediatr Neurol. 2007;36(1):1–7. doi: 10.1016/j.pediatrneurol.2006.09.016. [DOI] [PubMed] [Google Scholar]
- Niebroj-Dobosz I, Fidzianska A, Hausmanowa-Petrusewicz I. Controversies about the function of dystrophin in muscle. Folia Neuropathol. 2001;39(4):253–258. [PubMed] [Google Scholar]
- Blake DJ, Weir A, Newey SE, Davies KE. Function and genetics of dystrophin and dystrophin-related proteins in muscle. Physiol Rev. 2002;82(2):291–329. doi: 10.1152/physrev.00028.2001. [DOI] [PubMed] [Google Scholar]
- Lapidos KA, Kakkar R, McNally EM. The dystrophin glycoprotein complex: signaling strength and integrity for the sarcolemma. Circ Res. 2004;94(8):1023–1031. doi: 10.1161/01.RES.0000126574.61061.25. [DOI] [PubMed] [Google Scholar]
- Boer JM, de Meijer EJ, Mank EM, van Ommen GB, Den Dunnen JT. Expression profiling in stably regenerating skeletal muscle of dystrophin-deficient mdx mice. Neuromuscul Disord. 2002;12(Suppl 1):S118–S124. doi: 10.1016/S0960-8966(02)00092-5. [DOI] [PubMed] [Google Scholar]
- Chen YW, Zhao P, Borup R, Hoffman EP. Expression profiling in the muscular dystrophies: identification of novel aspects of molecular pathophysiology. J Cell Biol. 2000;151(6):1321–1336. doi: 10.1083/jcb.151.6.1321. [DOI] [PMC free article] [PubMed] [Google Scholar]
- Haslett JN, Sanoudou D, Kho AT, Han M, Bennett RR, Kohane IS, Beggs AH, Kunkel LM. Gene expression profiling of Duchenne muscular dystrophy skeletal muscle. Neurogenetics. 2003;4(4):163–171. doi: 10.1007/s10048-003-0148-x. [DOI] [PubMed] [Google Scholar]
- Noguchi S, Tsukahara T, Fujita M, Kurokawa R, Tachikawa M, Toda T, Tsujimoto A, Arahata K, Nishino I. cDNA microarray analysis of individual Duchenne muscular dystrophy patients. Hum Mol Genet. 2003;12(6):595–600. doi: 10.1093/hmg/12.6.595. [DOI] [PubMed] [Google Scholar]
- Pescatori M, Broccolini A, Minetti C, Bertini E, Bruno C, D'Amico A, Bernardini C, Mirabella M, Silvestri G, Giglio V. et al. Gene expression profiling in the early phases of DMD: a constant molecular signature characterizes DMD muscle from early postnatal life throughout disease progression. FASEB J. 2007;21(4):1210–1226. doi: 10.1096/fj.06-7285com. [DOI] [PubMed] [Google Scholar]
- Porter JD, Khanna S, Kaminski HJ, Rao JS, Merriam AP, Richmonds CR, Leahy P, Li J, Guo W, Andrade FH. A chronic inflammatory response dominates the skeletal muscle molecular signature in dystrophin-deficient mdx mice. Hum Mol Genet. 2002;11(3):263–272. doi: 10.1093/hmg/11.3.263. [DOI] [PubMed] [Google Scholar]
- Porter JD, Merriam AP, Leahy P, Gong B, Khanna S. Dissection of temporal gene expression signatures of affected and spared muscle groups in dystrophin-deficient (mdx) mice. Hum Mol Genet. 2003;12(15):1813–1821. doi: 10.1093/hmg/ddg197. [DOI] [PubMed] [Google Scholar]
- Rouger K, Le Cunff M, Steenman M, Potier MC, Gibelin N, Dechesne CA, Leger JJ. Global/temporal gene expression in diaphragm and hindlimb muscles of dystrophin-deficient (mdx) mice. Am J Physiol Cell Physiol. 2002;283(3):C773–C784. doi: 10.1152/ajpcell.00112.2002. [DOI] [PubMed] [Google Scholar]
- Tkatchenko AV, Le Cam G, Leger JJ, Dechesne CA. Large-scale analysis of differential gene expression in the hindlimb muscles and diaphragm of mdx mouse. Biochim Biophys Acta. 2000;1500(1):17–30. doi: 10.1016/s0925-4439(99)00084-8. [DOI] [PubMed] [Google Scholar]
- Tkatchenko AV, Pietu G, Cros N, Gannoun-Zaki L, Auffray C, Leger JJ, Dechesne CA. Identification of altered gene expression in skeletal muscles from Duchenne muscular dystrophy patients. Neuromuscul Disord. 2001;11(3):269–277. doi: 10.1016/S0960-8966(00)00198-X. [DOI] [PubMed] [Google Scholar]
- Tseng BS, Zhao P, Pattison JS, Gordon SE, Granchelli JA, Madsen RW, Folk LC, Hoffman EP, Booth FW. Regenerated mdx mouse skeletal muscle shows differential mRNA expression. J Appl Physiol. 2002;93(2):537–545. doi: 10.1152/japplphysiol.00202.2002. [DOI] [PubMed] [Google Scholar]
- Turk R, Sterrenburg E, de Meijer EJ, van Ommen GJ, Den Dunnen JT, t Hoen PA. Muscle regeneration in dystrophin-deficient mdx mice studied by gene expression profiling. BMC Genomics. 2005;6:98. doi: 10.1186/1471-2164-6-98. [DOI] [PMC free article] [PubMed] [Google Scholar]
- Rao M, Sockanathan S. Molecular mechanisms of RNAi: implications for development and disease. Birth Defects Res CEmbryo Today. 2005;75(1):28–42. doi: 10.1002/bdrc.20030. [DOI] [PubMed] [Google Scholar]
- Ghahramani Seno MM, Graham IR, Athanasopoulos T, Trollet C, Pohlschmidt M, Crompton MR, Dickson G. RNAi-mediated knockdown of dystrophin expression in adult mice does not lead to overt muscular dystrophy pathology. Hum Mol Genet. 2008;17(17):2622–2632. doi: 10.1093/hmg/ddn162. [DOI] [PubMed] [Google Scholar]
- Blanco G, Coulton GR, Biggin A, Grainge C, Moss J, Barrett M, Berquin A, Marechal G, Skynner M, van Mier P. et al. The kyphoscoliosis (ky) mouse is deficient in hypertrophic responses and is caused by a mutation in a novel muscle-specific protein. Hum Mol Genet. 2001;10(1):9–16. doi: 10.1093/hmg/10.1.9. [DOI] [PubMed] [Google Scholar]
- Agrawal PB, Greenleaf RS, Tomczak KK, Lehtokari VL, Wallgren-Pettersson C, Wallefeld W, Laing NG, Darras BT, Maciver SK, Dormitzer PR. et al. Nemaline myopathy with minicores caused by mutation of the CFL2 gene encoding the skeletal muscle actin-binding protein, cofilin-2. Am J Hum Genet. 2007;80(1):162–167. doi: 10.1086/510402. [DOI] [PMC free article] [PubMed] [Google Scholar]
- Thirion C, Stucka R, Mendel B, Gruhler A, Jaksch M, Nowak KJ, Binz N, Laing NG, Lochmuller H. Characterization of human muscle type cofilin (CFL2) in normal and regenerating muscle. Eur J Biochem. 2001;268(12):3473–3482. doi: 10.1046/j.1432-1327.2001.02247.x. [DOI] [PubMed] [Google Scholar]
- Richard I, Broux O, Allamand V, Fougerousse F, Chiannilkulchai N, Bourg N, Brenguier L, Devaud C, Pasturaud P, Roudaut C. Mutations in the proteolytic enzyme calpain 3 cause limb-girdle muscular dystrophy type 2A. Cell. 1995;81(1):27–40. doi: 10.1016/0092-8674(95)90368-2. [DOI] [PubMed] [Google Scholar]
- Moreira ES, Vainzof M, Marie SK, Sertie AL, Zatz M, Passos-Bueno MR. The seventh form of autosomal recessive limb-girdle muscular dystrophy is mapped to 17q11-12. Am J Hum Genet. 1997;61(1):151–159. doi: 10.1086/513889. [DOI] [PMC free article] [PubMed] [Google Scholar]
- Moreira ES, Wiltshire TJ, Faulkner G, Nilforoushan A, Vainzof M, Suzuki OT, Valle G, Reeves R, Zatz M, Passos-Bueno MR. et al. Limb-girdle muscular dystrophy type 2G is caused by mutations in the gene encoding the sarcomeric protein telethonin. Nat Genet. 2000;24(2):163–166. doi: 10.1038/72822. [DOI] [PubMed] [Google Scholar]
- Nakajima H, Kono N, Yamasaki T, Hotta K, Kawachi M, Kuwajima M, Noguchi T, Tanaka T, Tarui S. Genetic defect in muscle phosphofructokinase deficiency. Abnormal splicing of the muscle phosphofructokinase gene due to a point mutation at the 5'-splice site. J Biol Chem. 1990;265(16):9392–9395. [PubMed] [Google Scholar]
- Raben N, Sherman JB. Mutations in muscle phosphofructokinase gene. Hum Mutat. 1995;6(1):1–6. doi: 10.1002/humu.1380060102. [DOI] [PubMed] [Google Scholar]
- Tarui S, Ikura Y, Tanaka T, Suda M, Nishikawa M. Phosphofructokinase deficiency in skeletal muscle. A new type of glycogenesis. Biochem Biophys Res Commun. 1965;19:517–523. doi: 10.1016/0006-291X(65)90156-7. [DOI] [PubMed] [Google Scholar]
- Allard B. Sarcolemmal ion channels in dystrophin-deficient skeletal muscle fibres. J Muscle Res Cell Motil. 2006;27(5-7):367–373. doi: 10.1007/s10974-006-9083-4. [DOI] [PubMed] [Google Scholar]
- Chinet AE, Even PC, Decrouy A. Dystrophin-dependent efficiency of metabolic pathways in mouse skeletal muscles. Experientia. 1994;50(6):602–605. doi: 10.1007/BF01921731. [DOI] [PubMed] [Google Scholar]
- Khairallah M, Khairallah R, Young ME, Dyck JR, Petrof BJ, Des RC. Metabolic and signaling alterations in dystrophin-deficient hearts precede overt cardiomyopathy. J Mol Cell Cardiol. 2007;43(2):119–129. doi: 10.1016/j.yjmcc.2007.05.015. [DOI] [PubMed] [Google Scholar]
- McClure WC, Rabon RE, Ogawa H, Tseng BS. Upregulation of the creatine synthetic pathway in skeletal muscles of mature mdx mice. Neuromuscul Disord. 2007;17(8):639–650. doi: 10.1016/j.nmd.2007.04.008. [DOI] [PMC free article] [PubMed] [Google Scholar]
- Zhang W, ten Hove M, Schneider JE, Stuckey DJ, Sebag-Montefiore L, Bia BL, Radda GK, Davies KE, Neubauer S, Clarke K. Abnormal cardiac morphology, function and energy metabolism in the dystrophic mdx mouse: an MRI and MRS study. J Mol Cell Cardiol. 2008;45(6):754–760. doi: 10.1016/j.yjmcc.2008.09.125. [DOI] [PubMed] [Google Scholar]
- Dogra C, Changotra H, Wergedal JE, Kumar A. Regulation of phosphatidylinositol 3-kinase (PI3K)/Akt and nuclear factor-kappa B signaling pathways in dystrophin-deficient skeletal muscle in response to mechanical stretch. J Cell Physiol. 2006;208(3):575–585. doi: 10.1002/jcp.20696. [DOI] [PubMed] [Google Scholar]
- Kumar A, Khandelwal N, Malya R, Reid MB, Boriek AM. Loss of dystrophin causes aberrant mechanotransduction in skeletal muscle fibers. FASEB J. 2004;18(1):102–113. doi: 10.1096/fj.03-0453com. [DOI] [PubMed] [Google Scholar]
- Reynolds JG, McCalmon SA, Donaghey JA, Naya FJ. Deregulated protein kinase A signaling and myospryn expression in muscular dystrophy. J Biol Chem. 2008;283(13):8070–8074. doi: 10.1074/jbc.C700221200. [DOI] [PMC free article] [PubMed] [Google Scholar]
- Dennis G Jr, Sherman BT, Hosack DA, Yang J, Gao W, Lane HC, Lempicki RA. DAVID: Database for Annotation, Visualization, and Integrated Discovery. Genome Biol. 2003;4(5):3. doi: 10.1186/gb-2003-4-5-p3. [DOI] [PubMed] [Google Scholar]
- Huang dW, Sherman BT, Lempicki RA. Systematic and integrative analysis of large gene lists using DAVID bioinformatics resources. Nat Protoc. 2009;4(1):44–57. doi: 10.1038/nprot.2008.211. [DOI] [PubMed] [Google Scholar]
- Griffiths-Jones S, Saini HK, van Dongen S, Enright AJ. miRBase: tools for microRNA genomics. Nucleic Acids Res. 2008. pp. D154–D158. [DOI] [PMC free article] [PubMed]
- Niebroj-Dobosz I, Lukasiuk M. Immunoblot analysis of sarcoplasmic calcium binding proteins in Duchenne muscular dystrophy. J Neurol. 1995;242(2):82–86. doi: 10.1007/BF00887821. [DOI] [PubMed] [Google Scholar]
- Sano M, Yokota T, Endo T, Tsukagoshi H. A developmental change in the content of parvalbumin in normal and dystrophic mouse (mdx) muscle. J Neurol Sci. 1990;97(2-3):261–272. doi: 10.1016/0022-510X(90)90224-B. [DOI] [PubMed] [Google Scholar]
- Hopf FW, Turner PR, Steinhardt RA. Calcium misregulation and the pathogenesis of muscular dystrophy. Subcell Biochem. 2007;45:429–464. doi: 10.1007/978-1-4020-6191-2_16. full_text. [DOI] [PubMed] [Google Scholar]
- Lucas-Heron B. Muscular degeneration in Duchenne's dystrophy may be caused by a mitochondrial defect. Med Hypotheses. 1995;44(4):298–300. doi: 10.1016/0306-9877(95)90184-1. [DOI] [PubMed] [Google Scholar]
- Lucas-Heron B. Absence of a calmitine-specific protease inhibitor in skeletal muscle mitochondria of patients with Duchenne's muscular dystrophy. Biochem Biophys Res Commun. 1996;225(3):701–704. doi: 10.1006/bbrc.1996.1238. [DOI] [PubMed] [Google Scholar]
- Paolini C, Quarta M, Nori A, Boncompagni S, Canato M, Volpe P, Allen PD, Reggiani C, Protasi F. Reorganized stores and impaired calcium handling in skeletal muscle of mice lacking calsequestrin-1. J Physiol. 2007;583(Pt 2):767–784. doi: 10.1113/jphysiol.2007.138024. [DOI] [PMC free article] [PubMed] [Google Scholar]
- Wong W, Scott JD. AKAP signalling complexes: focal points in space and time. Nat Rev Mol Cell Biol. 2004;5(12):959–970. doi: 10.1038/nrm1527. [DOI] [PubMed] [Google Scholar]
- Ceccarini M, Grasso M, Veroni C, Gambara G, Artegiani B, Macchia G, Ramoni C, Torreri P, Mallozzi C, Petrucci TC. et al. Association of dystrobrevin and regulatory subunit of protein kinase A: a new role for dystrobrevin as a scaffold for signaling proteins. J Mol Biol. 2007;371(5):1174–1187. doi: 10.1016/j.jmb.2007.06.019. [DOI] [PubMed] [Google Scholar]
- Russell MA, Lund LM, Haber R, McKeegan K, Cianciola N, Bond M. The intermediate filament protein, synemin, is an AKAP in the heart. Arch Biochem Biophys. 2006;456(2):204–215. doi: 10.1016/j.abb.2006.06.010. [DOI] [PubMed] [Google Scholar]
- Bhosle RC, Michele DE, Campbell KP, Li Z, Robson RM. Interactions of intermediate filament protein synemin with dystrophin and utrophin. Biochem Biophys Res Commun. 2006;346(3):768–777. doi: 10.1016/j.bbrc.2006.05.192. [DOI] [PubMed] [Google Scholar]
- Sadoulet-Puccio HM, Rajala M, Kunkel LM. Dystrobrevin and dystrophin: an interaction through coiled-coil motifs. Proc Natl Acad Sci USA. 1997;94(23):12413–12418. doi: 10.1073/pnas.94.23.12413. [DOI] [PMC free article] [PubMed] [Google Scholar]
- Reynolds JG, McCalmon SA, Tomczyk T, Naya FJ. Identification and mapping of protein kinase A binding sites in the costameric protein myospryn. Biochim Biophys Acta. 2007;1773(6):891–902. doi: 10.1016/j.bbamcr.2007.04.004. [DOI] [PMC free article] [PubMed] [Google Scholar]
- Dogra C, Srivastava DS, Kumar A. Protein-DNA array-based identification of transcription factor activities differentially regulated in skeletal muscle of normal and dystrophin-deficient mdx mice. Mol Cell Biochem. 2008;312(1-2):17–24. doi: 10.1007/s11010-008-9716-6. [DOI] [PMC free article] [PubMed] [Google Scholar]
- Roy S, Wolff C, Ingham PW. The u-boot mutation identifies a Hedgehog-regulated myogenic switch for fiber-type diversification in the zebrafish embryo. Genes Dev. 2001;15(12):1563–1576. doi: 10.1101/gad.195801. [DOI] [PMC free article] [PubMed] [Google Scholar]
- Ogura Y, Naito H, Kakigi R, Ichinoseki-Sekine N, Kurosaka M, Katamoto S. Alpha-actinin-3 levels increase concomitantly with fast fibers in rat soleus muscle. Biochem Biophys Res Commun. 2008;372(4):584–588. doi: 10.1016/j.bbrc.2008.05.059. [DOI] [PubMed] [Google Scholar]
- Kurasawa M, Sato N, Matsuda A, Koshida S, Totsuka T, Obinata T. Differential expression of C-protein isoforms in developing and degenerating mouse striated muscles. Muscle Nerve. 1999;22(2):196–207. doi: 10.1002/(SICI)1097-4598(199902)22:2<196::AID-MUS7>3.0.CO;2-E. [DOI] [PubMed] [Google Scholar]
- Borisov AB, Sutter SB, Kontrogianni-Konstantopoulos A, Bloch RJ, Westfall MV, Russell MW. Essential role of obscurin in cardiac myofibrillogenesis and hypertrophic response: evidence from small interfering RNA-mediated gene silencing. Histochem Cell Biol. 2006;125(3):227–238. doi: 10.1007/s00418-005-0069-x. [DOI] [PubMed] [Google Scholar]
- Kontrogianni-Konstantopoulos A, Catino DH, Strong JC, Sutter S, Borisov AB, Pumplin DW, Russell MW, Bloch RJ. Obscurin modulates the assembly and organization of sarcomeres and the sarcoplasmic reticulum. FASEB J. 2006;20(12):2102–2111. doi: 10.1096/fj.06-5761com. [DOI] [PubMed] [Google Scholar]
- Fan GC, Chu G, Kranias EG. Hsp20 and its cardioprotection. Trends Cardiovasc Med. 2005;15(4):138–141. doi: 10.1016/j.tcm.2005.05.004. [DOI] [PubMed] [Google Scholar]
- Linke WA. Sense and stretchability: the role of titin and titin-associated proteins in myocardial stress-sensing and mechanical dysfunction. Cardiovasc Res. 2008;77(4):637–648. doi: 10.1016/j.cardiores.2007.03.029. [DOI] [PubMed] [Google Scholar]
- Bos JM, Poley RN, Ny M, Tester DJ, Xu X, Vatta M, Towbin JA, Gersh BJ, Ommen SR, Ackerman MJ. Genotype-phenotype relationships involving hypertrophic cardiomyopathy-associated mutations in titin, muscle LIM protein, and telethonin. Mol Genet Metab. 2006;88(1):78–85. doi: 10.1016/j.ymgme.2005.10.008. [DOI] [PMC free article] [PubMed] [Google Scholar]
- Hayashi T, Arimura T, Itoh-Satoh M, Ueda K, Hohda S, Inagaki N, Takahashi M, Hori H, Yasunami M, Nishi H. et al. Tcap gene mutations in hypertrophic cardiomyopathy and dilated cardiomyopathy. J Am Coll Cardiol. 2004;44(11):2192–2201. doi: 10.1016/j.jacc.2004.08.058. [DOI] [PubMed] [Google Scholar]
- Nakagami H, Kikuchi Y, Katsuya T, Morishita R, Akasaka H, Saitoh S, Rakugi H, Kaneda Y, Shimamoto K, Ogihara T. Gene polymorphism of myospryn (cardiomyopathy-associated 5) is associated with left ventricular wall thickness in patients with hypertension. Hypertens Res. 2007;30(12):1239–1246. doi: 10.1291/hypres.30.1239. [DOI] [PubMed] [Google Scholar]
- Benson MA, Tinsley CL, Blake DJ. Myospryn is a novel binding partner for dysbindin in muscle. J Biol Chem. 2004;279(11):10450–10458. doi: 10.1074/jbc.M312664200. [DOI] [PubMed] [Google Scholar]
- Graham IR, Hill VJ, Manoharan M, Inamati GB, Dickson G. Towards a therapeutic inhibition of dystrophin exon 23 splicing in mdx mouse muscle induced by antisense oligoribonucleotides (splicomers): target sequence optimisation using oligonucleotide arrays. J Gene Med. 2004;6(10):1149–1158. doi: 10.1002/jgm.603. [DOI] [PubMed] [Google Scholar]
- Irizarry RA, Bolstad BM, Collin F, Cope LM, Hobbs B, Speed TP. Summaries of Affymetrix GeneChip probe level data. Nucleic Acids Res. 2003;31(4):e15. doi: 10.1093/nar/gng015. [DOI] [PMC free article] [PubMed] [Google Scholar]
- Bolstad BM, Irizarry RA, Astrand M, Speed TP. A comparison of normalization methods for high density oligonucleotide array data based on variance and bias. Bioinformatics. 2003;19(2):185–193. doi: 10.1093/bioinformatics/19.2.185. [DOI] [PubMed] [Google Scholar]
- Du P, Kibbe WA, Lin SM. lumi: a pipeline for processing Illumina microarray. Bioinformatics. 2008;24(13):1547–1548. doi: 10.1093/bioinformatics/btn224. [DOI] [PubMed] [Google Scholar]
- Smyth GK. Linear models and empirical bayes methods for assessing differential expression in microarray experiments. Stat Appl Genet Mol Biol. 2004;3 doi: 10.2202/1544-6115.1027. Article3. [DOI] [PubMed] [Google Scholar]
- Rozen S, Skaletsky H. Primer3 on the WWW for general users and for biologist programmers. Methods Mol Biol. 2000;132:365–386. doi: 10.1385/1-59259-192-2:365. [DOI] [PubMed] [Google Scholar]
Associated Data
This section collects any data citations, data availability statements, or supplementary materials included in this article.
Supplementary Materials
A table listing genes initially prepared from genes changing by dystrophin deficiency.
A table listing all genes changing by dystrophin deficiency that was used for further GO and IPA analyses.
A table listing changing genes common to "dystrophin siRNA treated versus untreated samples" and "GL2 siRNA treated versus untreated samples" comparisons.
A table listing enriched GO terms amongst genes changing by dystrophin deficiency.
A table listing predicted networks by IPA to be dysregulated by dystrophin deficiency.
A table listing primers used for RT-qPCR.