

Abstract
Bar-coded multiplexed sequencing approaches based on new-generation sequencing technologies provide capacity to sequence a mapping population in a single sequencing run. However, such approaches usually generate low-coverage and error-prone sequences for each line in a population. Thus, it is a significant challenge to genotype individual lines in a population for linkage map construction based on low-coverage sequences without the availability of high-quality genotype data of the parental lines. In this paper, we report a method for constructing ultrahigh-density linkage maps composed of high-quality single-nucleotide polymorphisms (SNPs) based on low-coverage sequences of recombinant inbred lines. First, all potential SNPs were identified to obtain drafts of parental genotypes using a maximum parsimonious inference of recombination, making maximum use of SNP information found in the entire population. Second, high-quality SNPs were identified by filtering out low-quality ones by permutations involving resampling of windows of SNPs followed by Bayesian inference. Third, lines in the mapping population were genotyped using the high-quality SNPs assisted by a hidden Markov model. With 0.05× genome sequence per line, an ultrahigh-density linkage map composed of bins of high-quality SNPs using 238 recombinant inbred lines derived from a cross between two rice varieties was constructed. Using this map, a quantitative trait locus for grain width (GW5) was localized to its presumed genomic region in a bin of 200 kb, confirming the accuracy and quality of the map. This method is generally applicable in genetic map construction with low-coverage sequence data.
Keywords: genomics, maximum parsimony of recombination, Bayesian inference, hidden Markov model, rice
Genetic maps provide the bases for a wide range of genetic and genomic studies and are pivotal for mapping and identifying genes associated with phenotypic performance, referred to as traits. The resolution of a genetic linkage map depends on the number of recombination events in the mapping population and the density of molecular markers. The number of recombination events depends on how the population is created, whereas the density of the markers can be improved continually with advances in molecular techniques. Traditional molecular markers that have been widely used in genotyping assays of populations, although laborious and time-consuming, have limitations in throughput and can provide information only for low-density maps, and thus are of low efficiency.
Oligonucleotide microarrays, composed of millions of probes based on genome sequences, can capture large numbers of sequence variations between different samples by comparative genomic hybridization, which can be used for high-throughput marker discovery and genotyping (1–3). However, restrictions in microarray design and the number of probes on the microarrays limit the applications of this technology. In addition, it is cost-prohibitive for genotyping especially if the mapping population is large.
New sequencing technologies provide the capacity for massively parallel resequencing of genomes and thus can be used for genotyping. Based on bar-coded multiplexed sequencing strategies, these new sequencing techniques can be amended to obtain sequences for a large number of samples simultaneously (4, 5), offering the possibility to genotype a mapping population in a single sequencing run. However, even with the availability of new sequencing technologies, deep sequencing each line in a mapping population is still too costly, whereas genotype information from contiguous markers is often highly redundant and thus may not be all necessary for population genotyping. Depending on the research purpose, methods have been developed for tradeoffs between sequence coverage and the amount of information. For example, Baird et al. (6) proposed a strategy focusing sequencing efforts on regions flanking restriction sites to achieve reduction of genome complexity, which enables rapid single-nucleotide polymorphism (SNP) discovery and genetic mapping. However, this strategy exploits SNPs depending on restriction sites of specific restriction enzymes and involves additional complex experimental processes, thus limiting its application. Huang et al. (7) developed a strategy for high-throughput genotyping of recombinant inbred lines (RILs) derived from a cross between two sequenced rice varieties (Nipponbare and 93-11) by indexed whole-genome resequencing with ∼0.02-fold coverage of rice genome for each line. An inherent shortcoming associated with using such low-coverage sequences as genetic markers is that the sequences are sparse and error-prone. To overcome this problem, they developed a sliding-window approach for genotype calling of RILs by evaluating a group of consecutive known SNPs rather than genotyping based on single SNPs, taking advantage of the redundant information of contiguous markers. Although this approach is cost-effective and powerful, its applicability in genotyping other mapping populations is limited because it relies on high-quality sequences of the parents to identify SNPs, which is still expensive.
Here we developed a parent-independent strategy for genotyping of a mapping population based on very low coverage sequencing of a population. Using this strategy, we constructed an ultrahigh-density linkage map composed of high-quality SNPs with very low depth sequence coverage of an RIL population derived from a cross between two unsequenced rice varieties. The precision of this map was evaluated by localization of a previously cloned quantitative trait locus (QTL) for rice grain width to a bin of ∼200 kb containing the rice GW5 gene (8, 9). This strategy is generally applicable and cost-effective for genotyping various kinds of mapping populations.
Results
The workflow and key steps of the genotyping strategy are presented (Fig. S1). For illustration, we used the data of an RIL population from a cross between two rice cultivars of the indica subspecies, Zhenshan 97 and Minghui 63, the parents of the most widely cultivated hybrid in China.
Sequencing RILs and Identifying Potential SNPs Without Sequences of the Parents.
A total of 238 RILs developed from the cross between Zhenshan 97 and Minghui 63 were resequenced with an Illumina Genome Analyzer II using the bar-coded multiplexed sequencing approach (4, 7).
A total of 142.6 million reads were resolved for these RILs according to the bar codes. The bar codes in both paired reads were checked, and read pairs starting with different bar codes were discarded. After removing the bar-code sequences, all 36-mer paired reads of RILs were aligned to the reference genome Nipponbare (10) using the software MAQ (11). In this way, 95.4% of reads could be mapped to the reference genome. An approximately 20.6 Mb sequence, or ∼0.055-fold genome coverage, was generated per RIL, and thus the total amount of sequence produced for all of the RILs yielded 13.1 genome equivalents.
For ease of description, we use the data of chromosome 5 to demonstrate the idea and processes. To identify potential SNP sites using sequences of RILs without sequences of the parents, the mapped sequences of all of the RILs with mapping quality no less than 40 (Materials and Methods) were merged to obtain nucleotide information for each site. Because the nucleotides at a real SNP site should be biallelic, potential SNP sites and the two allelic nucleotides were identified according to their bimodal distribution. In total, 15,795 putative SNP sites on chromosome 5 were identified between the two parents, ≈1 SNP per 1.9 kb. After filtering out potential false-positive SNPs, we obtained 209,240 data points of SNPs from the 238 RILs, giving rise to an average SNP density of 3 per 100 kb in an RIL.
To estimate the sequence error rate of the multiplexed sequencing approach, we identified consensus sequences in unique genomic regions from all of the RILs and the maternal parent Zhenshan 97 that was also sequenced to 0.032-fold genome coverage under the same experimental conditions as the RILs. Analysis of the Zhenshan 97 sequence recovered 272 of the 15,795 putative SNP sites. It was found that 3.18% (74,799/2,354,886) of the nucleotides from the multiplexed sequencing of Zhenshan 97 was different from the nucleotides which were monomorphic in the RILs, providing an estimate for error rate of the sequencing approach in this study.
Using Maximum Parsimony of Recombination to Infer Parental Genotypes Based on SNPs of RILs.
To construct a genetic linkage map, it is essential to know the parental genotypes. In the age of high-throughput sequencing, if the sequence depth is low, parental sequence information provides little useful information that can be used as references of the parental SNP genotypes for map construction. We propose a method using the principle of maximum parsimony of recombination (MPR) to infer the parental genotypes based on low-coverage resequencing of a population of genotypes derived from RILs.
For a given set of RILs genotyped by a large number of SNPs from resequencing, there will be numerous possibilities for the “deduced parental genotypes” if there is no restriction with respect to the number of recombination events. By MPR, we assume that the parental genotypes would be ones that produce the RIL genotypes with the smallest number of recombination events. For simplicity, the idea is illustrated with a hypothetical dataset consisting of five SNP sites and six RILs (matrix A, Fig. 1). A common feature of the low-sequence-coverage dataset is that it contains missing data at a large portion of SNP sites (shown as blank cells). The biallelic states in matrix A of five SNPs (rows) and six RILs (columns) are extracted into matrix B of five rows and two columns (a and b). Assuming alleles in column a are all from parent 1 and those in column b are all from parent 2, six recombination events would be needed to produce genotypes of the six RILs (matrix C).
Fig. 1.

An example of inferring parental genotypes based on the principle of maximum parsimony of recombination (MPR). Different background colors represent different genotypes in matrices C, E, and G, whereas crosses indicate the recombination breakpoints between different genotypes. See text for details.
We want to find the two parental genotypes that would produce the six RILs with the smallest number of recombination events. To do so, an iterative stepwise perturbation of the assumed parental genotypes (matrix B) was conducted by exchanging the alleles between columns a and b, one at a time, and the resulting “assumed genotype matrix” (matrix D) was again used to infer the recombination events. In this process, an exchange of the alleles at the second SNP site reduced the number of recombination events from six to three, as indicated in matrix E. We thus fixed these alleles in the matrix and continued the allele-swapping process. Eventually, another exchange at the fourth SNP site (matrix F) could produce the RIL genotypes with only one recombination event, the smallest number possible with this dataset. We therefore accepted matrix F as the parental genotypes.
This procedure can be extended to a more general case of a dataset composed of n putative SNP sites in a local genomic region (window) and m RILs (or other types of mapping populations). The only exception is that the number of SNP sites at which alleles are swapped, referred to as step size s of a swap, may not necessarily be one at a time, although it always starts with one. If the allele swapping one at a time does not reduce the number of recombination events (R), the step size can be increased by one SNP site at a time until R can be reduced or the step size achieves the defined maximum step size sm. Such iterative swapping would continue until R cannot be further reduced.
Using the MPR method, we inferred the parental genotypes based on the low-coverage sequences of the RILs. In this procedure, the SNPs were first divided along the chromosomes into hundreds of small windows consisting of 50 adjacent SNPs (Fig. 2A). The windows were combined according to the SNP sites recovered by the sequences of Zhenshan 97 (referred to as ZS-SNPs) to ensure that at least 10 ZS-SNPs were included in each window (Fig. 2B). The MPR procedure was performed within each window using the SNP data of all of the RILs to predict the genotypes of the parents. Because the Zhenshan 97 genotypes of the 10 ZS-SNPs were known, albeit with a certain rate of errors, the genotypes of other SNPs in this window would be assigned Zhenshan 97 if ≥80% of the genotypes of ZS-SNPs are in agreement with the predicted ones. Finally, the genotype calls from different windows were assembled according to ZS-SNPs in each of the windows to produce the “draft genotypes” for the two parents (by default, if one parent was confirmed, the alternative would be the other parent), Zhenshan 97 and Minghui 63 (Fig. 2C).
Fig. 2.

The scheme for global inference of parental genotypes. (A–C) Procedures for inferring the draft genotypes of the two parents P1 and P2 assisted by low-coverage parental sequences of one parent (see text for details). (D–G) Refining the SNPs of the inferred parental genotypes, including: (D and E) inferring the parental genotypes using permutation by resampling of SNPs according to individual RILs (see text for details), and (F and G) validating the SNPs by posterior probabilities (Bayesian inference). The number of genotype calls for an SNP site resulting from the permutations was recorded (F), and the probability for the assignment of the draft genotype was calculated (G), whereby the genotype is assigned by the highest posterior probability of P1, PN, and P2 at the given SNP site. It is also seen that the posterior probability of PN of SNPs at the fourth site (in gray) is the highest, and thus this site is regarded as a low-quality SNP site. (H) Assembling genotype calls from different windows aided by low-coverage parental sequences.
Refining Parental Genotypes by Resampling and Bayesian Inference to Remove Low-Quality SNPs.
Several sources of errors may arise in the above-inferred draft genotypes. First, sequencing errors of Zhenshan 97 would reduce the reliability of the ZS-SNPs. Second, some of the SNP sites in RILs, although biallelic, may not be of high quality, owing to sequencing errors or incorrect alignments of reads from homologous regions. Third, chance events may also contribute to errors in the inferred parental genotypes by the MPR method.
To validate the inferred genotypes, we adopted a permutation procedure involving local resamplings followed by Bayesian inference to filter out low-quality SNPs and to refine the parental genotype prediction (Fig. 2 D–G). In this permutation procedure, we arranged all SNPs along the chromosomes. The permutation was based on the division of the 238 RILs and thus consisted of 238 steps. In the first step, 50 of the first 100 SNPs detected in the first RIL (R001) were randomly sampled without replacement, and analyzed using the MPR method to obtain an inference of two haplotypes of 50 SNPs. A haplotype was assigned a parental genotype if ≥80% of the SNPs were in agreement to a draft parental genotype. Then, 50 of the first 100 SNPs, which included the 50 unsampled SNPs in the first step, were again randomly sampled without replacement, and analyzed using the MPR method to obtain another inference of the two parental genotypes as described above. This process was repeated until all of the SNPs that occurred in R001 were used in the inference, resulting in an inferred SNP genotype for each parent at each SNP site. The resulting genotype calls from these inferences were recorded and assembled. In the second step, SNPs detected in the second line (R002) were used in MPR analysis exactly in the same way as in R001. This process was repeated for all of the 238 RILs.
The entire permutation process was repeated 20 times. Consequently, if a nucleotide was sequenced in 10 of the 238 RILs, 200 genotype calls would be obtained for this SNP.
The effect of the number of permutations and the error rate of the MPR method on the retention rate of reliable SNPs was evaluated subject to two conditions: discarding SNP sites with low quality by posterior probabilities (Bayesian inference), and removing ones with the number of the minor genotype no less than the number of permutations. It was shown that, depending on the number of permutations and error rate (from 0.05 to 10%), 76.7–84.3% of all putative SNPs were retained (Fig. S2), and assuming a smaller error rate of MPR resulted in fewer remaining SNPs. The number of SNPs remained stable after 10 permutations. Using a conservative error rate of 0.05% for the MPR method, a total of 13,227 refined SNPs were identified between the parents by 10 permutations. The SNPs and inferred parental genotype calls are shown in Dataset S1.
To evaluate the accuracy of our MPR-based method, additional sequencing of ≈14-fold sequence coverage of each parental line was generated. Using the processes and criteria stated in SI Materials and Methods, 11,948 of the 15,795 SNPs identified from the RIL sequences were confirmed. However, 1,031 of the 15,795 SNPs displayed two or more different nucleotides at a site within a parent, owing to repetitive sequences or incorrect alignments.
We also compared these SNPs with the refined set of 13,227 high-quality SNPs resulting from permutations. It was found that 94.1% (970/1,031) of the inferior SNPs were removed by permutations and thus were not included in the refined set, whereas 98.7% (11,792/11,948) of the high-quality SNP sites remained in the refined set. The inferred parental genotype calls of all of the 11,792 sites were identical to the sequencing results, confirming the reliability of the methods used in this study, in both SNP identification and parental genotype inference. It should be noted that 10.8% (1,435) of 13,227 SNPs in the refined set identified from RIL sequences were not identified as SNPs from deep sequencing, mostly because there were not enough sequences from one or both of the parents for the corresponding SNP sites to satisfy the requirement for SNP identification.
Genotyping RILs Using a Hidden Markov Model.
There were two major difficulties in genotyping the RILs directly using the low-coverage sequences. First, the error rate of the raw sequences of the RILs was relatively high (3.18% by our estimate), which would affect the accuracy of genotyping with individual SNPs. Second, only one of the two alleles of an SNP site for a heterozygote could be observed, and adjacent SNPs residing in a heterozygous region would appear as a mixture of the two genotypes, thus causing difficulty in genotype calling. To overcome such difficulties, we treated the genotypes of SNPs along the chromosome as a Markov chain. A simple hidden Markov model (HMM) (12) was used to estimate the most likely underlying SNP genotypes of the RILs based on the available information of SNPs in a local region (Fig. 3).
Fig. 3.

RIL genotyping, bin map construction, and mapping of QTLs controlling grain width. (A) Procedures of RIL genotyping and bin map construction. The lower panel shows the bin map of 238 rice RILs on chromosome 5. (B) Probabilistic parameters of the hidden Markov model used to genotype RILs. (C) Mapping curve of QTLs controlling grain width on chromosome 5. A simple Student's t test was used to locate bins associated with grain width. The x axis is the position of bins along the chromosome and the rugs on the x axis represent the borders of bins. The y axis shows the log10-transformed P values resulting from the t test, which represents the degree of association between grain width and bins.
The HMM was constructed with two observations (alleles of each SNP, denoted as m and z) (Fig. 3B) and three hidden states, corresponding to the two homozygotes (denoted as M/M and Z/Z) and the heterozygote (M/Z). We began with an expected proportion of three genotypes 49.75:0.50:49.75 of M/M:M/Z:Z/Z in the RIL population. Because the error rate of the multiplexed sequencing was estimated to be 3.18% and only a sequence error happening to match the alternative nucleotide at an SNP site could lead to an incorrect genotype assignment (1/3 chance), the error rate of RIL genotype calls at a specific SNP site was calculated to be 1.06%. After defining the transition probabilities and emission probabilities (see Materials and Methods for details), Viterbi's algorithm (13) was used to determine the most likely underlying genotype of the RILs. Based on the results, the proportion of the three genotypes M/M:M/Z:Z/Z was estimated to be 49.16:0.32:50.52. We executed the HMM again using this ratio to perform genotype calling, and the results were consistent and thus converged to this ratio. In subsequent analyses, we masked all heterozygous sites (0.34%) as missing data. Consecutive SNP sites with the same genotype were lumped into blocks and a breakpoint was assumed at the transition between two different genotype blocks. Blocks with lengths less than 250 kb and the number of sequenced SNPs fewer than five were masked as missing data to avoid false double recombinations. In total, 600 breakpoints were identified for chromosome 5 in the 238 RILs.
Constructing the Bin Map and Evaluation by QTL Analysis.
In further processing, genotypes for regions at the transitions between two different genotype blocks were set to missing data and imputed using the R/qtl package (14). Markers cosegregating in two contiguous block borders were lumped as a bin (7, 15). After merging adjacent bins of the same genotype across the entire RIL population, a skeleton bin map was obtained with a total of 143 recombination bins on chromosome 5 for the 238 RILs (Fig. 3A). The average physical length of the recombination bins was 208.5 kb, ranging from 14.0 kb to 5.17 Mb. The genotypes of the RILs and physical locations of the bins are shown in Dataset S2.
The quality of the map was evaluated by using it to identify a QTL controlling grain width. Grain width data of the RIL population were collected from field experiments in 2008, with grain width of the RILs ranging from 2.15 to 3.55 mm. A simple Student's t test was used to locate the region associated with grain width. A sharp peak with the largest effect on bin 40 was detected, corresponding to the physical position of 5.162–5.368 Mb on chromosome 5. This region contains the cloned gene GW5 for grain width located at 5.360–5.361 Mb (8, 9) (Fig. 3C).
Discussion
We have successfully developed a method for accurately inferring the parental genotypes and constructing ultrahigh-density genetic linkage maps of high-quality SNPs based on very low depth sequences of RILs. Compared with previous efforts of map construction for populations of this cross using other markers (16–19), this map has the highest density, and was produced with the least labor, within the shortest time, and at lowest cost. The analyses have demonstrated two salient features of this method. The first is to obtain the parental genotypes consisting of the largest possible number of high-quality SNPs making maximum use of information provided by the low-depth sequences of the entire RIL population. The second feature is the highly accurate genotyping of the RILs with the help of the high-quality parental SNPs, despite the relatively low quality and low coverage of the RIL sequences. These two features enabled the construction of a high-quality and ultrahigh-density map.
The most critical step of this method is to infer parental genotypes. In this analysis, we transformed the challenge of inferring parental genotypes into finding two sets of parental genotype calls that generate the minimum number of recombination events in the RILs. The MPR was then developed based on the assumption that the observed recombination events in a set of local SNP sites should be the most parsimonious. It should be noted that the role of the low-coverage sequence of one parent in the analysis is to provide a reference for the inferred parental genotypes. The parental sequence per se does not contribute to the parental genotype inference, and thus is not required for inference or map construction. However, high-quality sequences of a reference genome or draft sequences with well-defined genomic locations would be necessary for this analysis.
It is also essential to filter out inferior SNPs for both high-quality inference of the parental genotypes and for RIL genotyping. Recent studies showed that there are tremendous variations in structure and copy numbers of sequences between different varieties (20, 21), and thus unique sequences in the reference genomes might not be unique in other varieties. Therefore, markers identified through direct comparison with the reference may be error-prone and should be refined before use. We devised a method of permutations based on redundant linkage information among adjacent SNPs involving resampling of windows of 50 SNPs followed by Bayesian inference which was highly effective to filter out inferior SNPs. With 1–20 permutations, 92–95% of the inferior SNPs could be filtered out while capturing nearly 99% of real SNPs, thus greatly improving the accuracy of SNP identification.
The application of HMM played a vital role in RIL genotyping. The model treats the adjacent SNP sites as points in a Markov chain and assigns a probability to an event with reference to the neighboring sites, thus taking into account the sequencing error rate, the genotypes of adjacent SNPs, and the physical distances between SNPs. Such treatment transformed the low-quality SNP data of RILs into a high-quality bin map.
We conducted Monte Carlo simulations to assess the effects of the factors that may affect the accuracy of MPR inference (SI Results). We found that the parental genotypes of most SNP sites could be deduced correctly even under SNP density of nearly 500 kb/SNP (Fig. S3C), a condition that most recombinant populations can meet (22). The simulation results also show that the use of 110 RILs is adequate to obtain an accuracy of 99% in inferring parental genotypes with SNP density no less than 49 kb/SNP under the sequencing coverage in this study (Fig. S4B). However, smaller numbers of RILs should be compensated by more sequencing per line to achieve proper coverage of the genome, and vice versa. Empirically, the total sequencing coverage of the population should not be less than 8× genome to provide power for reducing the false discovery rate. Although the influence of the window size at high SNP densities is small, under low SNP densities a larger window size leads to lower accuracy (Fig. S4A). A greater maximum step size of the perturbation would be more robust for obtaining the minimum number of recombination events, but it consumes more computational resources. As a tradeoff, we recommend setting parameters of the window size between 30 and 70 and a maximum step size of 3 for performing the MPR algorithm. We also evaluated the performance of MPR inference on simulated populations with different heterozygosity (SI Results). The simulation results showed that over 98% of the parental genotypes can be inferred correctly even when heterozygosity is 50% (Fig. S5). These results have significant implications for the potential applicability of the method, including applications in other species and populations other than RILs and even F2 populations.
The current Illumina Genome Analyzer IIx sequencing system has a throughput of 50 Gb per run, which allows sequencing a mouse population of 200 strains with 0.1× genome sequence per strain well within a single run. Because a plethora of new genome assemblies is available and various kinds of mapping populations have been constructed in many species, including plants (23, 24) and animals (25–27), the method developed here will be generally applicable and cost-effective for genotyping of mapping populations.
Materials and Methods
DNA Sequencing, Sequence Alignment, and Identification of Potential SNPs.
Total genomic DNA was isolated from leaf tissues of RILs (17) using the cetyltrimethyl ammonium bromide (CTAB) method. DNA sequencing followed essentially the procedures previously described (7). The latest version of genomic pseudomolecules of Oryza sativa L. ssp. japonica cv. Nipponbare was downloaded from Michigan State University (MSU assembly release 6.0, http://rice.plantbiology.msu.edu). All 36-mer read pairs of each RIL were aligned to the pseudomolecules using the software MAQ (11). A read pair with the two sequences mapped to identical positions was removed (with the “maq rmdup” command). MAQ provides scores for the base quality and mapping quality of Illumina-derived sequences. Base quality is analogous to phred scores (28) measuring the probability for the base call to be an error. Mapping quality of a read measures the confidence that a read is aligned correctly to the position where it is from. Low mapping quality scores indicate that there is more than one site in the genome where the read could be placed. To identify potential SNP sites, all mapping results of each RIL were merged in a mapping file. Base composition and base qualities on each genomic position were obtained from MAQ with the parameters “maq pileup –vP –q 40” using the merged mapping file. Reads with mapping quality ≥40 were selected for subsequent analysis. A potential SNP site should be biallelic in RILs and was identified when satisfying the following criteria: (i) only two different nucleotides appeared on this position with a sum of base quality for each nucleotide ≥60; (ii) each of the two nucleotides was supported by at least four reads; (iii) at least one base call of each nucleotide had base quality ≥20; and (iv) the sequencing depth was no more than 30 to avoid repetitive sequences.
Deducing Parental Genotypes and Filtering Out Inferior SNP Markers.
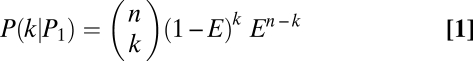
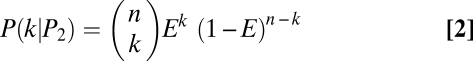
Bayesian inference based on resampling procedures was used to determine parental genotypes and filter out inferior SNPs. For an allele at a given SNP site, assume there are n independent genotype calls obtained from the resampling procedures and the error rate of parental genotype calling using the MPR algorithm is E. Under the condition of the allele coming from parent 1 (P1) or parent 2 (P2), or that it is an inferior SNP (PN), the probability of observing k genotype calls of parent 1 for the allele would each follow a binomial distribution:
 |
 |
 |
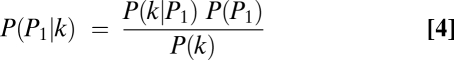
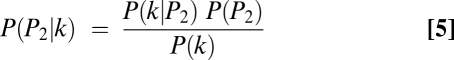
Let P(P1|k), P(P2|k), and P(PN|k) be the posterior probabilities that the allele comes from P1, P2, or PN given the observed k genotype calls of parent 1. These probabilities were calculated as
 |
 |
 |
The genotype of the allele is determined based on the highest posterior probability at the given SNP site:
The probability of a site being an inferior SNP site P(PN) is estimated as the proportion of inferior SNPs in all SNP sites, and the probability of the allele from parent 1 P(P1) or parent 2 P(P2) is P(P1) = P(P2) = (1 − P(PN))/2. We began with P(P1) = P(P2) = P(PN) = 1/3, and new estimates of P1, P2, or PN were obtained by iteration until the estimates were stabilized. SNP sites with the highest posterior probability of P(PN|k) will be removed. In addition, we found that the genotype calls of an allele at a high-quality SNP site would usually be consistent. If there are two observed genotypes for an allele, a restriction on the number of genotype calls of the minor genotype could further remove inferior SNPs.
Genotype Calling Using the Hidden Markov Model.
Raw genotypes of SNPs were assigned according to the deduced parental genotypes. To construct the HMM, we estimated transition probability (the probability to move from one homozygous genotype to another homozygous genotype or homozygous genotype to heterozygous genotype) by assuming 1 centimorgan (cM) per 244 kb based on previous studies (29), which was used to convert the physical distances between SNPs to genetic distances as well as to recombination probabilities using the Haldane map function. Assuming the sequence error rate as E, the emission probability (the probability to observe a certain genotype at an SNP site when given a hidden genotype) from a homozygous genotype to itself was 1 − E and to another homozygous genotype was E. The emission from a heterozygous genotype to the two homozygous genotypes had the same probability of 0.5, but emission probability of a given heterozygous genotype to be consecutively observed as a homozygous genotype would decrease by a factor of 0.5, for example, the second 0.25 and the third 0.125. Probabilistic parameters of the hidden Markov model are shown in Fig. 3B.
Software and Data Availability.
An R package MPR was developed with these algorithms for parental genotype inference and bin map construction. The MPR package, SNP markers, and population data are available at http://www.ncpgr.cn/supplements/MPR_genotyping. The raw Illumina sequencing data from this study have been submitted to the NCBI Sequence Read Archive under accession number SRA012177.
Supplementary Material
Acknowledgments
This research was supported by grants from the National Special Key Project of China on Functional Genomics of Major Plants and Animals, the National Natural Science Foundation of China, and the National Program on Key Basic Research Project.
Footnotes
The authors declare no conflict of interest.
Data deposition: The raw Illumina sequencing data from this study have been submitted to the National Center for Biotechnology Information Sequence Read Archive (accession no. SRA012177).
This article contains supporting information online at www.pnas.org/lookup/suppl/doi:10.1073/pnas.1005931107/-/DCSupplemental.
References
- 1.Yang H, et al. A customized and versatile high-density genotyping array for the mouse. Nat Methods. 2009;6:663–666. doi: 10.1038/nmeth.1359. [DOI] [PMC free article] [PubMed] [Google Scholar]
- 2.Gunderson KL, Steemers FJ, Lee G, Mendoza LG, Chee MS. A genome-wide scalable SNP genotyping assay using microarray technology. Nat Genet. 2005;37:549–554. doi: 10.1038/ng1547. [DOI] [PubMed] [Google Scholar]
- 3.Xie WB, et al. Single feature polymorphisms between two rice cultivars detected using a median polish method. Theor Appl Genet. 2009;119:151–164. doi: 10.1007/s00122-009-1025-2. [DOI] [PubMed] [Google Scholar]
- 4.Craig DW, et al. Identification of genetic variants using bar-coded multiplexed sequencing. Nat Methods. 2008;5:887–893. doi: 10.1038/nmeth.1251. [DOI] [PMC free article] [PubMed] [Google Scholar]
- 5.Cronn R, et al. Multiplex sequencing of plant chloroplast genomes using Solexa sequencing-by-synthesis technology. Nucleic Acids Res. 2008;36:e122. doi: 10.1093/nar/gkn502. [DOI] [PMC free article] [PubMed] [Google Scholar]
- 6.Baird NA, et al. Rapid SNP discovery and genetic mapping using sequenced RAD markers. PLoS One. 2008;3:e3376. doi: 10.1371/journal.pone.0003376. [DOI] [PMC free article] [PubMed] [Google Scholar]
- 7.Huang XH, et al. High-throughput genotyping by whole-genome resequencing. Genome Res. 2009;19:1068–1076. doi: 10.1101/gr.089516.108. [DOI] [PMC free article] [PubMed] [Google Scholar]
- 8.Shomura A, et al. Deletion in a gene associated with grain size increased yields during rice domestication. Nat Genet. 2008;40:1023–1028. doi: 10.1038/ng.169. [DOI] [PubMed] [Google Scholar]
- 9.Weng J, et al. Isolation and initial characterization of GW5, a major QTL associated with rice grain width and weight. Cell Res. 2008;18:1199–1209. doi: 10.1038/cr.2008.307. [DOI] [PubMed] [Google Scholar]
- 10.Ouyang S, et al. The TIGR Rice Genome Annotation Resource: Improvements and new features. Nucleic Acids Res. 2007;35(Database issue):D883–D887. doi: 10.1093/nar/gkl976. [DOI] [PMC free article] [PubMed] [Google Scholar]
- 11.Li H, Ruan J, Durbin R. Mapping short DNA sequencing reads and calling variants using mapping quality scores. Genome Res. 2008;18:1851–1858. doi: 10.1101/gr.078212.108. [DOI] [PMC free article] [PubMed] [Google Scholar]
- 12.Eddy SR. What is a hidden Markov model? Nat Biotechnol. 2004;22:1315–1316. doi: 10.1038/nbt1004-1315. [DOI] [PubMed] [Google Scholar]
- 13.Viterbi AJ. Error bounds for convolutional codes and an asymptotically optimum decoding algorithm. IEEE Trans Inf Theory. 1967;13:260–269. [Google Scholar]
- 14.Broman KW, Wu H, Sen S, Churchill GA. R/qtl: QTL mapping in experimental crosses. Bioinformatics. 2003;19:889–890. doi: 10.1093/bioinformatics/btg112. [DOI] [PubMed] [Google Scholar]
- 15.van Os H, et al. Construction of a 10,000-marker ultradense genetic recombination map of potato: Providing a framework for accelerated gene isolation and a genomewide physical map. Genetics. 2006;173:1075–1087. doi: 10.1534/genetics.106.055871. [DOI] [PMC free article] [PubMed] [Google Scholar]
- 16.Yu SB, et al. Importance of epistasis as the genetic basis of heterosis in an elite rice hybrid. Proc Natl Acad Sci USA. 1997;94:9226–9231. doi: 10.1073/pnas.94.17.9226. [DOI] [PMC free article] [PubMed] [Google Scholar]
- 17.Xing Z, et al. Characterization of the main effects, epistatic effects and their environmental interactions of QTLs on the genetic basis of yield traits in rice. Theor Appl Genet. 2002;105:248–257. doi: 10.1007/s00122-002-0952-y. [DOI] [PubMed] [Google Scholar]
- 18.Hua JP, et al. Genetic dissection of an elite rice hybrid revealed that heterozygotes are not always advantageous for performance. Genetics. 2002;162:1885–1895. doi: 10.1093/genetics/162.4.1885. [DOI] [PMC free article] [PubMed] [Google Scholar]
- 19.Hua JP, et al. Single-locus heterotic effects and dominance by dominance interactions can adequately explain the genetic basis of heterosis in an elite rice hybrid. Proc Natl Acad Sci USA. 2003;100:2574–2579. doi: 10.1073/pnas.0437907100. [DOI] [PMC free article] [PubMed] [Google Scholar]
- 20.Ossowski S, et al. Sequencing of natural strains of Arabidopsis thaliana with short reads. Genome Res. 2008;18:2024–2033. doi: 10.1101/gr.080200.108. [DOI] [PMC free article] [PubMed] [Google Scholar]
- 21.Hastings PJ, Lupski JR, Rosenberg SM, Ira G. Mechanisms of change in gene copy number. Nat Rev Genet. 2009;10:551–564. doi: 10.1038/nrg2593. [DOI] [PMC free article] [PubMed] [Google Scholar]
- 22.Frazer KA, et al. A sequence-based variation map of 8.27 million SNPs in inbred mouse strains. Nature. 2007;448:1050–1053. doi: 10.1038/nature06067. [DOI] [PubMed] [Google Scholar]
- 23.Singer T, et al. A high-resolution map of Arabidopsis recombinant inbred lines by whole-genome exon array hybridization. PLoS Genet. 2006;2:e144. doi: 10.1371/journal.pgen.0020144. [DOI] [PMC free article] [PubMed] [Google Scholar]
- 24.Buckler ES, et al. The genetic architecture of maize flowering time. Science. 2009;325:714–718. doi: 10.1126/science.1174276. [DOI] [PubMed] [Google Scholar]
- 25.Flint J, Valdar W, Shifman S, Mott R. Strategies for mapping and cloning quantitative trait genes in rodents. Nat Rev Genet. 2005;6:271–286. doi: 10.1038/nrg1576. [DOI] [PubMed] [Google Scholar]
- 26.Lai CQ, et al. Speed-mapping quantitative trait loci using microarrays. Nat Methods. 2007;4:839–841. doi: 10.1038/nmeth1084. [DOI] [PubMed] [Google Scholar]
- 27.Persson A, et al. Natural variation in a neural globin tunes oxygen sensing in wild Caenorhabditis elegans. Nature. 2009;458:1030–1033. doi: 10.1038/nature07820. [DOI] [PubMed] [Google Scholar]
- 28.Ewing B, Green P. Base-calling of automated sequencer traces using phred. II. Error probabilities. Genome Res. 1998;8:186–194. [PubMed] [Google Scholar]
- 29.Chen M, et al. An integrated physical and genetic map of the rice genome. Plant Cell. 2002;14:537–545. doi: 10.1105/tpc.010485. [DOI] [PMC free article] [PubMed] [Google Scholar]
Associated Data
This section collects any data citations, data availability statements, or supplementary materials included in this article.