Abstract
Background
Glomerular filtration rate (GFR) is a widely accepted parameter in assessing overall renal function. This study sought to assess the effect of glucose lowering on GFR in diabetic patients admitted for short term therapy at Mulago hospital.
Methods
This was a descriptive study where consenting patients were consecutively recruited. Glomerular filtration rate was measured using creatinine clearance in 40 type I and II diabetes mellitus patients admitted on the basis of a glucometer reading of RBS ≥ 300mg/dl both at admission and discharge. Data was analyzed using a paired sample t-test and p-value set at 0.05 (95% CI).
Results
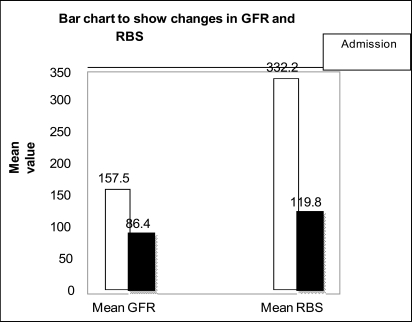
A total of 40 patients were assessed. Their mean age was 49.8years. 82.5% of them had type II DM while only 17.5% had type I DM. The average duration of disease was 7years. GFR was found to decrease from 157.4ml/min on admission to 86.4ml/min at discharge (p=0.001). Random blood sugar levels decreased from 332.2mg/dl on admission to 119.8mg/dl at discharge (p=0.000).
Conclusion/Recommendation
Results imply that glycaemic control lowers the GFR in diabetic patients admitted for short term treatment. A reduction in GFR reflects reduction of hyperfiltration, a process that starts diabetic nephropathy. Good glycaemic control will go along way to delay onset of diabetic nephropathy.
Introduction
Diabetes mellitus causes micro and macro-vascular changes in the body and this includes diabetic nephropathy. It does this through hyperglycemia which leads to hyperfiltration and hence increased glomerular filtration rate1,2. Later as the disease progresses the patient might progress into end stage renal disease. It is therefore imperative that diabetic patients' renal function is assessed and monitored in order to avoid the risk of progression to end stage renal disease.
Currently tests that are used to assess renal function in the Mulago national referral and teaching hospital include serum electrolytes, urea and serum creatinine yet by the time these are deranged there is significant renal damage depicted by a significant decrease in GFR3. It is desirable therefore to assess renal function of these patients using the single most important test GFR. This is because GFR is the best widely used and accepted measure of renal function1. This would allow for early detection of a derangement in renal function and allows for institution of more rigorous management. Improved monitoring of renal function of diabetic patients also provides advance warning of progression to end stage renal disease. This study sought to determine the effect of glucose lowering on glomerular filtration rate in diabetes mellitus patients in Mulago national referral hospital.
Methods
This was a descriptive study which was done with approval from the research and ethics committees of Faculty of Medicine Makerere University and Mulago hospital. A total of 40 type 1 and type 2 diabetic patients were recruited after informed consent into the study consecutively as they were admitted to the medical ward of Mulago hospital. These patients that were recruited into the study were those with hyperglycemia (RBS e”300mg/dl) and also presented with general body weakness, polyuria, polydipsia and polyphagia. While on the ward, these patients were managed with insulin and oral hypoglycemic agents (OHAs) and 80% of them received antihypertensives (angiotensin converting enzyme inhibitors, ACEIs including Nifedipine and Captopril).
A standard patient form was used to record their age, sex, height and weight. Random blood sugar was measured using a glucometer. Blood and urine samples were drawn from these patients and sent to the laboratory for the measurement of GFR. In the laboratory, plasma and urine levels of creatinine (Pcr and Ucr respectively), were obtained by the spectrometry method. Glomerular filtration rate was then estimated using creatinine clearance formula that is
Data was entered into Ms Excel software and exported to SPSS 11.5 software for analysis. Differences in GFR and Random blood sugar were analyzed using the paired sample t-test and p-value set to 0.05 at 95%C.I.
Results
A total of 40 diabetic patients ranging from 18 to 85years with an average of 48years were assessed. Both male and female participants were equally represented in the study. The average duration of disease was 7years. The majority 33 (82.5%) of these patients had type 2 DM while only 7 (17.5%) had type 1 DM as shown intable 1.
Table 1.
Table showing the percentage distribution of patients in terms of sex, type of disease and treatment
| Characteristic | Variable Category |
No=40 Frequency (%) |
| Sex | M | 20(50 |
| F | 30(50 | |
| Type of disease | 1 | 7(17.5) |
| 11 | 33 (82.5) | |
| Type of treatment at study | Oral | 11(27.5) |
| time | Insulin | 29 (72.5) |
There was a significant decrease in GFR on average from admission (157ml/min) to discharge (86ml/min). Random blood sugar reduced from 332mg/dl on admission to 119mg/dl at discharge as shown intable 2.
Table 2.
Changes in GFR and random blood sugar from admission to discharge
| Parameter | Mean (admission) | Mean (discharge) | p-value (95% CI) |
| Random blood sugar (mg/dl) |
332.2 | 119.8 | 0.000 |
| GFR (ml/min) | 157.4 | 86.4 | 0.001 |
In terms of hyperfiltration depicted in the GFR at admission, the proportion of patients that were hyperfiltrating was a bit higher in type 1 DM (57%) than in type 11 (53%) as shown in the followingtable 3
Table 3.
Proportion of patients hyperfiltrating at admission
| Type of DM | Number of patients |
Proportion of patients hyperfiltrating (GFR > 130ml/min) |
| Type 1 | 7 | 4 (57%) |
| Type 2 | 33 | 17 (53%) |
There were observed differences in the way GFR values changed after therapy among different groups in terms of age, sex and BMI of the patients as shown intable 4
Table 4.
GFR variations in terms of age, sex and BMI
| Group | Mean GFR admission (ml/min/1.73m2 |
Mean GFR discharge (ml/min/1.73m2 |
p-value (95%,C.I) |
| Sex | |||
| Females | 166.7 | 77.7 | 0.000 |
| Males | 147.8 | 95.5 | 0.142 |
| Age | |||
| ≤ 40 | 183.4 | 91.9 | 0.078 |
| 41–60 | 166.7 | 95.4 | 0.001 |
| 61+ | 114.4 | 67.5 | 0.198 |
| BMI | |||
| ≤ 25 | 142.3 | 86.2 | 0.045 |
| > 25 | 179.4 | 86.6 | 0.005 |
The difference in GFR in terms of sex was statistically significant in women (p=0.000) unlike in men. In terms of age, the GFR decrease was only significant (p=0.001) in the 41–60 age group unlike in other age groups.
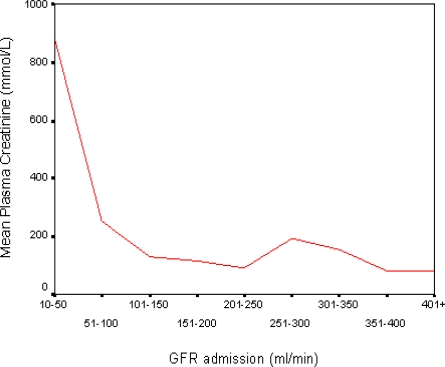
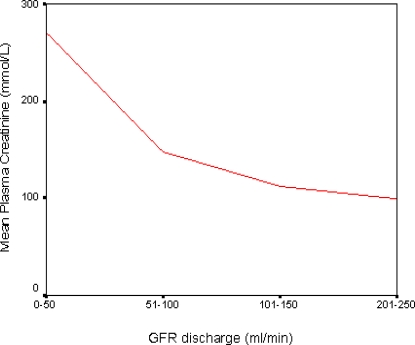
To emphasize the importance of using GFR as a measure of renal function over serum creatinine, the following results were obtained as shown in the graphs below;
The two graphs above show that serum plasma creatinine increased as GFR was declining and only decreased when GFR (renal function in turn) had already declined by 50%. Hence serum creatinine is not the best parameter to be used to measure renal function.
Discussion
Glucose lowering therapy correlated with a lowering of the GFR. This was observed from the fact that the GFR levels on admission were high and above the normal range (157.4; >80–130ml/min) and they decreased to levels in the normal range (86.4ml/min) Additionally random blood sugar levels were also high on admission (hyperglycemic) and were lowered to normal at discharge. This implies that glucose lowering therapy or glycaemic control has an effect of lowering GFR. These findings are similar to Christiansen's and Schmitz's findings that GFR decreased after short term treatment. Physiologically, high glucose levels are known to cause hyperfiltration (GFR above normal) of the kidney. Since the glucose levels were lowered, the kidney's function of filtering materials goes back to the normal rate. Results from this study are similar to the findings by Rudy 2003 and Mongensen 2004 who found that glycaemic control reduces hyperfiltration and hence having an effect of lowering the GFR.
In terms of sex, GFR decreased both in males and females although the decrease in males was not statistically significant. This could partly be explained by Wishner's findings that complications of DM have a significant impact on women (Wishner 1996:47).
The GFR at discharge lies in the normal range but it tends towards the lower normal. This could be attributed to the duration at which these patients had stayed with diabetes mellitus since the longer the patient stays with the disease, the worse their renal function gets.
Since GFR is the most reliable estimate of the amount of residual kidney function as mentioned by Alexander 2007, the results of this study imply that control of blood glucose removed the hyperfiltration which is reflected in the reduction in GFR. The value of GFR at discharge was in the normal range implying repaired renal function of diabetes mellitus patients improved after short term admission for hyperglycemia treatment.
Conclusion
Glucose lowering therapy has an effect of lowering the glomerular filtration rate in diabetic patients admitted for short term therapy. A longer cohort study though needs to be done to follow up these patients for a longer time to actually assess their overall renal disease progression while on treatment. GFR should also be adopted as a routine test for assessing renal function in Mulago national referral and teaching hospital since it gives a clear picture of the overall status of renal function.
Figure 1.
above emphasizes the differences between the parameters on admission and at discharge. It is observed that GFR and RBS were higher at admission compared to discharge.
Figure 2.
Relationship between Plasma Creatinine and GFR on admission
Figure 3.
Relationship between Plasma Creatinine and GFR on discharge
References
- 1.Cynda AJ, Andrew SL, Josef C, Adeera L, Joseph L, Garabed E. Clinical practice guidelines for chronic kidney disease in adults: part 1. Definition, disease stages, evaluation, treatment and risk factors. American Family Physicians. 2004 sep. [PubMed] [Google Scholar]
- 2.Gill GV, Hardy KJ, Patrick AW. Random blood glucose estimation in type 2 diabetes: does it reflect overall glycaemic control? Diabetic medicine. 1994;11:705–708. doi: 10.1111/j.1464-5491.1994.tb00337.x. [DOI] [PubMed] [Google Scholar]
- 3.Nicholas Robert Loon. Diabetic kidney disease: preventing dialysis and transplantation. Clinical diabetes. 2003;21:55–63. [Google Scholar]
- 4.Rudy WB. Blood pressure or glycaemic control: which is more important in nephropathy?
- 5.Mogensen CE, Cooper ME. Diabetic renal disease: from recent studies to improved clinical practice. Diabetic medicine. 2004;21:4–17. doi: 10.1111/j.1464-5491.2004.01121.x. [DOI] [PubMed] [Google Scholar]
- 6.Wishner KL. Diabetes mellitus: its impact on women. Int J Fertil. 1996;41:177–186. [PubMed] [Google Scholar]
- 7.Alexander S. Guidelines recommend early identification and treatment of CKD. 2007.
- 8.Craig & Tisher, author. Diabetic nephropathy. Nephrology for the house officers 2nd Edn. 1993;2:52–55. [Google Scholar]
- 9.Girach A, Manner D, Porta M. Diabetic microvascular complications: can patients at risk be identified? Int J Clin Prac. 2006;60(11):1471–1483. doi: 10.1111/j.1742-1241.2006.01175.x. [DOI] [PubMed] [Google Scholar]
- 10.Gross JL, Friedman R, Azevedo MJ, Silveiro SP, Pecis M. Effect of age and sex on glomerular filtration rate measured by 51Cr-EDTA. Braz J Med Biol Res. 1992;25(2):129–134. [PubMed] [Google Scholar]
- 11.Guyton AC, Hall JE. Textbook of Medical Physiology. 10th Ed. Philadelphia: W.B Saunders Company; 2000. [Google Scholar]
- 12.Haumba SM. Glomerular filtration rates of diabetes mellitus patients attending Mulago hospital before onset of end stage renal disease. Albert Cook Library, Makerere University College of Health Sciences; 2001. M. MED Thesis 2001. [Google Scholar]
- 13.Harvey JN. Diabetic nephropathy: new drugs can help face a growing challenge. BMJ. 2002 Jul 13;325:59–60. doi: 10.1136/bmj.325.7355.59. [DOI] [PMC free article] [PubMed] [Google Scholar]
- 14.Jorge LG, Mirela J, de Azevedo, et al. Diabetic nephropathy: diagnosis, Prevention and Treatment. Diabetes care. 2005;28(1):164–176. doi: 10.2337/diacare.28.1.164. [DOI] [PubMed] [Google Scholar]
- 15.Kopyt NP. Slowing progression along the renal disease continuum. J Am Osteopath Assoc. 2005 Apr;105(4):207–215. [PubMed] [Google Scholar]
- 16.Mauer SM, Steffes MW, Azar S, et al. The effect of Goldblatt hypertension on development of glomerular lesions of DM in the rat. Diabetes. 1978;27:738–744. doi: 10.2337/diab.27.7.738. [DOI] [PubMed] [Google Scholar]
- 17.Mogensen CE. Prediction of clinical diabetic nephropathy in IDDM patients: alternatives to Microalbuminuria. Diabetes. 1990;39:761. doi: 10.2337/diab.39.7.761. [DOI] [PubMed] [Google Scholar]
- 18.Mogensen CE, Andersen JJF. Increased kidney size and GFR in untreated juvenile diabetes: normalisation by insulin treatment. Diabetologia. 1975;(1):221–224. doi: 10.1007/BF00422325. [DOI] [PubMed] [Google Scholar]
- 19.Rudberg S, Persson B, Dahlquist G. Increased glomerular filtration rate as a predictor of diabetic nephropathy: an 8year prospective study. Kidney Int. 1992;41:822. doi: 10.1038/ki.1992.126. [DOI] [PubMed] [Google Scholar]
- 20.Taal MW, Brenner BM. Predicting initiation and progression of chronic kidney disease: developing renal risk scores. Kidney int. 2006;70(10):1694–1705. doi: 10.1038/sj.ki.5001794. [DOI] [PubMed] [Google Scholar]
- 21.Vallon Volker, Blantz Roland C, Thomson Scott. Glomerular Hyperfiltration and the Salt Paradox in Early Type 1 Diabetes Mellitus: a Tubulo-Centric View. J Am Soc Nephrol. 2003;14:530–537. doi: 10.1097/01.asn.0000051700.07403.27. [DOI] [PubMed] [Google Scholar]


