Abstract
Introduction
The aim of this study was to assess the differences in airway shape and volume among subjects with various facial patterns.
Methods
Cone-beam computed tomography records of 62 nongrowing patients were used to evaluate the pharyngeal airway volume (superior and inferior compartments) and shape. This was done by using 3-dimensional virtual surface models to calculate airway volumes instead of estimates based on linear measurements. Subgroups of the sample were determined by anteroposterior jaw relationships and vertical proportions.
Results
There was a statistically significant relationship between the volume of the inferior component of the airway and the anteroposterior jaw relationship (P = 0.02), and between airway volume and both size of the face and sex (P = 0.02, P = 0.01). No differences in airway volumes related to vertical facial proportions were found. Skeletal Class II patients often had forward inclination of the airway (P <0.001), whereas skeletal Class III patients had a more vertically oriented airway (P = 0.002).
Conclusions
Airway volume and shape vary among patients with different anteroposterior jaw relationships; airway shape but not volume differs with various vertical jaw relationships. The methods developed in this study make it possible to determine the relationship of 3-dimensional pharyngeal airway surface models to facial morphology, while controlling for variability in facial size.
Several lines of evidence from cephalometric studies support a link between presumed respiratory mode and facial morphology. These include the classic studies of mandibular orientation and growth in patients before and after adenoidectomy by Linder-Aronson1 and Linder-Aronson et al2 and a case report that documents downward-backward rotation in patients with total nasal obstruction.3 More recently, Zettergren-Wijk et al4 showed a certain degree of normalization of growth after adenoidectomy in a group of obstructive sleep apnea patients. Guray and Karaman,5 studying a similar group, could not replicate the results of Linder-Aronson and concluded that adenoidectomy might change only the breathing mode, without a significant effect on malocclusion and facial type. Fields et al,6 using special instrumentation to totally account for the amount of oral vs nasal airflow in normal and long-faced children, showed that the relationship between oral vs nasal breathing and growth in the long-faced pattern is not clear-cut. Long-faced children were overrepresented in the group of these subjects with a high percentage of oral breathing, but predominantly oral breathing was found in some children with normal facial morphology, and some long-faced children had a low percentage of oral breathing. The normal and long-faced subjects had similar tidal volumes and minimum nasal cross-sectional areas.
Postural relationships of the head, jaws, and tongue are established in the first moments after birth as the airway is opened and stabilized, and are altered as necessary thereafter to maintain the airway.7 It seems reasonable that the link between respiratory mode and the development of malocclusion could be soft-tissue pressures against the dentition that might affect tooth eruption, dental arch form, and possibly the direction of mandibular and maxillary growth. Solow and Kreiborg 8 and Solow and Sandham9 formally expressed this view in their “soft-tissue stretching hypothesis.” A change in jaw posture that led to downward-backward rotation of the mandible, or a change in head posture such as head extension, could lead to stretching of the lips, cheeks, and musculature. The result would be upright incisors and narrower dental arches, which often (but not always) are observed in patients with a long-faced and open-bite growth pattern.
Solow’s hypothesis implies that oral and pharyngeal soft tissues also would be affected by a change in head, jaw, or tongue posture. The value of lateral cephalometric radiographs to evaluate the upper airway is limited because they provide 2-dimensional (2D) images of complex 3-dimensional (3D) anatomic structures.10 Three-dimensional analyses of the airway volumes and shape are required to understand oral and pharyngeal adaptations to varying respiratory conditions and proprioceptive stimuli. Aboudara et al11 showed that records from cone-beam computed tomography (CBCT) obtained for clinical problems such as impacted teeth or temporomandibular disorders now are an acceptable way to evaluate pharyngeal soft-tissue relationships and airway volume. The goal of this study was to examine the hypothesis that pharynx volumes and shapes differ among the various facial morphologies, controlling for differences of facial size.
MATERIAL AND METHODS
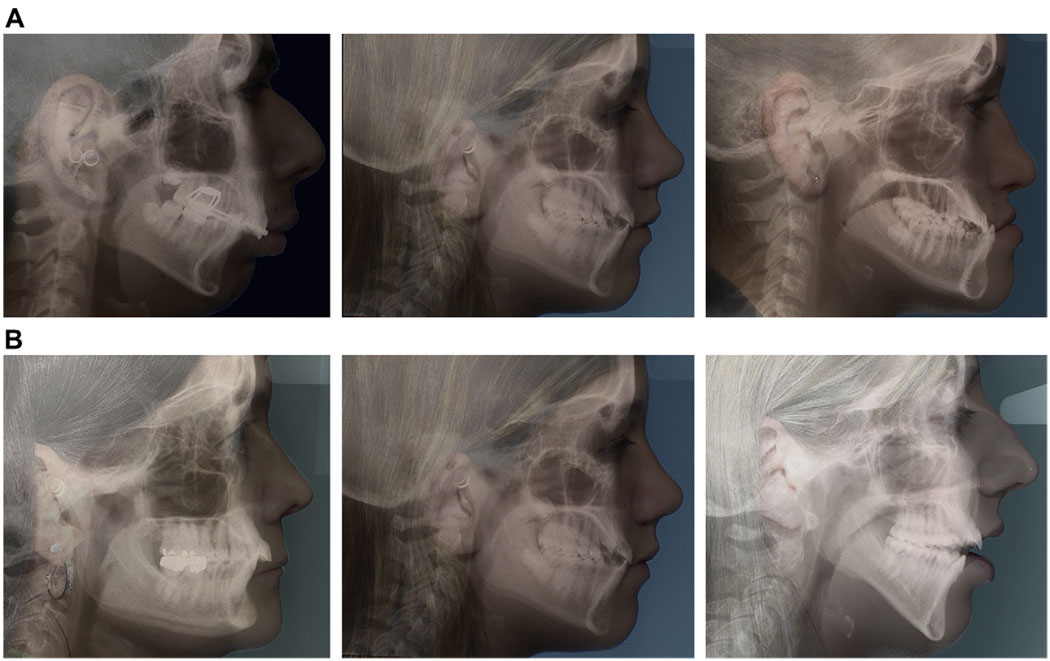
From the records of an oral radiology clinic in Sacramento, Calif, 62 patients (ages, 17–46 years) who had CBCT scans of the head along with facial photographs and a lateral cephalometric radiograph were selected for this study (Fig 1). None had previous orthognathic surgery, a syndrome diagnosis, or detectable pathology along the upper airway through inspection of the images. Age and sex characteristics of the subjects, subdivided as outlined below, are shown in Table I. Age was not statistically significantly different between the sexes (P= 0.12).
Fig 1.
Facial morphology reflects the underlying skeletal configuration and internal soft tissues. The sample was divided into 3 groups according to 2 criteria: A, the AP relationship of the jaws, and B, the vertical pattern of the face.
Table I.
Sample distribution by age, sex, and size of face in both vertical and anteroposterior groups
| Vertical groups | AP groups | |||||
|---|---|---|---|---|---|---|
| Short (n = 21) | Average (n = 20) | Long (n = 21) | I (n = 21) | II (n = 21) | III (n = 21) | |
| Age (y) | ||||||
| Mean (SD) | 24.54 (7.36) | 26.00 (7.88) | 23.55 (7.42) | 25.16 (7.63) | 24.83 (7.61) | 23.97 (7.57) |
| Sex | ||||||
| Female | 12 (32%) | 13 (35%) | 12 (32%) | 14 (38%) | 14 (38%) | 9 (24%) |
| Male | 9(33%) | 7 (28%) | 9 (36%) | 7 (28%) | 8 (32%) | 10 (40%) |
The CBCT images were obtained with and iCAT scanner (Imaging Sciences International, Hatfield, Pa) with a single 360° rotation, producing 306 basis images. All images had a medium or full field of view that allowed visualization of both the cranial base and the face. Primary and secondary reconstructions of the data were performed with the iCAT software, leading to images with an isotropic voxel size of 0.3 mm3. Before they were entered into the database for this study, the CBCT images were anonymized by an algorithm that removed patient identifiers from the files.
Anteroposterior (AP) skeletal type (Class I, Class II, or Class III) was established initially from visual inspection of the facial photographs and the lateral cephalometric radiograph, and confirmed via measurement of overjet, mandibular length, and ANB angle on synthetic lateral and posteroanterior (PA) cephalograms created with Dolphin 3D beta (version 2.3, Dolphin Imaging, Chatsworth, Calif).
The discrimination process for the vertical groups was based on a bony facial index, calculated as the ratio between the bony bizygomatic width divided by the nasion-menton distance projected onto an orthogonal coordinate system. The facial index values were split into tertiles to establish the vertical groups. Age, sex, and distribution of the subjects by AP and vertical groups are shown in Table I.
For both the lateral and PA synthetic cephalograms, the head was oriented with a line 6° down from sella-nasion as the horizontal axis (approximately the true horizontal in most people). Whenever this orientation method created an unrealistic head posture, the synthetic cephalogram was reoriented according to the soft-tissue appearance on the CBCT data. This occurred in 4 of the 62 subjects.
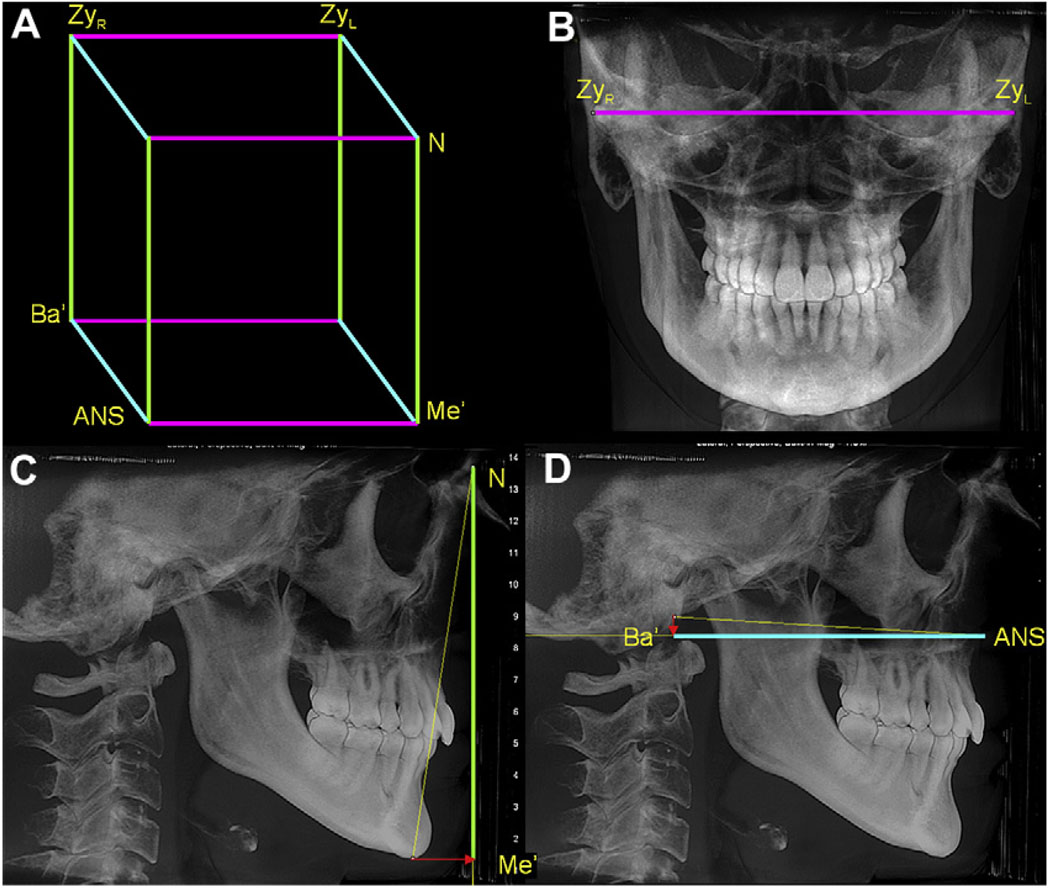
The size of the face was established from the PA and lateral synthetic cephalograms, as a rectangular prism encompassing the facial bones. This prism was constructed as shown in Figure 2. As expected, the average size of the face was greater in the men than in the women (P <0.01).
Fig 2.
The size of face was established by creating a prism (A) with edges as (B) the bizygomatic width, which is parallel to the true horizontal and does not need to be projected, (C) the Na-Me distance projected on the y-axis and (D) the Ba-ANS distance projected on the z-axis.
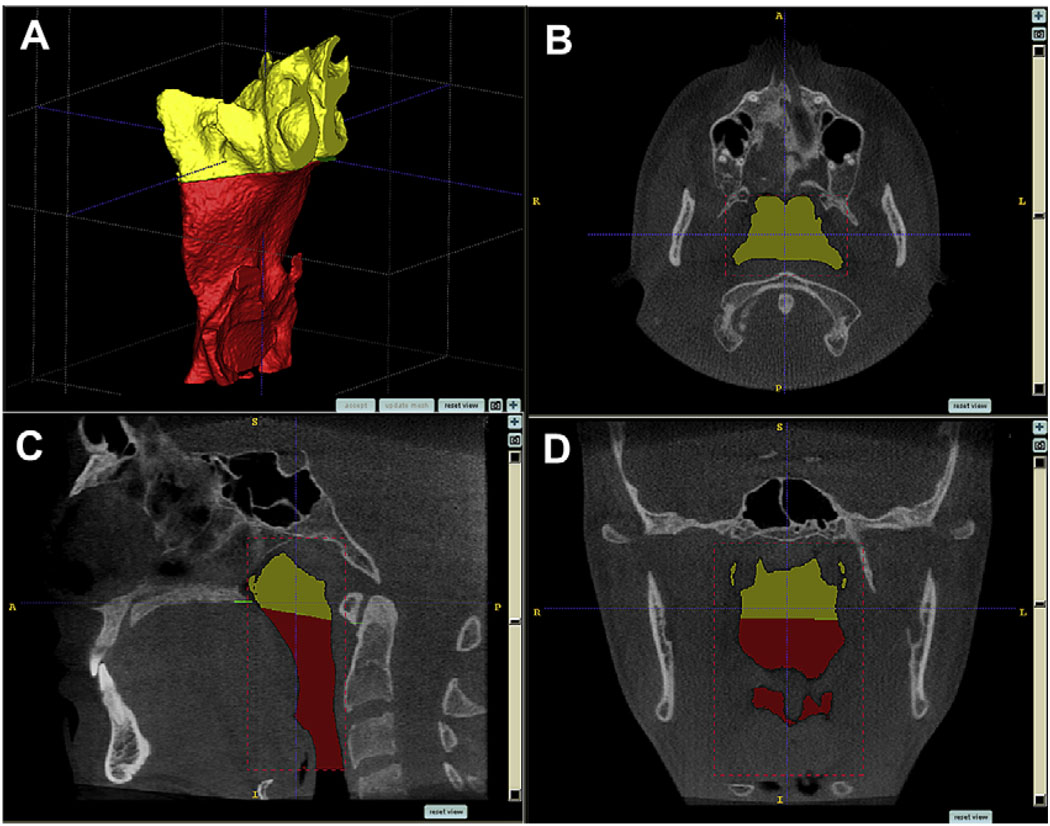
To build 3D models of the airways for the 62 subjects, the anonymous CBCT data were loaded into InsightSNAP software (version 1.4.0, Cognitica, Philadelphia, Pa) that had been adapted at the University of North Carolina by the Neuro-Image Analysis Laboratories to allow semiautomatic segmentation of the airway. The semiautomatic nature of the segmentation process refers to the 3D growth of the level-set geodesic snakes. Although it is mainly automatic, there are 2 interactive steps to the segmentation: selection of an initial threshold and placement of initial seed regions.12 The segmentation process is then defined as the construction of 3D virtual surface models (called segmentations) by regional growth of the initial seed regions to match best the volumetric data. This segmentation method has been described, validated, and tested for accuracy, and is superior to the conventional slice-by-slice, manual tracing method.12 The limits for segmentation and an example of a virtual surface model of the pharyngeal airway are shown in Figure 3.
Fig 3.
Segmentation by user-initialized 3D surface evolution (A). Limits for airway analysis are: (B, C) anterior, a vertical plane through posterior nasal spine perpendicular to the sagittal plane at the lowest border of the vomer; posterior, the posterior wall of the pharynx; lateral, the lateral walls of the pharynx, including the full extensions of the lateral projections; lower, a plane tangent to the most caudal medial projection of the third cervical vertebra perpendicular to the sagittal plane; (C, D) upper, the highest point of the nasopharynx, coinciding with the posterior choanae and consistent with the anterior limit.
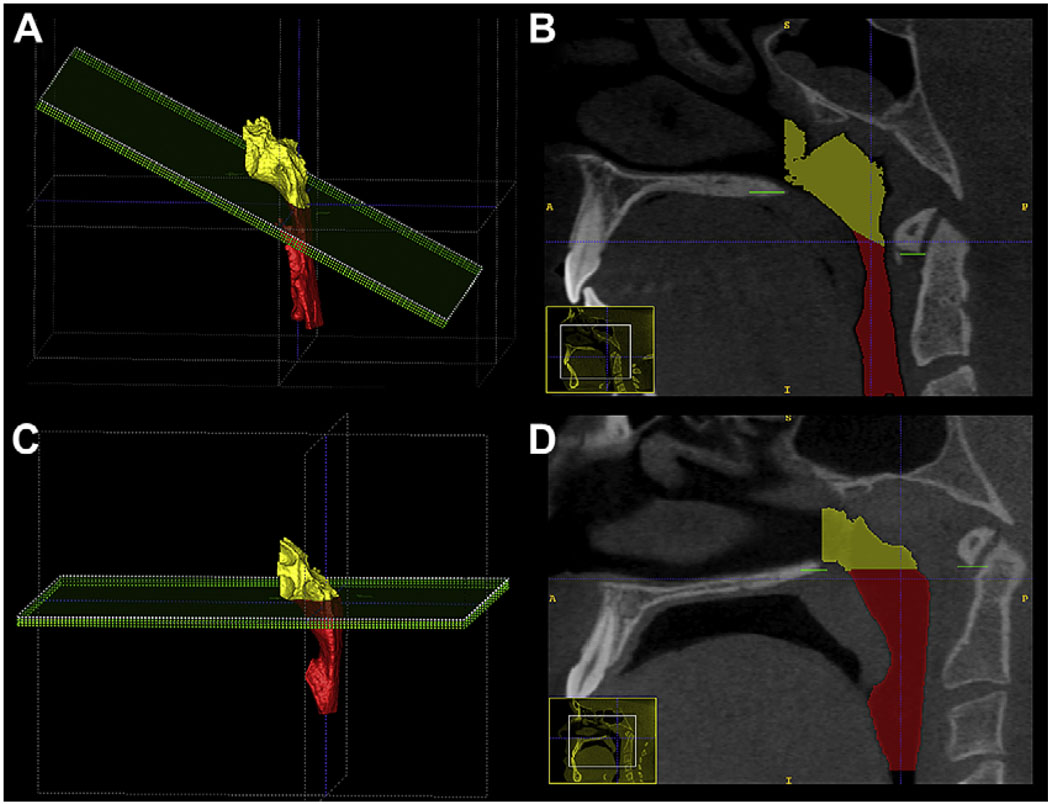
Once segmented, the pharyngeal airways were refined to obtain the true shape of the airway by eliminating projections that did not belong to the airway and then were subdivided into superior and inferior compartments by a plane perpendicular to the sagittal plane that included the posterior nasal spine and the lower medial border of the first cervical vertebra (Fig 4). Airway volumes were measured in cubic millimeters with the InsightSNAP measuring tool. The reliability of the volumetric measurements was assessed on 5 randomly selected subjects stratified on AP grouping criteria. Segmentations were created 3 times for each subject, and their volumes were measured. The mean coefficient of variation (COV = SD/mean volume), measured by averaging the COV for each of the 5 subjects, was 1.9%. This rather low COV value was most likely due to the semiautomatic nature of the segmentation procedure, since comparable purely manual segmentations normally have larger COVs.12 This COV is more than an order of magnitude smaller than the volumetric variability in the groups, and thus the segmentation can be judged as reliable and unlikely to introduce significant errors.
Fig 4.
The orientation of the bisecting plane for the superior and inferior airway compartments was different between A and B, skeletal Class II, and C and D, skeletal Class III; the latter was more horizontal, and the former was more oblique, reflecting an anatomic difference between these groups.
Statistical analysis
Linear regression models were used to assess the relationship between face morphology and airway volume, controlling for age, sex, size of the face, and interaction between size of face and sex. The variable age was centered at its average. The reference group for the AP pattern was the Class I group, and the middle group of the vertical pattern variable was used as the vertical reference group.
Bivariate relationships between variables were assessed with the Spearman correlation. A partial F test showed that, among all possible interactions of explanatory variables, only that between size of face and sex was potentially related to airway volume. This interaction was included in the regression model along with the covariate and primary main effects.
The shape of the airway was analyzed qualitatively by visual inspection and frequency count. The orientation of the airway passages viewed from the sagittal plane was defined as vertical, average, or forward, based on the inclination of the vertical axis of the airway to the horizontal orientation of the head (SN rotated down 6°). The relative width of the overall airway passage and whether there was an indentation into the airway space that coincided with the dorsum of the tongue were also recorded. The frequencies of the various airway orientations and the indentations into the airway space were compared between groups with the Spearman rank correlations.
RESULTS
The average volume of the pharyngeal airway was 20.3 cm3 (SD, 7.3 cm3), with mean volumes of 8.8 cm3 (SD, 2.9 cm3) for the superior component and 11.5 cm3 (SD, 4.9 cm3) for the inferior component. Preliminary bivariate analysis showed no statistically significant relationship between volume of the airway and age or sex. The average size of the face was statistically significantly larger in the men than in the women (P<0.01). The size of the face was also significantly associated with total, inferior, and superior airway volumes, with Spearman correlation values of 0.399 (P <0.01), 0.368 (P <0.01), and 0.303 (P = 0.02), respectively. Among the covariate variables, size of the face was significantly correlated with sex (Spearman correlation, −0.668, P <0.01).
Data for measured and adjusted volumes are shown in Table II. The adjusted volumes are derived from regression analyses, taking into account age, sex, face size, and interaction between face size and sex. The adjustments in most groups were small, despite the statistical significance of these variables.
Table II.
Unadjusted and adjusted means of volumetric measurements for the each effect of vertical and AP grouping criteria
| Total airway volume | Lower portion airway volume | Upper portion airway volume | ||||||
|---|---|---|---|---|---|---|---|---|
| Unadjusted means (mm3) |
Adjusted means (mm3)* |
Unadjusted means (mm3) |
Adjusted means (mm3)* |
95% CI adjusted means* |
Unadjusted means (mm3) |
Adjusted means (mm3)* |
95% CI adjusted means* |
|
| Vertical groups | ||||||||
| Short | 18641 | 18714 | 10724 | 10784 | 8835–12733 | 7917 | 7930 | 6769–9090 |
| Average | 22485 | 22955 | 12823 | 13228 | 11213–15243 | 9662 | 9727 | 8527–10927 |
| Long | 20025 | 19504 | 11100 | 10654 | 8669–12639 | 8925 | 8850 | 7668–10031 |
| AP groups | ||||||||
| I | 22430 | 22660 | 13008 | 13163 | 11271–15056 | 9422 | 9497 | 8307–10687 |
| II | 18049 | 18170 | 9289 | 9399 | 7540–11259 | 8760 | 8771 | 7602–9940 |
| III | 20712 | 20318 | 12486 | 12187 | 10192–14182 | 8226 | 8131 | 6878–9386 |
Adjusted for age, sex, size of face, and interaction between size of face and sex.
There was a statistically significant difference (P = 0.02) in the volume of the inferior component of the airway between the AP groups, after controlling for the effects of age, sex, size of face, and interaction between size of face and sex (Table III). From the contrast tests, the mean value for the Class II subjects was significantly different from Class I (F = 7.97; P <0.01) and Class III (F = 4.12; P = 0.05), but there was no difference between Class I and Class III (F = 0.50; P = 0.48). There was no significant difference (P = 0.26) in the volume of the superior component of the airway.
Table III.
Analysis of airway volumes with regression models controlling for age, sex, size of face, and interaction between sex and size of face by AP and vertical groups
| Lower portion airway | Upper portion airway | |||
|---|---|---|---|---|
| Source | F value | P > F | F value | P > F |
| Vertical groups | ||||
| Age | 2.96 | 0.09 | 0.26 | 0.62 |
| Sex | 1.52 | 0.22 | 5.1 | 0.01* |
| Size of face | 4.72 | 0.01* | 7.39 | <0.01* |
| Vertical proportion | 2.08 | 0.13 | 2.35 | 0.11 |
| AP groups | ||||
| Age | 2.55 | 0.12 | 0.17 | 0.68 |
| Sex | 2.73 | 0.07 | 5.07 | 0.01* |
| Size of face | 4.57 | 0.02* | 7.16 | <0.01* |
| AP proportion | 4.27 | 0.02* | 1.25 | 0.29 |
Significant at P = 0.05.
There were no significant differences in the inferior, superior, and total airway volumes among the long, normal, and short groups, after controlling for the effects of age, sex, size of face, and interaction between size of face and sex (Table III). There was a statistically significant relationship (P = 0.01) between sex and upper airway volume.
Quantitative analysis of airway shapes is not available yet for intergroup comparison. This type of shape description is an ongoing research project at the University of North Carolina. From visual inspection, the following qualitative observations were noted.
The segmentation contours were highly variable in all 3 AP groups.
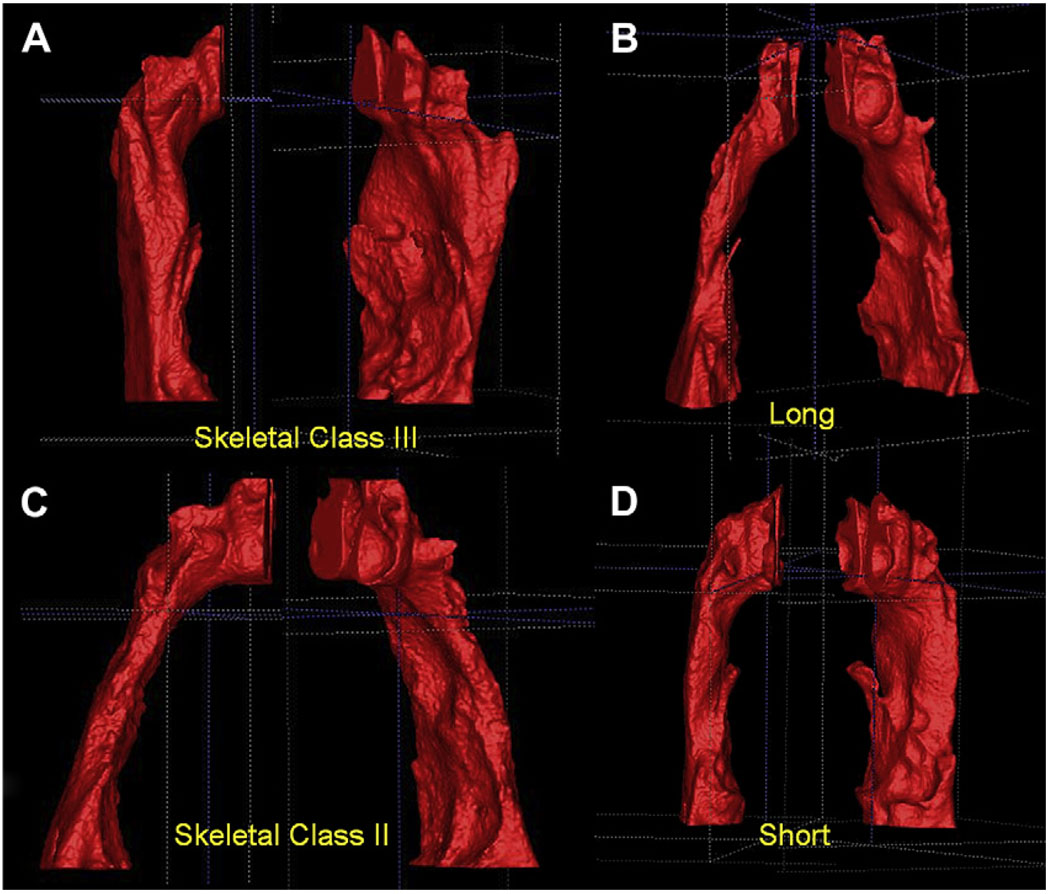
Subjects with a Class III skeletal pattern had a more vertical orientation of the airway in the sagittal plane compared with the other groups, whereas a Class II skeletal pattern was associated with a more forward orientation of the airway (P <0.001) (Fig 5, A and C).
The postero-superior area of the tongue dorsum was visualized at the anterior wall of the airway segmentation as a blunt indentation (Fig 5, B and C). Skeletal Class II patients had a greater frequency of tongue identations (P = 0.045). The apparent projections of the tongue into the airway at various points along the anterior wall of the pharynx show how a 2D view of the tongue-pharynx relationship could be misleading.
The plane used to bisect the segmentations from posterior nasal spine to the lower medial anterior border of the first cervical vertebra had a more horizontal orientation in the skeletal Class III group and was more oblique, down toward the posterior aspect in the skeletal Class II group (Fig 4).
The airway passages of the skeletal Class II group were narrower when viewed from the coronal plane than in the other 2 groups (Fig 5, C), even though the difference was not statistically significant.
Fig 5.
Different airway shapes of skeletal Class II and Class III subjects, depicting a more vertical orientation of the airway in Class III subjects. A and C, This finding was statistically significant, P <0.001. B and D, The differences between subjects in the vertical groups are less apparent, with no statistically differences found.
Variability was greater among the vertical groups, and differences in shape were more difficult to characterize. An extremely narrow airway, both anteroposteriorly and coronally, was observed more often in patients in the long-faced group when compared with patients with normal faces (38% vs 20%). Most long-faced patients also had a skeletal AP malocclusion (48% Class II, 38% Class III), and often a strong tongue indentation was noted at the anterior wall of the airway (Fig 5, B and C).
DISCUSSION
The construction of virtual 3D surface models of the airway by using in-house tools differs from the 3D visualization tools allowed by commercial software that display the 3D data as projections based on thresholding filters. In this study, we used a volumetric characterization of the pharynx. No linear or angular measurements were used. To our knowledge, this is the first report of airway volumes based on this advanced technique.
This study controlled for the following factors.
Airway differences related to growth status. The subjects ranged from 17 to 46 years of age (average, 24.7 years), so they had already undergone their adolescent growth spurt; thus, it is no surprise that airway volume did not correlate with age. To date, there are no 3D longitudinal data on airway changes during growth. From 2D cephalometric data, King,13 Bench,14 and, later, Tourné15 described the growth of the bony nasopharynx as mainly vertical, with a slight AP increase early in life and minimal change after the growth spurt. It is unlikely that growth contributed to the differences that we noted in airway orientation and shape.
Differences in face size. In this study, the size of the face was established as a rectangular prism encompassing the facial bones. Because the lines used to determine the lengths of the edges of the prism were not perpendicular, their projection was transposed into an orthogonal system that created the edges of the prism (Fig 2). Thus, the size of the face was independent of head orientation and face morphology, and, by simple trigonometry, the 2D planes could be projected onto an orthogonal coordinate system. Pharyngeal airway volumes (total, superior, and inferior) were significantly if weakly correlated with face size: r = 0.40 (P <0.01), 0.37 (P <0.01), and 0.30 (P = 0.02), respectively. Subjects with larger faces would be expected to have larger airway volumes. The means and standard deviations for face size in the groups were almost identical.
Male and female composition of the groups. Face size is significantly larger in men than in women, and, because airway volume is correlated to face size, a sex difference would be expected. Martin et al16 reported that 2D nasopharyngeal soft-tissue patterns were different in men and women. In an earlier longitudinal study, Linder-Aronson and Leighton17 also found sexual dimorphism during growth of the posterior wall of the pharynx. Sexual dimorphism between airways was not addressed in our study, but our data confirm that airway volumes are significantly larger in men. Because we controlled for face size, sex, and interaction between sex and face size, the male-female composition of our groups should not have affected the differences by facial morphology groups that we found.
There were other potential influences on airway dimensions and shape. We found a significant difference in the inferior compartment of the airway volume between skeletal Class II and Class I and Class III patients (skeletal Class II inferior compartment airway volume was smaller, P = 0.02), but there were no significant differences in airway volume among the long, normal, and short face-height groups. Airway orientation and shape differed between the Class II and Class III groups, with no difference between the vertical groups. Several factors might have contributed to these outcomes.
With 62 subjects divided into 3 groups for analysis, the sample size in each group was about 20. It is possible that, with larger numbers in each group, other differences would have been statistically significant. Further studies with larger groups are needed. On the other hand, with groups of this size, the differences that were statistically significant are large enough to be clinically significant.
Each subject was in both an AP and a vertical group, with the vertical grouping created by simply dividing the sample into 3 equal groups by face height. There was a weak relationship between the patients’ vertical and AP characteristics. Many patients with longer faces also were classified as skeletal Class II or Class III, whereas those with shorter faces tended to be classified as skeletal Class I. Bias from this source, however, seems more likely to lead to differences in airway volumes between the vertical groups than to conceal differences.
Patient positioning and respiration phase during data acquisition are other possible factors. Cephalometric studies in the laboratory have shown that, with a change in body position from upright to supine, changes in volume and contours occur in the upper airway in patients with obstructive sleep apnea and control subjects.18 For our study, the iCAT scanner was chosen because the patient sits upright during CBCT acquisition. In the other most widely used CBCT scanner, NewTom 3 G (Aperio Services, Sarasota, Fla), patients are scanned in a supine position. In our view, the upright position is closer to the normal position outside sleeping hours and a better starting point for a study of this type. It will be interesting, however, to see whether the differences in airway shape between the 2 positions show different upper and lower airway volumes, and also to determine whether the differences in airway shape that we observed in the Class I, Class II, and Class III subjects, would be seen in supine CBCT scans.
One other aspect of positioning in the iCAT machine that might lead to differences in supine vs upright scans is the influence of the patient’s chin position on head orientation during CBCT acquisition. With the first generation of iCAT CBCT scanners, the radiology technician positioned the subject with a strap around the forehead and a platform for the chin. A more prominent chin could lead to changes in the extension of the head, and a less prominent chin could have the opposite effect. The latest iCAT CBCT machines do not have a chin platform, and the head is stabilized with a strap around the forehead. During NewTom 3 G scan acquisition, patients are supine with their heads on a noncustomized pillow for support. This type of positioning is not reproducible for studies in which head orientation must be controlled.
No attempt was made during CBCT acquisition for our subjects to control for respiratory movements (inspiration, resting, exhalation). Lowe et al19 reported changes in airway dimensions related to the respiration phase. The acquisition times for our iCAT scanner were 20 to 38 seconds; this is too long to ask the patient not to breathe during the scan. Newer scanners have reduced the acquisition time to about 10 seconds, and that allows control of the respiration phase. In this study, volume changes during respiration are part of the systematic error, and future investigations can determine whether there is a correlation between the physiology of respiration and the 3D facial morphology. In our study, no data for body weight and patients’ height were available. It could have been interesting to include these parameters in our regression models, and, in future prospective studies, these data will be collected.
Airway patency is considered to be strongly related to the equilibrium between extraluminal tissue pressure and intraluminal pressure. Transmural pressure is the difference between intraluminal and extraluminal pressures. When transmural pressure is positive, the airway remains patent; it occludes when transmural pressure is negative.20 The continuous positive airway pressure machine preserves the patency of the airway by maintaining greater intraluminal pressure than extraluminal pressure. A second factor influencing airway patency is mucosal tension; when airways are subjected to tension, their collapsibility decreases.21 Future research is needed to assess the relationship between the tension of the external soft tissues to the tension of the internal soft tissues to establish a physiologic connection between these equilibrium mechanisms.
Airflow demands trigger reflex changes in the posture of the head, mandible, and tongue. The AP position of the tongue seen in 2D images is closely related to oropharyngeal depth. Compared with control children, those with enlarged tonsils have an extended posture of the head and an anteroinferior posture of the tongue22 (shown in cephalometric radiographs by the position of the hyoid bone), and patients who underwent mandibular setback have a more inferior position of the hyoid bone.23 An association between extended head posture and facial retrognathism was reported.24 Stratemann25 recently reported that specific sites of upper airway constriction are associated with specific patterns of skeletal adaptations of the craniofacial complex. This was based on CBCT data from patients with nonextreme facial types, and the precise sites and adaptations are still to be characterized.
CONCLUSIONS
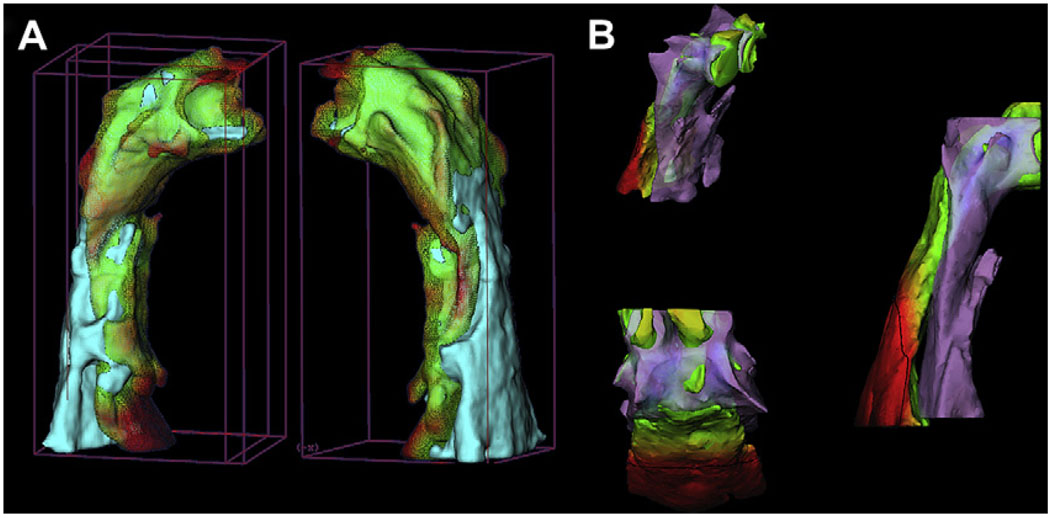
Three-dimensional images of the airway allow improved evaluation of sites of airway obstruction, and further studies are needed to clarify the physiologic response to pharyngeal stenosis. Computer software that allows determination of volumes from surface contours is more accurate for these research studies. In addition, it already is possible to use the cranial base surface to superimpose 3D models for different times in the same patient, so that changes in airway volume and orientation relative to this stable reference can be studied before and after surgery (Fig 6, A).26 New registration methods for growing patients and interpatient comparisons have been used in preliminary studies involving surgical and orthopedic changes. In the future, these could be applied to airway studies (Fig 6, B), and we can expect a much better understanding of adaptive changes in the airway shape and volume. Head posture, mandibular rotation, hyoid position, and patency of the airway are interrelated, and further 3D studies of the airway should clarify the relationships.
Fig 6.
Registration techniques for 3D data adapted for airway study use: A, pre- and postmandibular advancement 3D models of the airway registered on the cranial base (semiautomatic registration); B, interpatient manual airway registration shows a skeletal Class II subject and a skeletal Class I subject.
Acknowledgments
Supported by NIDCR R01 DE005215.
Footnotes
The authors report no commercial, proprietary, or financial interest in the products or companies described in this article.
REFERENCES
- 1.Linder-Aronson S. Adenoids. Their effect on mode of breathing and nasal airflow and their relationship to characteristics of the facial skeleton and the dentition. A biometric rhino-manometric and cephalometro-radiographic study on children with and without adenoids. Acta Otolaryngol Suppl. 1970;265:1–132. [PubMed] [Google Scholar]
- 2.Linder-Aronson S, Woodside DG, Lundstrom A. Mandibular growth direction following adenoidectomy. Am J Orthod. 1986;89:273–284. doi: 10.1016/0002-9416(86)90049-7. [DOI] [PubMed] [Google Scholar]
- 3.McNamara JA. Influence of respiratory pattern on craniofacial growth. Angle Orthod. 1981;51:269–300. doi: 10.1043/0003-3219(1981)051<0269:IORPOC>2.0.CO;2. [DOI] [PubMed] [Google Scholar]
- 4.Zettergren-Wijk L, Forsberg CM, Linder-Aronson S. Changes in dentofacial morphology after adeno-tonsillectomy in young children with obstructive sleep apnoea—a 5-year follow-up study. Eur J Orthod. 2006;28:319–326. doi: 10.1093/ejo/cji119. [DOI] [PubMed] [Google Scholar]
- 5.Guray E, Karaman AI. Effects of adenoidectomy on dentofacial structures: a 6-year longitudinal study. World J Orthod. 2002;3:73–81. [Google Scholar]
- 6.Fields HW, Warren DW, Black K, Phillips CL. Relationship between vertical dentofacial morphology and respiration in adolescents. Am J Orthod Dentofacial Orthop. 1991;99:147–154. doi: 10.1016/0889-5406(91)70117-F. [DOI] [PubMed] [Google Scholar]
- 7.Shelton RL, Jr, Bosma JF. Maintenance of the pharyngeal airway. J Appl Physiol. 1962;17:209–214. doi: 10.1152/jappl.1962.17.2.209. [DOI] [PubMed] [Google Scholar]
- 8.Solow B, Kreiborg S. Soft-tissue stretching: a possible control factor in craniofacial morphogenesis. Scand J Dent Res. 1977;85:505–507. doi: 10.1111/j.1600-0722.1977.tb00587.x. [DOI] [PubMed] [Google Scholar]
- 9.Solow B, Sandham A. Cranio-cervical posture: a factor in the development and function of the dentofacial structures. Eur J Orthod. 2002;24:447–456. doi: 10.1093/ejo/24.5.447. [DOI] [PubMed] [Google Scholar]
- 10.Preston CB. The upper airway and cranial morphology. In: Graber TM, Vanarsdall R, Vig KWL, editors. Orthodontics: principles and techniques. 4th ed. St Louis: C.V. Mosby; 2005. pp. 117–143. [Google Scholar]
- 11.Aboudara CA, Hatcher D, Nielsen IL, Miller A. A three-dimensional evaluation of the upper airway in adolescents. Orthod Craniofac Res. 2003;6 Suppl 1:173–175. doi: 10.1034/j.1600-0544.2003.253.x. [DOI] [PubMed] [Google Scholar]
- 12.Yushkevich PA, Piven J, Hazlett HC, Smith RG, Ho S, Gee JJ, et al. User-guided 3-D active contour segmentation of anatomical structures: significantly improved efficiency and reliability. Neuroimage. 2006;31:1116–1128. doi: 10.1016/j.neuroimage.2006.01.015. [DOI] [PubMed] [Google Scholar]
- 13.King EW. A roentgenographic study of pharyngeal growth. Angle Orthod. 1952;22:23–37. [Google Scholar]
- 14.Bench RW. Growth of the cervical vertebrae as related to tongue, face and denture behavior. Am J Orthod. 1963;49:183–214. [Google Scholar]
- 15.Tourné LP. Growth of the pharynx and its physiologic implications. Am J Orthod Dentofacial Orthop. 1991;99:129–139. doi: 10.1016/0889-5406(91)70115-D. [DOI] [PubMed] [Google Scholar]
- 16.Martin O, Muelas L, Viñas MJ. Nasopharyngeal cephalometric study of ideal occlusions. Am J Orthod Dentofacial Orthop. 2006;130:436.e1–436.e9. doi: 10.1016/j.ajodo.2006.03.022. [DOI] [PubMed] [Google Scholar]
- 17.Linder-Aronson S, Leighton BC. A longitudinal study of the development of the posterior nasopharyngeal wall between 3 and 16 years of age. Eur J Orthod. 1983;5:47–58. doi: 10.1093/ejo/5.1.47. [DOI] [PubMed] [Google Scholar]
- 18.Pae EK, Lowe AA, Sasaki K, Price C, Tsuchiya M, Fleetham JA. A cephalometric and electromyographic study of upper airway structures in the upright and supine positions. Am J Orthod Dentofacial Orthop. 1994;106:52–59. doi: 10.1016/S0889-5406(94)70021-4. [DOI] [PubMed] [Google Scholar]
- 19.Lowe AA, Gionhaku N, Takeuchi K, Fleetham JA. Three-dimensional CT reconstructions of tongue and airway in adult subjects with obstructive sleep apnea. Am J Orthod Dentofacial Orthop. 1986;90:364–374. doi: 10.1016/0889-5406(86)90002-8. [DOI] [PubMed] [Google Scholar]
- 20.Schwartz AR. Extraluminal tissue pressure: what does it mean? J Appl Physiol. 2006;100:5–6. doi: 10.1152/japplphysiol.01239.2005. [DOI] [PubMed] [Google Scholar]
- 21.Rowley JA, Permutt S, Willey S, Smith PL, Schwartz AR. Effect of tracheal and tongue displacement on upper airway airflow dynamics. J Appl Physiol. 1996;80:2171–2178. doi: 10.1152/jappl.1996.80.6.2171. [DOI] [PubMed] [Google Scholar]
- 22.Behlfelt K, Linder-Aronson S, Neander P. Posture of the head, the hyoid bone, and the tongue in children with and without enlarged tonsils. Eur J Orthod. 1990;12:458–467. doi: 10.1093/ejo/12.4.458. [DOI] [PubMed] [Google Scholar]
- 23.Takagi Y, Gamble JW, Proffit WR, Christiansen RL. Postural change of the hyoid bone following osteotomy of the mandible. Oral Surg Oral Med Oral Pathol. 1967;23:688–692. doi: 10.1016/0030-4220(67)90352-0. [DOI] [PubMed] [Google Scholar]
- 24.Tallgren A, Solow B. Hyoid bone position, facial morphology and head posture in adults. Eur J Orthod. 1987;9:1–8. doi: 10.1093/ejo/9.1.1. [DOI] [PubMed] [Google Scholar]
- 25.Stratemann SA. Three-dimensional craniofacial imaging: airway and skeletal morphology [thesis abstract] Am J Orthod Dentofacial Orthop. 2006;130:807. [Google Scholar]
- 26.Cevidanes LH, Styner MA, Proffit WR. Image analysis and superimposition of 3-dimensional cone-beam computed tomography models. Am J Orthod Dentofacial Orthop. 2006;129:611–618. doi: 10.1016/j.ajodo.2005.12.008. [DOI] [PMC free article] [PubMed] [Google Scholar]


