

Abstract
Pathophysiological conditions causing mitochondrial dysfunction and altered transmembrane potential (Δψm) initiate a mitochondrial respiratory stress response, also known as mitochondrial retrograde response, in a variety of mammalian cells. An increase in the cytosolic Ca2+ [Ca2+]c as part of this signaling cascade activates Ca2+ responsive phosphatase, Calcineurin (Cn). Activation of IGF1R accompanied by increased glycolysis, invasiveness, and resistance to apoptosis are phenotypic hallmarks of C2C12 rhabdomyoblast cells subjected to this stress. The signaling is associated with activation and increased nuclear translocation of a number of transcription factors including a novel NFκB (cRel: p50) pathway, NFAT, CREB and C/EBPδ. This culminates in the upregulation of a number of nuclear genes including Cathepsin L, RyR1, Glut4 and Akt1. We observed that stress regulated transcription activation of nuclear genes involves a cooperative interplay between NFκB (cRel:p50), C/EBPδ, CREB, NFAT. Our results show that the functional synergy of these factors requires the stress-activated heterogeneous nuclear ribonucleoprotein, hnRNPA2 as a transcriptional co-activator. We report here that mitochondrial stress leads to induced expression and activation of serine threonine kinase Akt1. Interestingly, we observe that Akt1 phosphorylates hnRNPA2 under mitochondrial stress conditions, which is a crucial step for the recruitment of this coactivator to the stress target promoters and culmination in mitochondrial stress-mediated transcription activation of target genes. We propose that mitochondrial stress plays an important role in tumor progression and emergence of invasive phenotypes.
1.0 Introduction
Mitochondria are important organelles that participate in a myriad of metabolic, biosynthetic and bioenergetic functions. In addition to generating ATP, mitochondria play important role in the integration of metabolism, regulation of calcium signaling and execution of cell death [1]. In the cellular context, mitochondria are highly susceptible to injury from hypoxia, environmental chemicals, and pharmacological agents. Additionally, mitochondria are not only a major site of ROS production, but are also highly vulnerable to ROS mediated membrane damage [2]. All these agents potentially induce mutations in mitochondrial DNA (mtDNA), and/or, loss of mtDNA, resulting in the disruption of mitochondrial function and membrane potential (Δψm) [3–5]. Mitochondrial dysfunction triggers a signaling pathway which culminates in a large scale reprogramming of nuclear gene expression pattern [6–8]. In yeast and also in mammalian cells the “retrograde response” or “mitochondrial respiratory stress” is one mechanism by which cells respond to altered mitochondrial function. The signaling mechanism involved in retrograde response has been studied in a wide spectrum of cells ranging from yeast to mammalian cells. While the yeast response occurs mainly by the activation of the RTG pathway, mammalian cell response involves more complex signaling [3, 9–14].
Mitochondrial dysfunction due to partial or complete depletion of mitochondrial DNA (mtDNA) triggers a specific mitochondrial stress signaling in C2C12 skeletal myoblasts, A549 lung carcinoma cells, and others [3,5,14,15,17]. This is characterized by elevated cytosolic calcium ([Ca+2]c) leading to activation of calcineurin-dependent NF-κB pathway. The mitochondrial stress-induced NF-κB pathway differs from the established canonical and non-canonical pathways and involves the release of p50:cRel heterodimer from IκBβ in the cytosol through calcineurin-mediated dephosphorylation of IκBβ [6,16]. In 143B osteosarcoma cells, mitochondrial stress resulting from mtDNA depletion or protein misfolding caused activation of CREB, and a C/EBP family factor CHOPS, respectively [17,18]. These same transcription factors have been implicated in the regulation of a number of nuclear marker genes that respond to mitochondrial respiratory stress signaling in different cells. Currently there is increasing evidence that mtDNA content directly reflects on the metabolic state of cells [19–22].
Rapidly growing tumors meet their metabolic demand by increased expression of genes encoding glucose transporters and glycolytic enzymes [23]. A number of recent studies show that proliferating tumors in both human patients and animal models contain mutated or deleted mtDNA and/or dysfunctional mitochondria [13,24,25]. In C2C12 and A549 cells, mtDNA depletion induced cell proliferation and resistance to apoptosis [3,9–11,15,26]. We have previously shown that selective inhibition of IR autophosphorylation and Cn-dependent activation of the IGF1R pathway is the basis for increased glucose utilization and cell proliferation in C2C12 rhabdomyoblasts subjected to mitochondrial respiratory stress by mtDNA depletion [26].
Similar to yeast, the transcriptional targets of the retrograde pathway in mammalian cells are diverse and include proteins that regulate Ca2+ storage and release, glucose uptake and metabolism, mitochondrial energy transduction, cell survival, and cytoskeletal organization [3,9,17,26–28]. Although several potential target genes of the mammalian mitochondrial stress pathway have been identified in different cells [6, 7], the full genetic footprint of mitochondrial stress has not been characterized. Characterization of the genes regulated by the retrograde pathway is central to understanding the putative role of mitochondrial stress in cellular resistance to apoptosis, aging, cancer progression, and neural and bone degenerative diseases.
We show that the regulation of mitochondrial respiratory stress-responsive nuclear genes requires physical interactions and functional synergy between the transcriptional activators NFκB (cRel: p50), C/EBPδ, CREB, and NFAT that are activated under mitochondrial stress conditions. In addition, we have found that the functional synergy of these factors in the mitochondrial stress pathway requires coactivation of heterogeneous nuclear ribonucleoprotein (hnRNP) A2 [14]. Furthermore, we show that the oncogenic kinase Akt1 is activated in the nucleus under mitochondrial stress and phosphorylation of hnRNPA2 by Akt1 is essential for the recruitment of hnRNPA2 to the enhanceosome complexes of stress target promoters.
2.0 Materials and Methods
2.1 Plasmid constructs and cloning
The mouse Cathepsin L gene promoter DNA (sequence –273 to +47) [9] and the mouse RyR1 promoter (sequence −205 to +63) (Accession# FJ480190) were amplified from mouse genomic DNA [9] and cloned into the pGL3 mammalian expression vector (Promega, Madison WI). The human Glut 4 promoter (sequence −1209 to −168) [29] was subcloned in the pGL3 vector. The cRel, C/EBPδ, NFAT and CREB genes were cloned into the pCMV4 expression vector. HnRNP A2 cDNA was subcloned from pET28a (+) vector [14] into pCI for transfections of C2C12 cells.
2.2 Cell lines and transient transfections
Murine C2C12 skeletal myoblasts (CRL1772, ATCC, Manassas, VA) were grown in Dulbecco’s Modified Eagle’s medium (Invitrogen, Carlsbad, CA) supplemented with 10% fetal bovine serum and 0.1% gentamycin. MtDNA depleted clones containing ~80% reduced mtDNA contents were generated by Ethidium bromide treatment (100 ng/ml) as previously described [3] and grown in the presence of 1 mM sodium pyruvate and 50 μg/ml uridine. Frozen aliquots of cells derived from the same mtDNA depleted clone was used in all experiments reported in this study to ensure uniform level of mtDNA depletion. Reverted cells represent mtDNA-depleted cells (with 80% DNA depletion) grown for 30 cycles in the absence of ethidium bromide until the mtDNA content reached 20% of the control cell level. In some experiments an alternate method of mitochondrial stress induction by treatment with mitochondria specific uncoupler, CCCP (25μM) was used. In these experiments CCCP treatment was carried out for up to 5h as specified. Transfections were carried out using Fugene 6 reagent (Roche Applied Science, Indianapolis, IN) following the manufacturer’s suggested protocol. Promoter DNA constructs cloned in pGL3 vector (1 μg) and 0.5 μg of a renilla luciferase construct (Promega) was used as an internal control. The luciferase activity was assayed using the Dual-Luciferase reporter assay system from Promega. Cotransfections with various cDNAs were carried out in 6-well plates using 0.2 μg of cDNA constructs.
2.3 mRNA knockdown by siRNA expression
Predesigned siRNAs for mouse CnAα (ID #292199), IGF1R (ID #159115), and IR (ID #67808), Akt1 (ID#162426) and negative controls (scrambled siRNA) were purchased from Ambion Inc. (Austin, TX). Control and mtDNA-depleted cells (104 cells/well) were transfected with pre-annealed double-stranded siRNAs at a final concentration of 30 nM by the method of reverse transfection. Transient transfections were carried out in triplicate using siPORT NeoFX reagent (Ambion Inc). RNA was isolated 48 h after transfections using TRIzol reagent (Invitrogen), and the level of silencing of CnAα, IGF1R, and IR mRNA was quantified by real-time PCR.
2.4 Generation of stable hnRNPA2 silenced cell lines
Knock down of hnRNPA2 mRNA by stable expression of siRNA in C2C12 cells was described before [14]. Stable cell lines were generated after transfection (Fugene 6, Roche) of mtDNA-depleted C2C12 cells with hnRNPA2si3-pSilencer2.1neo (or pSilencer2.1neo vector alone) containing a neomycin resistance gene. Stably transduced cells were selected using G418 (1mg/ml) as a selection marker.
2.5 Knock Down of IκBβ and IκBα mRNAs by Retrovirus
Two siRNA sequences targeting mouse IκBβ (5′-GACTGGAGGCTACAACTAG-3′ and 5′-CAGAGATGAGGGCGATGAA-3′) were designed and cloned into pSilencer 1.0-U6 vector (Ambion). Empty pSilencer 1.0-U6 vector was used as control. Control and siRNA vector were co-transfected with neomycin-resistant pcDNA3 vector (Invitrogen) into control and depleted cells. G418 (1 mg/ml) was added to the medium for selection. Two siRNA sequences against mouse IκBα (5′-AGGCCAGCGTCTGACATTA3-′ and 5′-GGCCAGCGTCTGACATTAT-3′) were cloned in pSUPER puro vector (OligoEngine). 293T cells were transduced with the retroviral clones and the vector alone. The medium used for transducing control and mtDNA-depleted cells with the viral constructs contained 6 μg/ml polybrene. Positive clones were selected in the presence of 10 μg/ml of puromycine for control cells and 100 μg/ml puromycine for depleted cells because the latter cells were resistant to lower dose of the antibiotic. After 3 weeks, well separated individual colonies were picked and grown. The protein levels of IκBβ and IκBα were measured by Western blot using antibodies against respective proteins (Santa Cruz Biotechnology). Cells with <50% reduced IκBβ or IκBα levels compared with their respective controls were used for further characterization [6].
2.6 Uptake of 2-Deoxyglucose
Glucose uptake was measured as described previously [26, 30]. Briefly, 106 cells grown in 6-well plates were serum-starved for 6h, and incubated in the presence or absence of indicated levels of insulin for 30 min in glucose-free medium. One microcurie of 2-[3H]deoxyglucose (1 mCi/0.1 mmol; American Radiolabeled Chemicals, St. Louis, MO) was added to each well containing 2 ml of medium for an additional 15 min. The transport was terminated by washing cells rapidly three times with ice-cold PBS and lysed in 1N NaOH. Aliquots of the lysates were counted in liquid scintillation counter (Beckman Instruments, Fullerton, CA).
2.7 Growth Pattern and In Vitro Invasion Assays
Growth patterns were measured by seeding cells at a densityof 1 × 10⁴ cells/well in 24-well culture plates. Cells fromthree wells at each time point were harvested and counted using Viacount reagent (Guava technologies) ina personal cytometer according to the manufacturer’s protocols(Guava Technologies, Hayward, CA). The in vitro invasion assayswere carried out in Matrigel invasion chambers (BD BiosciencesDiscovery Labware, Bedford, MA) as described previously (14). Cells (1 × 10⁴) were seeded on top of the Matrigellayer. After incubation for 24 h at 37°C, noninvading cellsin the Matrigel layer were removed, and the microporous membranescontaining invaded cells were stained and viewed with a BX 61fluorescence microscope (Olympus America, Center Valley, PA)as described previously (9). At least sixfields were examined for each condition per experiment.
2.8 Calcineurin Activity Assay
Calcineurin activity was assayed according to Antoni et al. with the following modifications [31] Total serine/threonine phosphatase activity was first determined by incubating cell lysate (2 μg) from untreated, AICAR (2 mM, 2 h), and FK506 (10 nM, 30 min) treated cells with threonine phosphopeptide (Upstate, Cat. no. 12–219) in a final volume of 25 μl for 20 min at 30 °C in 50 μM Tris-Cl, pH 7.0, 0.1 mM CaCl2. The phosphate released was quantitated by incubating with 100 μl of malachite green and measuring the absorbance at 660 nm after 15 min. In parallel, control incubations containing phosphatase inhibitor mix I (NaF, 5 mM; okadaic acid, 500 nM; orthovanadate, 100 μM; FK506, 1 nM; calyculin, 0.1 μM; and cyclosporine A, 100 μM) and phosphatase inhibitor mix II (FK506, 1 nM; calyculin, 0.1 μM; and cyclosporine A, 100 μM) were also carried out. Nonspecific phosphatase activity under these conditions was subtracted from total serine/threonine phosphatase activity referred to as corrected activity. Calcineurin activity was calculated by subtracting the activity in the presence of added phosphatase inhibitor mix II from the corrected activity (obtained after subtracting the non-specific activity).
2.9 Annexin V Assay
The assay for cells undergoing apoptosis was performed using a Nexin Kit (Guava Technologies, Hayward, CA) according to the manufacturer’s suggested protocol. Cells (106 each) treated without or with inhibitors (Genistein, 0.1 mg/ml; AG1024, 10 μM; and PPP, 2.5 μM) for 2 h were washed with 1 ml of 1× Nexin Buffer (Guava Technologies) and resuspended in the same buffer. After labeling with Annexin V-PE, the percentage of apoptotic cells was quantified using a Personal Cytometer (Guava Technologies). In case of siRNA experiments, cells were harvested 48 h after the siRNA transfections and counted as described above.
2.10 Microarray Analysis
Total RNA from control, mtDNA-depleted, IκBβ knock down (KD)/Control, and IκBβ KD/Depleted C2C12 cells was isolated using TRIzol according to the manufacturer’s instructions. RNA was analyzed on MOE430A chips (Affymetrix). Statistical significance established with Partek (two-way analysis of variance significant to <0.0005). Gene selection was performed using the Spotfire program as described before [6]. The total number of spots matching criteria was 43, representing 25 Gene Ontology header-mapped genes with known functions.
2.11 Enhanceosome Pull-Down
Nuclear extracts were prepared by the method of Dignam et al [32]. RNA bound to the proteins was removed by RNAse treatment. PCR amplified DNA corresponding to sequence −273 to −53 of the mouse Cathepsin L promoter was coupled to cyanogen bromide-activatedSepharose 4B as described previously [32]. Approximately 1 mg of protein was loaded per DNA-Sepharose columnas described previously [33], and bound proteins were eluted with 0.2–0.4 M KCl buffer containing 25 mM HEPES, pH 7.8, 12.5 mM MgCl2, 1 mM dithiothreitol, 20%(vol/vol) glycerol, and 0.1% (vol/vol) Nonidet P-40. Eluates(200 μl each) were concentrated to 20 μl and runon a 12% SDS- PAGE gel andsilver stained using a Silver Stain Plus kit (Bio-Rad Laboratories, Hercules, CA). The immunoblots were developed using SuperSignalWest Femto maximum sensitivity substrate from Pierce Chemical(Rockford, IL).
2.12 Immunoprecipitation
Equal amounts of input hnRNPA2 levels were ascertained using 100μg of protein from mtDNA-depleted cells and 500 μgof protein from control cells for immunoprecipitation. The nuclearand cytosolic fractions were immunoprecipitated overnight at4°C, with the respective antibodies (2 μg/ml) as mentioned in the figurelegends. The immune complexes were collectedonto protein A-agarose beads and washed extensively (Sigma-Aldrich, St. Louis, MO). The immunoprecipitates were extracted from thebeads with 2 × Laemmli’s buffer devoid of β-mercaptoethanolat 95°C for 5 min and used for further analysis.
2.13 ChIP Analysis
ChIP assays were performed following the protocol of Millipore(Billerica, MA). Briefly, protein DNA complexes in vivo were fixed by adding 1% formaldehyde to the culture medium and incubated at 37°C for 10 min. The cell pellet was suspended in SDS lysis buffer [1% SDS, 10mM EDTA, and 50 mM Tris, pH 8.1], and the cell lysates were sonicated using an ultrasonic processorsonicator (10-s pulses; 20 times, on ice). Diluted aliquotswere immunoprecipitated with respective antibodies overnight at 4°C. Preimmune IgG was used as a negative control, and equal volumes of sampleswere used as input DNA. The antibody–chromatin complexwas immunoprecipitated by protein G-agarose/salmon sperm DNA(50% slurry) (Sigma-Aldrich). The DNA recovered after the reversalof cross-linking were amplified by real-time PCR using promoter specific primers. Data wereanalyzed by normalizing with the corresponding input values.
2.14 Electrophoretic Mobility Shift Assays
DNA-protein binding was assayed using 0.1 pmol (30,000 cpm) of 32P-end-labeled double-stranded Cathepsin L promoter DNA (220bp, sequence −273 to −53). The following double-stranded DNA sequences from Cathepsin L promoter were used as competitors: C/EBPδ binding site, WT: GCCAATGAC and Mut: GACTACGAC; NFκB binding site, WT: GGTGGAAATTC and Mut: GATGCGAATCC. Binding reactions (20μl final volume) were run at room temperature for 20 min using 15μg of nuclear extracts and/or indicated amounts of purified hnRNPA2 and 1μg of poly (dI–dC). The DNA bound complexes were resolved by electrophoresis on 3.8% polyacrylamide gels using 0. 5 × TBE running buffer. Competing DNAs (20–30 pmol) were added to the reaction mixture before adding the probe DNA.
2.15 Akt Activity
The Akt activity was measured using Akt/PKB kinase activity assay kit (Stressgen Bioreagents, Victoria, BC, Canada). This assay is based on ELISA which utilizes a synthetic peptide as PKB substrate and a polyclonal antibody that recognizes the phosphorylated form of the substrate.
2.16 In vitro kinase assay
The in vitro kinase assay was done according to the methods of Summers et al. [34]. Recombinant Akt (Millipore) 0.5 μg was incubated with purified 6x his- hnRNPA2 (1.0μg) at 37°C for 30 min. The level of protein phosphorylation was assessed by SDS gel electrophoresis followed by fluorography.
3.0 Results
3.1 Mitochondrial respiratory stress activates calcineurin and calcium responsive factors
Mitochondria regulate the pattern of Ca2+ transients following Ca2+ influx and release of Ca2+ from intracellular stores [35–37]. In recent studies we showed that mitochondrial stress conditions, which disrupt Δψm, cause a steady and sustained increase in cytoplasmic free Ca2+ ([Ca2+]c) [3,9]. The levels of Ca2+ responsive cytoplasmic and nuclear factors, as well as the steady state levels of proteins implicated in cell invasion and apoptosis in mtDNA-depleted and reverted cells were studied. Matrix protease cathepsin L is an important marker for invasive tumors [38]. Similarly, TGFβ has been shown to be important in inducing the invasive behavior in several tumor cells [9]. Immunoblot analysis of post-nuclear protein fraction showed that the levels of both cathepsin L and TGFβ are three to six times higher in mtDNA-depleted cells (Figure 1) [9]. Ca2+ and calmodulin responsive factor calcineurin was increased three to five fold in mtDNA-depleted cells, but the level was reversed to near control levels in reverted cells. Increased Cn level in mtDNA depleted cells is closely linked to mitochondrial respiratory stress in these cells since restoration of mtDNA content also reverted the Cn activity to near control cell level. The levels of Ca2+ storage proteins calreticulin and calsequestrin were also two to four fold higher in mtDNA-depleted cells. The level of Na+/K+ ATPase, types of cells (Figure 1A).
Figure 1.

Activation of mitochondrial stress factors in mtDNA-depleted C2C12 cells. A. Immunoblot analysis of post nuclear fractions of control, mtDNA-depleted and reverted C2C12 cells. 30 μg protein in each was subjected to immunoblot analysis as described in the Methods section. Blots were quantified using a BioRad imager. B. Calcineurin activity in post nuclear fraction was assayed using a kit from Upstate Biologicals as described in the Methods section. FK506 was added at 10 nM level. Results represent Average ±SEM of three separate assays.
Calcineurin is a cytoplasmic, Ca2+-dependent, protein phosphatase, which is implicated in Ca2+-mediated inflammatory response, apoptosis and cardiac hypertrophy [39–41]. The catalytic subunit CnA dephosphorylates and activates target proteins belonging to NFAT family of transcription factors, such as NFATc [41]. Figure 1A shows that the steady-state levels of the catalytic subunit CnA in the post-mitochondrial fraction of mtDNA-depleted is induced -10-fold, and returned to near normal levels (~2-fold of normal) in reverted cells. In contrast, the level of Na+/K+ ATPase protein used as an internal control remained nearly the same in all samples. Figure 1B shows the activity of Calcineurin was about 2.5 fold higher in mtDNA-depleted cells. This activity was abolished in mtDNA depleted cells by treatment with FK506 treatment. Notably, the general phosphatase activity in mtDNA- depleted cells appears to be lower than in control cells as seen by the extent of inhibition by FK506. The reason for this change remains unclear.
3.2 Mitochondrial respiratory stress-induced glucose uptake and resistance to apoptosis through IGF1R activation
A number of studies have shown that inhibition of mitochondrial respiratory chain-linked oxidative metabolism causes a metabolic shift to increased glycolysis possibly as a compensatory mechanism. Consistent with this, mtDNA-depleted cells showed >2-fold higher basal glucose uptake compared with control cells (Figure 2A). Mitochondrial stress by treatment with mitochondrial ionophore CCCP, which disrupts Δψ m also resulted in a ~2.5-fold higher glucose uptake. However, glucose uptake in reverted cells is reduced to near control cell levels suggesting a link between mitochondrial dysfunction and metabolic shift. FK506, an inhibitor of Cn, inhibited glucose uptake by control and reverted cells only marginally (15 and 20%, respectively), but to a markedly higher extent of 70% in mtDNA-depleted cells suggesting that the increased 2-DOG uptake in mtDNA depleted cells is mediated by calcineurin.
Figure 2.

Increased glucose uptake and activation of IGF1R pathway in mtDNA-depleted C2C12 cells. A. 2-deoxyglucose uptake was measured in control, mtDNA-depleted and reverted cells as described in the Methods section. In some cases mitochondrial respiratory stress was induced by adding 25 μM CCCP to control cells as indicated. FK506 was added at 10 nM concentration. B. Effects of CnAα mRNA knock down on Glut4 mRNA level. Realtime PCR analysis of Glut4 mRNA was carried out with total RNA from control and mtDNA-depleted cells with or without expressing siRNA for CnAα mRNA. C. Effects of CnAα mRNA knock down on IGF1R mRNA level. Realtime PCR analysis of IGF1R mRNA from control and mtDNA-depleted cells expressing siRNA for CnAα mRNA or “scrambled” siRNA. D. IGF1R levels under mitochondrial stress. Immunoblot analysis of post-nuclear fractions of control, depleted and reverted C2C12 cells (top panel), A549 (control and mtDNA-depleted), 3T3 and H9C2 cells treated with 25 μM CCCP to induce stress. FK506 was added at 10nM concentration. E. Effects of 1GF1R and IR mRNA knock down on apoptotic cell death was measured using the Nexin assay kit as described in the Methods section. Results (% cell death) show average ±SEM of three separate estimates.
In keeping with the results of glucose uptake, mtDNA-depleted cells show a 3- to 4-fold higher mRNA level of the glucose transporter GLUT4 (Figure 2B). IR and IGF1R both activate GLUT4 and glucose uptake in C2C12 cells. By treatment with specific inhibitors and siRNA, we determined that IGF1R, and not IR, was preferentially activated under mitochondrial stress [26]. Although not shown, autophosphorylation of IR was markedly lower in mtDNA depleted cells compared to control cells. Figure 2C shows that IGF1R mRNA is 10 folds higher in mtDNA-depleted cells. Moreover, silencing Cn mRNA by siRNA in mtDNA-depleted cells markedly reduces the expression of both Glut4 and IGF1R indicating the regulation of both these factors upstream by Calcineurin (Figure 2B and C).
Figure 2D (top panel) shows a nearly 7 fold higher activation/phosphorylation of IGF1R in mtDNA-depleted C2C12 cells and this increase is reversed by Cn inhibitor FK506. FK506 treatment fails to exert such an effect on receptor phosphorylation in control and reverted cells. We also observed that activation of IGF1R is a common phenomenon in different cell types subjected to mitochondrial stress. Figure 2D lower panels show that in A549, 3T3 and H9C2 cells, metabolic stress induced by CCCP treatment results in increased IGF1R levels. Although not shown IGF1 levels are also increased in mtDNA-depleted cells suggesting an autocrine regulation of glucose uptake.
MtDNA-depleted cells are resistant to apoptosis. In Figure 2E, we measured cellular apoptosis using the Nexin assay which uses annexin V-PE to detect phosphatidylserine on the plasma membrane as an indicator of apoptotic cells. The Nexin assay in figure 2E showed only marginal increase in apoptosis by IR mRNA silencing, whereas IGF1R mRNA silencing caused a vastly increased (~50%) apoptosis which strongly suggests that IGF1R activation is important for cell survival under mitochondrial stress.
3.3 Transcriptional upregulation of nuclear genes under mitochondrial stress
We analyzed the minimal promoter regions of mitochondrial stress responsive target genes Cathepsin L (marker for tumor invasion), RyR1 (maintains calcium homeostasis), and Glut4 (glucose transport) for common binding sites of stress activated transcription factors, NFκB, NFAT, CREB and C/EBPδ. Nucleotide sequence analysis using MatInspector indicated that RyR1 and Glut4 promoters also contained consensus sites for binding to NFκB (cRel), C/EBP, and CREB within their stress response regions (Figure 3A). The RyR1 and Cathepsin L promoters also contained NFAT consensus sites (Figure 3A). The minimal promoter regions of the three stress target genes containing sites with full or partial consensus for binding to NFκB, C/EBPδ, CREB, and NFAT factors was used to transfect control and mtDNA-depleted cells (Figure 3B). All the three genes Cathepsin L, RyR1 and Glut4 showed between 2– 4 fold higher luciferase activity in mtDNA-depleted cells over control. In reverted cells, the promoter activity was markedly reduced to near control cell level indicating that the increase in promoter activity in mtDNA-depleted cells was due to mitochondrial stress.
Figure 3.

Analysis of minimal promoters of stress target genes and characterization of protein factors involved in transcription regulation. A. Maps of minimal promoters of mouse Cathepsin L, RyR1, human Glut4 promoter and locations of sites for binding to the signature factors. B. Transcriptional activity of the minimal promoter regions of stress response genes in control, mtDNA-depleted and reverted cells. C. Effects of IκBα and IκBβ mRNA depletion on the levels of mRNAs for Glut4, IGF1R and RyR1 genes in mtDNA-depleted cells. D. Characterization of protein factors binding to the minimal promoter DNA of Cathepsin L promoter. Immunoblot of fractions eluted at different salt concentrations were developed using factor specific antibodies as described in the Methods section. E. Top panel: Immunoblot analysis of hnRNPA2 levels in nuclear and cytosolic fractions of control, mtDNA-depleted and reverted cells using hnRNPA2 specific anatibody. Actin was used as loading control for cytosolic protein and p97 was used for nuclear protein. Bottom panel: Real Time PCR analysis of hnRNPA2 mRNA levels in control, mtDNA-depleted and reverted C2C12 cells.
We reported that mitochondrial stress activates a novel IκB β mediated NFκB pathway [6, 16]. Figure 3C shows the contribution of IkBα and β on the relative levels of mRNAs for Glut4, IGF1R and RyR1 that are the known targets of stress signaling. IκBβ silencing resulted in marked reduction of Glut4, RyR1 and IGF1R mRNAs in mtDNA-depleted cells. IκBα a silencing has no effect on Glut4 and RyR1 mRNA levels, though IGF1R mRNA levels were clearly affected. These results suggest that IGF1R expression is regulated by both classical NFκB pathway and mitochondrial stress mediated calcineurin requiring pathway. As shown in Table 1 nearly 40 additional genes fit the criteria of genes induced by mitochondrial stress specific NFκB pathway since the steady state levels of these genes in mtDNA-depleted cells is reduced by IκBβ silencing but not by IκBα silencing. These genes upregulated in mtDNA-depleted cells but down regulated by IκBβ silencing include genes involved in cellular metabolism, signal transduction, cellular redox function, ion transport, mitochondrial genetics, cell adhesion, cell cycle and tumorigenesis (Table 1).
TABLE 1.
Genes regulated by IκBβ during mitochondrial respiratory stress signaling.
| Gene title | Gene symbol | -Fold change (depl. vs. cont.) | -Fold change (depl. vs. depl. IκBβ KD) |
|---|---|---|---|
| Tumor marker proteins | |||
| Melanoma cell adhesion molecule | Mcam | 26.1938 | −2.12697 |
| Melanoma antigen | Mela | 14.4641 | 1.01304 |
| Tumor progression proteins | |||
| Breast cancer anti-estrogen resistance 1 | Bcar1 | 2.47854 | 1.12202 |
| Transforming growth factor, β2 | Tgfb2 | 2.2924 | −1.50422 |
| Metabolism regulatory proteins | |||
| Carbonic anhydrase 8 | Car8 | 22.0069 | 1.15188 |
| Insulin-like growth factor 2, binding protein 1 | Igf2bp1 | 10.4676 | −1.40136 |
| Pyruvate dehydrogenase kinase, isoenzyme 1 | Pdk1 | 4.12998 | − 1.52081 |
| Pyruvate carboxylase | Pcx | 3.2003 | 1.04495 |
| Phosphofructokinase, platelet | Pfkp | 3.1962 | −1.65984 |
| Pyruvate dehydrogenase kinase, isoenzyme 3 | Pdk3 | 2.50058 | −1.45416 |
| Cytoskeletal proteins | |||
| Procollagen, type IV, α1 | Col4a1 | 6.88394 | −1.07038 |
| Procollagen, type IV, α2 | Col4a2 | 6.23115 | 1.0008 |
| Connective tissue growth factor | Ctgf | 5.01523 | −1.53219 |
| Cell/mitochondrial function/signaling proteins | |||
| Cytochrome c oxidase, subunit VIIa 1 | Cox7a1 | 5.82145 | −1.89848 |
| Nitric-oxide synthase 1, neuronal (Nos1), mRNA | Nos1 | 8.47653 | −1.24509 |
| Synuclein, α | Snca | 9.44693 | −2.23639 |
| Ubiquitin-activating enzyme E1-like | Ube1l | 7.93742 | −1.3696 |
| Mitogen-activated protein kinase kinase kinase 1 | Map3k1 | 4.30808 | −1.76614 |
| Glycogen synthase 1, muscle/glycogen synthase 3, brain | Gys1///Gys3 | 3.21247 | −1.39839 |
| Superoxide dismutase 2, mitochondrial | Sod2 | 2.47852 | −1.19618 |
| Translocase of inner mitochondrial membrane 9 homolog (yeast) | Timm9 | 2.37736 | −1.51778 |
| Phosphatidylinositol 3-kinase, C2 domain-containing, α polypeptide | Pik3c2a | 2.3394 | −1.56545 |
| Calcium regulation proteins | |||
| Inositol 1,3,4-triphosphate 5/6 kinase | Itpk1 | 3.88386 | −1.25792 |
| Calcium channel, voltage-dependent, P/Q type, α 1A subunit | Cacna1a | 2.73045 | −2.07777 |
| FK506-binding protein 5 | Fkbp5 | 1.89555 | −1.40141 |
Depl., depleted; Cont., control.
We used the enhanceosome pull-down approach [33] to determine the nuclear proteins that bind to the minimal stress response regions of Cathepsin L promoter. Approximately 1 mg of nuclear protein was loaded on each column, and the proteins from mtDNA-depleted and control C2C12 cells were eluted with buffer containing progressively higher salt (0.2–0.4 M KCl), and proteins were resolved by SDS-PAGE. Figure 3D shows the immunoblot of cathepsin L promoter DNA bound proteins from the nuclear extracts of mtDNA-depleted cells. Although not shown, nano LC-MS/MS analysis of promoter DNA bound proteins identified C/EBPδ, (cRel, p50), NFAT and hnRNPA2 as the prominent proteins associated with the enhanceosome. As seen from Figure 3D, these same proteins were indentified by Western blot analysis. It is seen that most of the bound proteins were eluted by buffers containing 0.2 and 0.3M NaCl. Immunoblot shows that although cRel is more preferentially eluted at 0.2M NaCl, its putative partner p50 is eluted more preferentially at 0.3M NaCl. The reason for this differential salt requirement of these two proteins remains unclear. Results also show very low level of p65 binding but robust levels of cRel and p50 binding suggesting selectivity of NFκB factors for promoter DNA binding.
HnRNPA2 is involved in mRNA processing, RNA transport and RNA metabolism. Immunoblot in Figure 3E shows that in control, mtDNA-depleted, and reverted C2C12 cells, the levels of hnRNPA2 is significantly higher in the nucleus than in the cytoplasmic compartment. Additionally, the protein level was almost 5 fold higher in the nuclear fraction of mtDNA-depleted cells compared to control cells. Reverted cells showed a near control cell level of hnRNPA2 protein (~1.5 fold higher than in control cells). Consistent with the protein levels, hnRNPA2 mRNA levels were also increased in mtDNA-depleted cells by nearly 5 fold and were brought down to near control cell level in reverted cells (Figure 3E). These results together show that increased hnRNPA2 expression in mtDNA-depleted cells is indeed in response to mitochondrial stress due to mtDNA depletion.
3.4 HnRNPA2 as a coactivator of mitochondrial stress responsive nuclear target genes
Coimmunoprecipitation experiments have shown that hnRNPA2 physically associates with other stress activated transcription factors, namely, C/EBPδ, NFκB (cRel:p50), NFAT, and CREB in the nuclear fraction of mtDNA-depleted cells. To understand the functional relevance of this, we measured cathepsin L promoter activity in control and mtDNA-depleted cells cotransfected with cDNAs for individual DNA binding factors (cRel, C/EBP δ, CREB) in combination with hnRNPA2 (Figure 4A). Luciferase activity driven by the Cathepsin L promoter was 1.8, 2.5, 1.5, and 1.7 fold higher over basal levels after cRel, C/EBP, CREB, and hnRNPA2 transfections, respectively (Figure 4A). Transfection of control cells also modestly increased luciferase activity. Cotransfections of hnRNPA2 cDNA with either cRel or C/EBPδ enhanced luciferase activity by several fold, suggesting a possible cooperativity between hnRNPA2 and the two DNA binding factors (Figure 4A).
Figure 4.

HnRNPA2 binds to the enhanceosome by protein-protein interaction and functions as a transcription coactivator. A. Transcriptional activity of Cathepsin L promoter in control and mtDNA-depleted, and mtDNA-depleted/hnRNPA2 knockdown cells. The promoter construct was co-transfected with indicated cDNAs as described in the Methods section. B. ChIP analysis of the Cathepsin L promoter with hnRNPA2, hnRNPD-L, C/EBPδ, cRel, and CREB antibodies in the indicated cells. C. ChIP analysis of Cathepsin L promoter in control, mtDNA-depleted and reverted cells using hnRNPA2 antibody. In both B and C, preimmune serum was used as a negative antibody control. Real-time PCR analysis using 10% input DNA for normalization. Values are expressed as folds relative to the factor binding in control cells. D. Gel mobility shift analysis using the Cathepsin L minimal promoter DNA and either purified recombinant hnRNPA2 or nuclear extracts from control, mtDNA-depleted and mtDNA-depleted/hnRNPA2 knock down cells (15 μg protein from nuclear extract and 1.0 to 2.5 μg purified hnRNPA2 protein). Unlabeled WT and mutant DNAs (20 fold molar excess) were used for competition.
To ascertain the in vivo association of stress-activated transcription factors and hnRNP A2 at the target promoters, we performed ChIP assays in control, mtDNA-depleted and mtDNA-depleted/hnRNPA2-silenced cells. ChIP analysis in Figure 4B shows an increased association of cRel, C/EBPδ, CREB, and hnRNPA2 with the Cathepsin L promoter in mtDNA-depleted cells. In contrast, hnRNPA2 silencing in mtDNA-depleted cells resulted in marked and uniform reduction in factor binding to the Cathepsin L promoter (Figure 4B). ChIP analysis in Figure 4C also shows that hnRNPA2 association with cathepsin L promoter is reduced to near normal cell level in reverted cells. These results are consistent with the return of hnRNPA2 protein and mRNA levels when the mtDNA content is reverted back to near control cell level.
HnRNPA2 is an RNA-binding protein [42] and its ability to bind to dsDNA in a sequence specific or non-specific manner remains unknown. To further understand the functional role of hnRNPA2, we carried out electrophoretic mobility shift assay (EMSA) with the 220 bp Cathepsin L promoter DNA as a probe (Figure 4D). The EMSA pattern in Figure 4D shows that extract from mtDNA-depleted cells formed a prominent slow migrating complex while extract from control cells yielded a complex of markedly lower intensity. Notably, silencing of hnRNPA2 mRNA in mtDNA-depleted cells vastly reduced the intensity of the complex (lane 4). Use of higher amount of recombinant protein (2.5μg) also did not result in formation of the slow migrating complex although some complexes possibly reflecting non-specific binding were seen (lane 5). However, addition of recombinant hnRNPA2 (1.0μg) to the nuclear extract from mtDNA-depleted/hnRNPA2 silenced cells formed an intense slow migrating complex (lane 6). Competition with individual factor binding DNA motifs such as NFκB and C/EBPδ (lanes 7 and 8), but not the mutated DNA motifs (lanes 9 and 10), reduced the intensity of the complex. These results indicate that binding of various signature factors is either inter-dependent or cooperative and secondly, hnRNPA2 plays a critical role in the binding.
3.5 Reversal of stress-induced invasive behavior and gene expression by hnRNPA2 silencing
We showed that hnRNPA2 has a role in the activation of stress specific marker genes, Cathepsin L, RyR1 and Glut4 [14]. We confirmed its contribution by silencing hnRNP A2 in control and mtDNA-depleted cells and assessed the mRNA levels of target genes. We detected increase of 2.5 fold in Cathepsin L, 4 fold in RyR1 and 4.2 fold in Glut 4 luciferase activity in mtDNA-depleted cells over the control cells (Figure 5A). These increases were effectively blunted by hnRNPA2 mRNA silencing in mtDNA-depleted cells without any significant decrease in control cells.
Figure 5.

Role of hnRNPA2 in transcription modulation and in vitro invasive behavior of cells subjected to mitochondrial stress. A. Luciferase activity of Cathepsin L, Glut4 and RyR1 promoters in control, mtDNA-depleted and mtDNA-depleted/hnRNPA2 knockdown cells. Transfection with promoter DNAs and measurement of luciferase activities were described in the Methods. B. 2-Deoxyglucose uptake in control, mtDNA-depleted and mtDNA-depleted/hnRNPA2 knockdown cells. C. Effects of mtDNA-depletion and hnRNPA2 knockdown on cell growth. Number of viable cells was measured using the Guava cell counter. D. Matrigel invasion patterns of control, mtDNA-depleted/mock siRNA, and mtDNA-depleted/hnRNPA2 siRNA cells.
We have shown previously that the increased invasiveness of mtDNA-depleted cells is associated with activation of IGF1R pathway and increased glucose uptake [26]. Figure 5B shows that siRNA-mediated knockdown of hnRNPA2 reduced glucose uptake to near control cell levels, suggesting that hnRNPA2 protein also plays an important role in the cellular metabolic shift triggered by mitochondrial respiratory stress.
Previous studies have shown that cells subjected to mitochondrial stress exhibit higher growth rates and invasion. We used these cells to test the effect of hnRNPA2 depletion. Equal numbers of cells (1×10⁴cells) were seeded and cell viability was assessed at 24h intervals. At 24h, mtDNA-depleted cells showed nearly same growth rate as control and mtDNA-depleted/hnRNPA2 silenced cells. However, by 48h mtDNA-depleted cells had grown significantly more than the mtDNA-depleted/hnRNPA2 silenced cells, which were comparable to control C2C12 cells (Figure 5C). Matrigel invasion in Figure 5D shows that after 24 h mtDNA-depleted cells have a significantly higher invasion compared to control cells. This pattern reverts to control levels in mtDNA-depleted/hnRNPA2 silenced cells.
3.6 Akt1 is activated by mitochondrial stress and phosphorylates hnRNPA2
Previous reports have suggested that phosphorylation of hnRNPA2 is important for maintaining the transformed state of tumor cells [43,44]. To evaluate the level of hnRNP A2 phosphorylation in control and mtDNA-depleted cells, we used the same input levels of hnRNPA2 from both cell types for immunoprecipitation. The immunoblot in Figure 6A shows increased Ser-phosphorylation of nuclear hnRNPA2.
Figure 6.

Activation of Akt1 and Akt1 mediated phosphorylation of hnRNPA2 in cells subjected to mitochondrial stress. A. Immunoblot analysis of nuclear protein from control and mtDNA-depleted cells for phosphorylated hnRNPA2 using hnRNPA2 and phospho-Ser antibodies. B. Top panel shows the structural and functional domain of hnRNPA2. The autoradiogram at the bottom shows recombinant Akt1-mediated phosphorylation of purified hnRNPA2. C. Akt1 mRNA quantitation by Real Time PCR in control, mtDNA-depleted, CCCP- treated and reverted cells. D. Akt activity was measured in the nuclear extract of control and mtDNA-depleted cells using an Akt assay kit as described in the Methods section. E. ChIP analysis of Cathepsin L promoter in control, mtDNA-depleted/mock siRNA and mtDNA-depleted/AktsiRNA cells for occupancy of hnRNPA2.
To identify the kinase involved, we focused on Akt which is downstream of IGF1R/PI-3 kinase. Sequence analysis using PhosphoScan site revealed two putative Akt phosphorylation sites (Thr 98 and Ser 219) on hnRNPA2 (Figure 6B top panel). We investigated the significance of these two sites for Akt1-dependent phosphorylation using recombinant hnRNPA2 and Akt. Gel profile in Figure 6B shows the in vitro kinase assay of purified hnRNPA2 with and without Akt1 in presence of 32γ[ATP]. We show that hnRNPA2 is a substrate for phosphorylation by Akt.
Akt is activated in tumorigenic cells [45] and therefore we checked the levels of Akt in cells subjected to mitochondrial stress by mtDNA depletion which develop tumorigenic phenotype. As shown in Figure 6C, Akt1 mRNA level in C2C12 cells was increased by ~ 2 fold in cells subjected to mitochondrial stress (mtDNA depletion and CCCP treatment) as compared to control cells. In reverted cells, Akt1 mRNA level reduced to 1.5 fold of control cells indicating that this increase is a direct response to mitochondrial respiratory stress.
Figure 6D shows that Akt activity is increased by about 2.5 fold in the total lysate and nuclear fractions of mtDNA-depleted cells. However, there was only a marginal increase in Akt activity in the cytosolic fraction of mtDNA-depleted cells.
To understand the significance of Akt phosphorylation on nuclear functions of hnRNPA2, we silenced Akt1 mRNA and protein to 70% by siRNA in C2C12 cells and assessed the promoter occupancy of hnRNPA2 by ChIP analysis (Figure 6E). ChIP analysis using these cells showed that hnRNPA2 occupancy of the cathepsin L promoter was reduced by <75% in mtDNA depleted cells as compared to companion cells expressing mock siRNA.
These results provide direct evidence for the role of Akt1 in transcription activation of stress response genes and mitochondrial stress-induced recruitment of hnRNPA2 to the target gene promoter.
4.0 Discussion
Induced expression of genes encoding mitochondria-destined proteins in response to mitochondrial dysfunction either due to mtDNA mutations or exposure to chemical agents has been observed by several groups in different mammalian cells [6,7,10,46]. More recent studies using differential mRNA display, cDNA array analysis or use of proteomics approach have shown that wide spectrum of genes encoding mitochondrial respiratory complex proteins, cell surface receptors, proteins involved in apoptosis, and transcription regulation are either up or down regulated in cells completely lacking mtDNA (ρ° cells) or partially depleted of mtDNA [6,7,9, and Table 1]. In extension of these studies we describe a detailed mechanism by which mitochondrial respiratory stress modulates nuclear gene expression and identified a set of common protein factors that are essential for stress-specific transcription modulation. Additionally we also describe cellular processes including increased dependence of cells for glucose, resistance to apoptosis, increased invasive behavior of cells and altered cell morphology that are affected as part of this respiratory stress.
We define mitochondrial stress as altered mitochondrial transmembrane potential by treatment with mitochondrial specific ionophore CCCP and/or, depletion of mitochondrial DNA, which induces a unique calcineurin mediated signaling culminating in the altered nuclear gene profile and invasive phenotypes in otherwise non-invasive cells (Figure 7). The need for disruption of Δψm for the induction of stress signaling was further supported by inability of oligomycin mediated ATP depletion alone to induce the signaling cascade (results not shown). The nuclear genes affected by this signaling are diverse in their function and include genes involved in: 1) maintaining calcium regulation/homeostasis—RyR1, Calsequestrin, Calreticulin; 2) invasiveness and oncogenesis – Cathepsin L, TGFβ, Akt, p53, and mouse melanoma antigen; 3) glucose metabolism-IGF1 receptor, IRS-1, GLUT 4, hexokinase; 4) cellular apoptosis—Akt1, PI3-K, Bcl 2, Bid, BAD and Bax [3,5,6,9,11,15,18,26,27,46–50].
Figure 7.
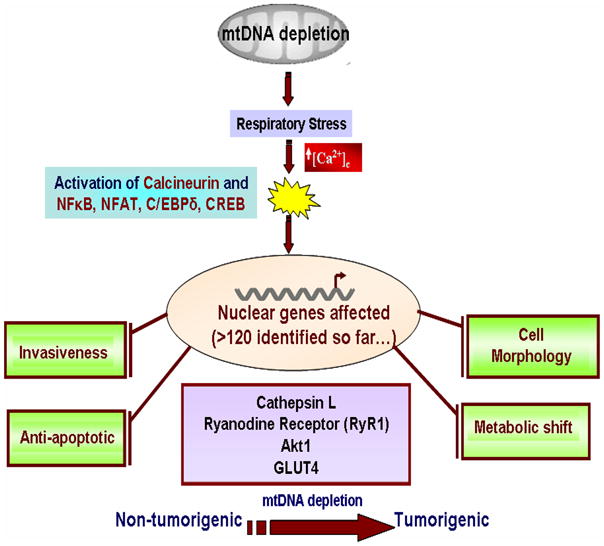
A model for mitochondrial respiratory stress induced activation of nuclear gene expression and altered physiological processes.
In previous studies we showed that cytosolic Cn and IκBβ are two important landmarks of this signaling [5,6,16,26]. We have also shown that nuclear C/EBPδ, CREB and NFAT are also activated in response to respiratory stress [10,14]. We show here that hnRNPA2 is a critical transcription co-activator which is important for the regulation of stress responsive genes suggesting that it represents another critical landmark of this pathway. We show that hnRNPA2, plays a critical role in the functional cooperativity of DNA binding signature factors, and functions as a novel transcription co-activator of respiratory stress signaling pathway.
HnRNPA2 was originally described as an RNA binding protein with possible role in mRNA maturation, transport and other aspects of nuclear RNA processing [42]. More recent studies show that hnRNPA2 and other members of the hnRNP family may have roles in other cellular processes including telomere function, cell proliferation and oncogenesis [44,51,52]. There is mounting evidence implicating hnRNPA2 in a varietyof cancers, including lung, breast, and pancreatic cancer [26,32,51]. HnRNPA2 has been found to associate with many oncogenic proteins (TDP-43, TOG2, and SET) in tumor cells [53–56], although the functional relevance of these interactions have remained unclear until now. In this paper we propose that hnRNPA2 also functions as a transcription coactivator.
It was recently shown that other members of hnRNP family such as hnRNP K participates in the transcription regulation of genes involved in UV- induced DNA damage [57]. It was shown that hnRNP K manifests its transcription activator function by directly binding to promoter DNA in a sequence specific manner and also by association with other DNA bound transcription activators [57]. In repeated attempts we were unable to detect any significant DNA binding ability of hnRNPA2 from the nuclear fractions of control or mtDNA-depleted C2C12 cells. This was true with DNA from minimal promoter regions of the stress-target genes RyR1, Cathepsin L or Glut4 shown in Figure 3A or non specific double stranded DNA. Bacterially expressed and purified hnRNPA2 formed minor non-specific (fast migrating) complexes with Cathepsin L promoter DNA. Purified hnRNPA2, however induced the formation of a prominent slow migrating complex with extracts from hnRNPA2 knock down cells that was also seen with extract from mtDNA-depleted cells containing full complement of hnRNPA2. Additionally, DNA motifs corresponding to the putative C/EBPδ and cRel:p50 binding sites competed with the slow migrating complex. These results and also results of ChIP analysis suggest that hnRNPA2 associates with the DNA bound factors (C/EBPδ, cRel:p50, NFAT and CREB) mostly by protein-protein interactions. In this regard hnRNPA2 is different from other members of hnRNP family proteins which also function as transcription coactivators. Notably, stress mediated transcription modulation requiring the action of hnRNPA2 is also important for tumor progression and in vitro invasion through the Matrigel membrane since stable or transient knock down of hnRNPA2 not only abrogated the propagation of signaling, but also reversed the invasive phenotypes of mtDNA-depleted cells.
Our previous work has shown that cells subjected to mitochondrial stress develop resistance to apoptosis which was also accompanied by shift in the metabolic pattern of cells. We have shown that the metabolic shift to glycolysis in these cells involves a switch from insulin to the IGF1 receptor mediated signaling [26], which appears to be autocrine type of regulation. In continuation of this study we show here that altered metabolic shift also causes increased nuclear accumulation and activation of Akt under mitochondrial stress. Other reports have shown that nuclear translocation of p-Akt is considered to be of particular significance in tumor progression [58]. Additionally, some recent studies implicate activation of Akt in mtDNA-depleted prostate and other tumor cells in increased invasiveness of these cells [59, 60]. Our results on Akt1 activation in mtDNA-depleted C2C12 cells are consistent with these published results. Results presented in this paper, however extend these observations by linking its direct role in the phosphorylation and activation of transcription coactivator, hnRNPA2. We show that Akt1 knock down not only reduced the promoter occupancy of hnRNPA2, but also transcription activation of mitochondrial stress responsive target genes. Our results here suggest Akt phosphorylates mitochondrial stress activated coactivator hnRNPA2 and regulates its occupancy of target gene promoters.
In summary we present a common mechanism for the mitochondrial respiratory stress mediated transcriptional modulation of several nuclear genes that affect multiple cellular processes as shown in Figure 7. As indicated, mitochondrial respiratory stress alters: 1. glucose uptake and utilization by activating IGF1R and PI-3 kinase pathway [26]. 2. Resistance to apoptosis possibly through activation of Akt1 kinase system. 3. Reprogramming of nuclear gene expression pattern through activation of four signature factors (C/EBPδ, cRel:p50, NFAT, CREB) and recruitment of hnRNPA2 in an Akt1 kinase dependent manner. The genes affected include those involved in cell proliferation, oncogenesis and cell invasion. 4. As shown before, the stress signaling also causes major changes in cytoskeletal organization, development of pseudopodia-like structures, and altered organization of FAK on microtubular assembly [6,27]. We believe that the mechanism we describe here is important in understanding cellular response to altered mitochondrial function and bioenergetic sytem.
5.0 References
- 1.Wallace DC. A mitochondrial paradigm of metabolic and degenerative diseases, aging, and cancer: a dawn for evolutionary medicine. Annu Rev Genet. 2005;39:359–407. doi: 10.1146/annurev.genet.39.110304.095751. [DOI] [PMC free article] [PubMed] [Google Scholar]
- 2.Shokolenko I, Venediktova N, Bochkareva A, Wilson GL, Alexeyev MF. Oxidative stress induces degradation of mitochondrial DNA. Nucleic Acids Res. 2009;37:2539–2548. doi: 10.1093/nar/gkp100. [DOI] [PMC free article] [PubMed] [Google Scholar]
- 3.Biswas G, Adebanjo OA, Freedman BD, Anandatheerthavarada HK, Vijayasarathy C, Zaidi M, Kotlikoff M, Avadhani NG. Retrograde Ca2+ signaling in C2C12 skeletal myocytes in response to mitochondrial genetic and metabolic stress: a novel mode of inter-organelle crosstalk. EMBO J. 1999;18:522–533. doi: 10.1093/emboj/18.3.522. [DOI] [PMC free article] [PubMed] [Google Scholar]
- 4.Murphy BJ, Robin ED, Tapper DP, Wong RJ, Clayton DA. Hypoxic coordinate regulation of mitochondrial enzymes in mammalian cells. Science. 1984;223:707–709. doi: 10.1126/science.6320368. [DOI] [PubMed] [Google Scholar]
- 5.Srinivasan S, Avadhani NG. Hypoxia-mediated mitochondrial stress in RAW264.7 cells induces osteoclast-like TRAP-positive cells. Ann N Y Acad Sci. 2007;1117:51–61. doi: 10.1196/annals.1402.067. [DOI] [PMC free article] [PubMed] [Google Scholar]
- 6.Biswas G, Tang W, Sondheimer N, Guha M, Bansal S, Avadhani NG. A distinctive physiological role for IkappaBbeta in the propagation of mitochondrial respiratory stress signaling. J Biol Chem. 2008;283:12586–12594. doi: 10.1074/jbc.M710481200. [DOI] [PMC free article] [PubMed] [Google Scholar]
- 7.Delsite R, Kachhap S, Anbazhagan R, Gabrielson E, Singh KK. Nuclear genes involved in mitochondria-to-nucleus communication in breast cancer cells. Mol Cancer. 2002;1:6. doi: 10.1186/1476-4598-1-6. [DOI] [PMC free article] [PubMed] [Google Scholar]
- 8.Lee J, Pilch PF. The insulin receptor: structure, function, and signaling. Am J Physiol. 1994;266:C319–C334. doi: 10.1152/ajpcell.1994.266.2.C319. [DOI] [PubMed] [Google Scholar]
- 9.Amuthan G, Biswas G, Zhang SY, Klein-Szanto A, Vijayasarathy C, Avadhani NG. Mitochondria-to-nucleus stress signaling induces phenotypic changes, tumor progression and cell invasion. EMBO J. 2001;20:1910–1920. doi: 10.1093/emboj/20.8.1910. [DOI] [PMC free article] [PubMed] [Google Scholar]
- 10.Biswas G, Guha M, Avadhani NG. Mitochondria-to-nucleus stress signaling in mammalian cells: nature of nuclear gene targets, transcription regulation, and induced resistance to apoptosis. Gene. 2005;354:132–139. doi: 10.1016/j.gene.2005.03.028. [DOI] [PMC free article] [PubMed] [Google Scholar]
- 11.Biswas G, Srinivasan S, Anandatheerthavarada HK, Avadhani NG. Dioxin-mediated tumor progression through activation of mitochondria-to-nucleus stress signaling. Proc Natl Acad Sci U S A. 2008;105:186–191. doi: 10.1073/pnas.0706183104. [DOI] [PMC free article] [PubMed] [Google Scholar]
- 12.Butow RA, Avadhani NG. Mitochondrial signaling: the retrograde response. Mol Cell. 2004;14:1–15. doi: 10.1016/s1097-2765(04)00179-0. [DOI] [PubMed] [Google Scholar]
- 13.Cottrell DA, Blakely EL, Johnson MA, Borthwick GM, Ince PI, Turnbull DM. Mitochondrial DNA mutations in disease and ageing. Novartis Found Symp. 2001;235:234–243. doi: 10.1002/0470868694.ch19. [DOI] [PubMed] [Google Scholar]
- 14.Guha M, Pan H, Fang JK, Avadhani NG. Heterogeneous nuclear ribonucleoprotein A2 is a common transcriptional coactivator in the nuclear transcription response to mitochondrial respiratory stress. Mol Biol Cell. 2009;20:4107–4119. doi: 10.1091/mbc.E09-04-0296. [DOI] [PMC free article] [PubMed] [Google Scholar]
- 15.Amuthan G, Biswas G, Ananadatheerthavarada HK, Vijayasarathy C, Shephard HM, Avadhani NG. Mitochondrial stress-induced calcium signaling, phenotypic changes and invasive behavior in human lung carcinoma A549 cells. Oncogene. 2002;21:7839–7849. doi: 10.1038/sj.onc.1205983. [DOI] [PubMed] [Google Scholar]
- 16.Biswas G, Anandatheerthavarada HK, Zaidi M, Avadhani NG. Mitochondria to nucleus stress signaling: a distinctive mechanism of NFkappaB/Rel activation through calcineurin-mediated inactivation of IkappaBbeta. J Cell Biol. 2003;161:507–519. doi: 10.1083/jcb.200211104. [DOI] [PMC free article] [PubMed] [Google Scholar]
- 17.Arnould T, Vankoningsloo S, Renard P, Houbion A, Ninane N, Demazy C, Remacle J, Raes M. CREB activation induced by mitochondrial dysfunction is a new signaling pathway that impairs cell proliferation. EMBO J. 2002;21:53–63. doi: 10.1093/emboj/21.1.53. [DOI] [PMC free article] [PubMed] [Google Scholar]
- 18.Zhao Q, Wang J, Levichkin IV, Stasinopoulos S, Ryan MT, Hoogenraad NJ. A mitochondrial specific stress response in mammalian cells. EMBO J. 2002;21:4411–4419. doi: 10.1093/emboj/cdf445. [DOI] [PMC free article] [PubMed] [Google Scholar]
- 19.Bustamante E, Morris HP, Pedersen PL. Energy metabolism of tumor cells. Requirement for a form of hexokinase with a propensity for mitochondrial binding. J Biol Chem. 1981;256:8699–8704. [PubMed] [Google Scholar]
- 20.Meierhofer D, Mayr JA, Foetschl U, Berger A, Fink K, Schmeller N, Hacker GW, Hauser-Kronberger C, Kofler B, Sperl W. Decrease of mitochondrial DNA content and energy metabolism in renal cell carcinoma. Carcinogenesis. 2004;25:1005–1010. doi: 10.1093/carcin/bgh104. [DOI] [PubMed] [Google Scholar]
- 21.Saada A, Shaag A, Elpeleg O. mtDNA depletion myopathy: elucidation of the tissue specificity in the mitochondrial thymidine kinase (TK2) deficiency. Mol Genet Metab. 2003;79:1–5. doi: 10.1016/s1096-7192(03)00063-5. [DOI] [PubMed] [Google Scholar]
- 22.Vander Heiden MG, Cantley LC, Thompson CB. Understanding the Warburg effect: the metabolic requirements of cell proliferation. Science. 2009;324:1029–1033. doi: 10.1126/science.1160809. [DOI] [PMC free article] [PubMed] [Google Scholar]
- 23.Mazurek S, Eigenbrodt E. The tumor metabolome. Anticancer Res. 2003;23:1149–1154. [PubMed] [Google Scholar]
- 24.Parrella P, Xiao Y, Fliss M, Sanchez-Cespedes M, Mazzarelli P, Rinaldi M, Nicol T, Gabrielson E, Cuomo C, Cohen D, Pandit S, Spencer M, Rabitti C, Fazio VM, Sidransky D. Detection of mitochondrial DNA mutations in primary breast cancer and fine-needle aspirates. Cancer Res. 2001;61:7623–7626. [PubMed] [Google Scholar]
- 25.Shidara Y, Yamagata K, Kanamori T, Nakano K, Kwong JQ, Manfredi G, Oda H, Ohta S. Positive contribution of pathogenic mutations in the mitochondrial genome to the promotion of cancer by prevention from apoptosis. Cancer Res. 2005;65:1655–1663. doi: 10.1158/0008-5472.CAN-04-2012. [DOI] [PubMed] [Google Scholar]
- 26.Guha M, Srinivasan S, Biswas G, Avadhani NG. Activation of a novel calcineurin-mediated insulin-like growth factor-1 receptor pathway, altered metabolism, and tumor cell invasion in cells subjected to mitochondrial respiratory stress. J Biol Chem. 2007;282:14536–14546. doi: 10.1074/jbc.M611693200. [DOI] [PMC free article] [PubMed] [Google Scholar]
- 27.Biswas G, Anandatheerthavarada HK, Avadhani NG. Mechanism of mitochondrial stress-induced resistance to apoptosis in mitochondrial DNA-depleted C2C12 myocytes. Cell Death Differ. 2005;12:266–278. doi: 10.1038/sj.cdd.4401553. [DOI] [PubMed] [Google Scholar]
- 28.Dey R, Moraes CT. Lack of oxidative phosphorylation and low mitochondrial membrane potential decrease susceptibility to apoptosis and do not modulate the protective effect of Bcl-x(L) in osteosarcoma cells. J Biol Chem. 2000;275:7087–7094. doi: 10.1074/jbc.275.10.7087. [DOI] [PubMed] [Google Scholar]
- 29.Liu ML, Olson AL, Moye-Rowley WS, Buse JB, Bell GI, Pessin JE. Expression and regulation of the human GLUT4/muscle-fat facilitative glucose transporter gene in transgenic mice. J Biol Chem. 1992;267:11673–11676. [PubMed] [Google Scholar]
- 30.Frevert EU, Kahn BB. Differential effects of constitutively active phosphatidylinositol 3-kinase on glucose transport, glycogen synthase activity, and DNA synthesis in 3T3-L1 adipocytes. Mol Cell Biol. 1997;17:190–198. doi: 10.1128/mcb.17.1.190. [DOI] [PMC free article] [PubMed] [Google Scholar]
- 31.Antoni FA, Shipston MJ, Smith SM. Inhibitory role for calcineurin in stimulus-secretion coupling revealed by FK506 and cyclosporin A in pituitary corticotrope tumor cells. Biochem Biophys Res Commun. 1993;194:226–233. doi: 10.1006/bbrc.1993.1808. [DOI] [PubMed] [Google Scholar]
- 32.Dignam JD, Lebovitz RM, Roeder RG. Accurate transcription initiation by RNA polymerase II in a soluble extract from isolated mammalian nuclei. Nucleic Acids Res. 1983;11:1475–1489. doi: 10.1093/nar/11.5.1475. [DOI] [PMC free article] [PubMed] [Google Scholar]
- 33.Masternak K, Muhlethaler-Mottet A, Villard J, Zufferey M, Steimle V, Reith W. CIITA is a transcriptional coactivator that is recruited to MHC class II promoters by multiple synergistic interactions with an enhanceosome complex. Genes Dev. 2000;14:1156–1166. [PMC free article] [PubMed] [Google Scholar]
- 34.Summers SA, Birnbaum MJ. A role for the serine/threonine kinase, Akt, in insulin-stimulated glucose uptake. Biochem Soc Trans. 1997;25:981–988. doi: 10.1042/bst0250981. [DOI] [PubMed] [Google Scholar]
- 35.Carafoli E. The calcium cycle of mitochondria. FEBS Lett. 1979;104:1–5. doi: 10.1016/0014-5793(79)81073-x. [DOI] [PubMed] [Google Scholar]
- 36.Hajnoczky G, Robb-Gaspers LD, Seitz MB, Thomas AP. Decoding of cytosolic calcium oscillations in the mitochondria. Cell. 1995;82:415–424. doi: 10.1016/0092-8674(95)90430-1. [DOI] [PubMed] [Google Scholar]
- 37.Rizzuto R, Brini M, Murgia M, Pozzan T. Microdomains with high Ca2+ close to IP3-sensitive channels that are sensed by neighboring mitochondria. Science. 1993;262:744–747. doi: 10.1126/science.8235595. [DOI] [PubMed] [Google Scholar]
- 38.Yagel S, Warner AH, Nellans HN, Lala PK, Waghorne C, Denhardt DT. Suppression by cathepsin L inhibitors of the invasion of amnion membranes by murine cancer cells. Cancer Res. 1989;49:3553–3557. [PubMed] [Google Scholar]
- 39.Molkentin JD, Lu JR, Antos CL, Markham B, Richardson J, Robbins J, Grant SR, Olson EN. A calcineurin-dependent transcriptional pathway for cardiac hypertrophy. Cell. 1998;93:215–228. doi: 10.1016/s0092-8674(00)81573-1. [DOI] [PMC free article] [PubMed] [Google Scholar]
- 40.O’Keefe SJ, Tamura J, Kincaid RL, Tocci MJ, O’Neill EA. FK-506- and CsA-sensitive activation of the interleukin-2 promoter by calcineurin. Nature. 1992;357:692–694. doi: 10.1038/357692a0. [DOI] [PubMed] [Google Scholar]
- 41.Shibasaki F, McKeon F. Calcineurin functions in Ca(2+)-activated cell death in mammalian cells. J Cell Biol. 1995;131:735–743. doi: 10.1083/jcb.131.3.735. [DOI] [PMC free article] [PubMed] [Google Scholar]
- 42.Dreyfuss G, Matunis MJ, Pinol-Roma S, Burd CG. hnRNP proteins and the biogenesis of mRNA. Annu Rev Biochem. 1993;62:289–321. doi: 10.1146/annurev.bi.62.070193.001445. [DOI] [PubMed] [Google Scholar]
- 43.Pancetti F, Bosser R, Krehan A, Pyerin W, Itarte E, Bachs O. Heterogeneous nuclear ribonucleoprotein A2 interacts with protein kinase CK2. Biochem Biophys Res Commun. 1999;260:17–22. doi: 10.1006/bbrc.1999.0849. [DOI] [PubMed] [Google Scholar]
- 44.Satoh H, Kamma H, Ishikawa H, Horiguchi H, Fujiwara M, Yamashita YT, Ohtsuka M, Sekizawa K. Expression of hnRNP A2/B1 proteins in human cancer cell lines. Int J Oncol. 2000;16:763–767. doi: 10.3892/ijo.16.4.763. [DOI] [PubMed] [Google Scholar]
- 45.DeBerardinis RJ, Lum JJ, Hatzivassiliou G, Thompson CB. The biology of cancer: metabolic reprogramming fuels cell growth and proliferation. Cell Metab. 2008;7:11–20. doi: 10.1016/j.cmet.2007.10.002. [DOI] [PubMed] [Google Scholar]
- 46.Jahangir Tafrechi RS, Svensson PJ, Janssen GM, Szuhai K, Maassen JA, Raap AK. Distinct nuclear gene expression profiles in cells with mtDNA depletion and homoplasmic A3243G mutation. Mutat Res. 2005;578:43–52. doi: 10.1016/j.mrfmmm.2005.02.002. [DOI] [PubMed] [Google Scholar]
- 47.Crimi M, Bordoni A, Menozzi G, Riva L, Fortunato F, Galbiati S, Del BR, Pozzoli U, Bresolin N, Comi GP. Skeletal muscle gene expression profiling in mitochondrial disorders. FASEB J. 2005;19:866–868. doi: 10.1096/fj.04-3045fje. [DOI] [PubMed] [Google Scholar]
- 48.Guarente L, Kenyon C. Genetic pathways that regulate ageing in model organisms. Nature. 2000;408:255–262. doi: 10.1038/35041700. [DOI] [PubMed] [Google Scholar]
- 49.Lin MT, Beal MF. Mitochondrial dysfunction and oxidative stress in neurodegenerative diseases. Nature. 2006;443:787–795. doi: 10.1038/nature05292. [DOI] [PubMed] [Google Scholar]
- 50.Liu Z, Sekito T, Epstein CB, Butow RA. RTG-dependent mitochondria to nucleus signaling is negatively regulated by the seven WD-repeat protein Lst8p. EMBO J. 2001;20:7209–7219. doi: 10.1093/emboj/20.24.7209. [DOI] [PMC free article] [PubMed] [Google Scholar]
- 51.Moran-Jones K, Wayman L, Kennedy DD, Reddel RR, Sara S, Snee MJ, Smith R. hnRNP A2, a potential ssDNA/RNA molecular adapter at the telomere. Nucleic Acids Res. 2005;33:486–496. doi: 10.1093/nar/gki203. [DOI] [PMC free article] [PubMed] [Google Scholar]
- 52.Patry C, Bouchard L, Labrecque P, Gendron D, Lemieux B, Toutant J, Lapointe E, Wellinger R, Chabot B. Small interfering RNA-mediated reduction in heterogeneous nuclear ribonucleoparticule A1/A2 proteins induces apoptosis in human cancer cells but not in normal mortal cell lines. Cancer Res. 2003;63:7679–7688. [PubMed] [Google Scholar]
- 53.Buratti E, Brindisi A, Giombi M, Tisminetzky S, Ayala YM, Baralle FE. TDP-43 binds heterogeneous nuclear ribonucleoprotein A/B through its C-terminal tail: an important region for the inhibition of cystic fibrosis transmembrane conductance regulator exon 9 splicing. J Biol Chem. 2005;280:37572–37584. doi: 10.1074/jbc.M505557200. [DOI] [PubMed] [Google Scholar]
- 54.Kosturko LD, Maggipinto MJ, D’Sa C, Carson JH, Barbarese E. The microtubule-associated protein tumor overexpressed gene binds to the RNA trafficking protein heterogeneous nuclear ribonucleoprotein A2. Mol Biol Cell. 2005;16:1938–1947. doi: 10.1091/mbc.E04-08-0709. [DOI] [PMC free article] [PubMed] [Google Scholar]
- 55.Vera J, Estanyol JM, Canela N, Lorens F, Agell N, Itarte E, Bachs O, Jaumot M. Proteomic analysis of SET-binding proteins. Proteomics. 2007;7:578–587. doi: 10.1002/pmic.200600458. [DOI] [PubMed] [Google Scholar]
- 56.Vera J, Jaumot M, Estanyol JM, Brun S, Agell N, Bachs O. Heterogeneous nuclear ribonucleoprotein A2 is a SET-binding protein and a PP2A inhibitor. Oncogene. 2006;25:260–270. doi: 10.1038/sj.onc.1209050. [DOI] [PubMed] [Google Scholar]
- 57.Moumen A, Masterson P, O’Connor MJ, Jackson SP. hnRNP K: an HDM2 target and transcriptional coactivator of p53 in response to DNA damage. Cell. 2005;123:1065–1078. doi: 10.1016/j.cell.2005.09.032. [DOI] [PubMed] [Google Scholar]
- 58.Lee SB, Xuan Nguyen TL, Choi JW, Lee KH, Cho SW, Liu Z, Ye K, Bae SS, Ahn JY. Nuclear Akt interacts with B23/NPM and protects it from proteolytic cleavage, enhancing cell survival. Proc Natl Acad Sci U S A. 2008;105:16584–16589. doi: 10.1073/pnas.0807668105. [DOI] [PMC free article] [PubMed] [Google Scholar]
- 59.Moro L, Arbini AA, Yao JL, di Sant’Agnese PA, Marra E, Greco M. Mitochondrial DNA depletion in prostate epithelial cells promotes anoikis resistance and invasion through activation of PI3K/Akt2. Cell Death Differ. 2009;16:571–583. doi: 10.1038/cdd.2008.178. [DOI] [PubMed] [Google Scholar]
- 60.Pelicano H, Xu RH, Du M, Feng L, Sasaki R, Carew JS, Hu Y, Ramdas L, Hu L, Keating MJ, Zhang W, Plunkett W, Huang P. Mitochondrial respiration defects in cancer cells cause activation of Akt survival pathway through a redox-mediated mechanism. J Cell Biol. 2006;175:913–923. doi: 10.1083/jcb.200512100. [DOI] [PMC free article] [PubMed] [Google Scholar]