Abstract
Several novel and established knowledge-based discriminatory function formulations and reference state derivations have been evaluated to identify parameter sets capable of distinguishing native and near-native biomolecular interactions from incorrect ones. We developed the r·m·r function, a novel atomic level radial distribution function with mean reference state that averages over all pairwise atom types from a reduced atom type composition, using experimentally determined intermolecular complexes in the Cambridge Structural Database (CSD) and the Protein Data Bank (PDB) as the information sources. We demonstrate that r·m·r had the best discriminatory accuracy and power for protein-small molecule and protein-DNA interactions, regardless of whether the native complex was included or excluded from the test set. The superior performance of the r·m·r discriminatory function compared to seventeen alternative functions evaluated on publicly available test sets for protein-small molecule and protein-DNA interactions indicated that the function was not over optimized through back testing on a single class of biomolecular interactions. The initial success of the reduced composition and superior performance with the CSD as the distribution set over the PDB implies that further improvements and generality of the function are possible by deriving probabilities from subsets of the CSD, using structures that consist of only the atom types to be considered for given biomolecular interactions. The method is available as a web server module at http://protinfo.compbio.washington.edu.
Keywords and phrases: discriminatory function, knowledge-based, protein-small molecule, protein-DNA, protein-ligand, complexes, biomolecular interactions
Introduction
Protein structures are useful for understanding, predicting, modulating, and designing biomolecular interactions, as the intermolecular geometric and chemical complementarity is the essence of binding. Given molecular structures, computational methods can be successfully used to evaluate intermolecular interactions and serve as a complementary tool to experimental investigation.
A structure guided computational approach to evaluating biomolecular interactions generally consists of three steps: (a) conformational sampling of the intermolecular rotational, translational, and torsion angle degrees of freedom, (b) scoring the resulting interactions with a discriminatory function to identify native and near-native complexes from a set of incorrect conformations, and (c) relative affinity ranking of interactions to distinguish between strong, weak, and non-binders. Here, we focus on development and evaluation of a novel atomic level discriminatory function to identify native and near-native interactions and guide the rotational, translational, and torsion angle conformational sampling requirements for biomolecular interactions. Additionally, accurate discrimination of native and near-native biomolecular interactions from incorrect conformations is critical since a failure at this step may lead to erroneous relative affinity ranking of interactions and eventually propagate into experimental investigation that is not well guided.
A variety of physics-based, empirical, and knowledge-based functions have been used to discriminate native and near-native complexes from a set of incorrect conformations [1]. Knowledge-based functions have proven to be particularly successful at correctly identifying a variety of biomolecular interactions, including protein structure prediction [2], protein-small molecule [3], protein-DNA [4], and protein-protein complexes [5]. Despite previous successes with these discriminatory functions, generalized parameter sets have not been demonstrated to be highly accurate across a diverse set of biomolecular interactions. Therefore, we have evaluated several novel and established discriminatory function formulations and reference state derivations, which are crucial to the performance of knowledge-based functions, to identify unifying parameter sets applicable to multiple types of biomolecular interactions. The following methods for scoring biomolecular interactions have been successfully applied herein to independent protein-small molecule and protein-DNA test sets. We demonstrate that the methods have not been over optimized for a single class of biomolecular interactions, suggesting suitability for additional molecular interaction types (e.g., protein-protein, protein-RNA, protein-metal ion, DNA-small molecule, and RNA-small molecule interactions).
Methods
Discriminatory function formulation
We developed an atomic level knowledge-based discriminatory function, using experimentally determined interactions as the source of information (refer to the Reference state derivation section below), for the identification of native and near-native intermolecular complexes from a set of ‘decoy’ conformations. Following the approach of [2], a score S was calculated for each conformation solely using a set of intermolecular atomic distances { }, where is the distance between atoms i and j, of types a and b, respectively:
| (1) |
Accordingly, the score was calculated as a function of the probability of observing a distance r for each intermolecular pair ij of atom types ab in a correct intermolecular binding mode C, relative to the probability P(rij) of seeing any two atom types from the reference state (i.e., prior distribution) at the same distance. This discriminatory function formulation resembles the net potential of mean force derived from the inverse Boltzmann principle [2, 6, 7], which is obtained by subtracting the mean force of the reference state from the mean force of the total system to remove all forces that are common to all intermolecular atomic pair interactions. A key assumption here is that experimental data from which the potentials of mean force are derived are representative of the thermodynamic equilibrium of the interaction types being evaluated. The ability of the discriminatory function to identify native and near-native intermolecular complexes from a set of decoys is therefore dependent on the calculation of probabilities that are representative of the energetics of the system under investigation. To identify the representation that would provide the maximum discrimination, these probabilities were calculated and evaluated in the form of normalized frequency distribution functions and radial distribution functions.
Normalized frequency distribution functions
Based on the number of atoms Ns located within each discretized spherical shell, the conditional probability was calculated as a normalized frequency distribution function according to the following:
| (2) |
The reference state was calculated in the form of either a mean normalized frequency distribution function averaged over all n unique ab pairs in equation (3) or a cumulative normalized frequency distribution function for all unique ab pairs in equation (4):
| (3) |
| (4) |
Radial distribution functions
The radial distribution function g(r) is defined such that multiplication by the bulk density ρ is equal to the observed density of atoms of type b within a distance bin r + Δr given there is an atom of type a at the origin [8, pg. 197]. The function g(r) can be thought of as a factor that, when multiplied by the bulk density, gives a local density about the central atom. The bulk density is ρ = N/V, where N is the total number of atoms in the spherical volume element V. The local densities are determined for each radial bin by the number of atoms Ns located within each discretized spherical shell of volume Vs with thickness Δr, where:
| (5) |
| (6) |
The shell volume therefore reduces to the familiar 4πr2Δr for small Δr; however, equation (6) was used as it is applicable for all bin sizes Δr.
For any distance r between atoms of type ab, the conditional probability in the form of a radial distribution function is:
| (7) |
The reference state was calculated in the form of either a mean radial distribution function averaged over all n unique ab pairs in equation (8) or a cumulative radial distribution function for all unique ab pairs in equation (9):
| (8) |
| (9) |
The difference between the normalized frequency distribution functions and the radial distribution functions is that the latter account for changes in observed frequencies related to the radial increase in shell volume.
Reference state derivation
Distributions
The probabilities P(rab|C) and P (r) for all combinations of atom types were derived from pairwise atom-atom distances of experimentally determined small molecule crystal structures in the Cambridge Structural Database (CSD) [9]. For each molecule with complete solved density as queried using ConQuest [10], symmetry equivalent molecules were generated to a minimum distance of 15 Å from the central molecule with the CCP4 molecular-graphics package [11]. This ‘CSD distribution set’ was used to score the protein-small molecule and protein-DNA test sets.
To evaluate the effect of distribution set source data on discriminatory ability, pairwise atom-atom distance distributions between protein and DNA molecules were calculated from protein-DNA complexes in the Protein Data Bank (PDB) [12], excluding those with greater than thirty percent identity and those complexes evaluated in the protein-DNA test set. This ‘PDB distribution set’ was used to score the protein-DNA test set, with the scoring results being compared to those from the CSD distribution set.
Composition
Each of the distribution sets was composed in two forms to derive the reference state. The ‘complete’ composition includes all distances within rcutoff from all atom types present in the selected distribution set. The ‘reduced’ composition includes only distances within rcutoff from atoms of type a paired with atoms of type b in the selected distribution set for each molecule in the given biomolecular complex to be evaluated.
Implementation
Atom typing
The discerned atom types and accompanying algorithm were adapted from the program IDATM [13] as implemented in UCSF Chimera [14].
Distance range searching
To score intermolecular complexes, all intermolecular heavy atom pairs located at a distance r within the range of 0 < r ≤ rcutoff were identified. A grid hash data structure was utilized for rapid identification of satisfactory pairs between stationary and mobile structures. Accordingly, as the numbered stationary heavy atom coordinates were read, a greatest integer function (i.e., floor function) was applied to the coordinates, thereby assigning the heavy atom number as a value to a ‘base’ gridpoint key. The heavy atom number was also assigned as a value to all other gridpoint keys within rcutoff + 1 of the ‘base’ gridpoint key. The mobile molecular coordinates were then read and floored, with the resulting coordinates being used as the key to lookup all stationary heavy atom number values within rcutoff of the mobile atoms.
Motivation for and incorporation of a steric repulsion term
There was a lack of observed atom type pairs at certain distance bins. Occasionally, this arose from atom type pairs being inadequately represented in the selected distribution set. However, in the present work this resulted most frequently from certain interatomic distances being sterically inaccessible for each atom type pair. Knowledge-based functions with a formulation such as equation (1) often assign a value of 0 to the score for such distance bins. Alternatively, a score of 5 (i.e., a strongly disfavored interaction) was assigned to penalize interatomic distances less than the sum of the van der Waals radii minus 0.6 Å that lacked observed atom type pairs in such bins from the selected distribution set. The van der Waals radii were taken from [15]. Only heavy atoms were considered here. However, implementations including hydrogen could utilize the hydrogen radius of [16], which more accurately represents the nonbonded contact distances observed in crystal structures. Radii that are not available in either of these publications were assigned a value of 2 Å.
Evaluation of discriminatory functions implemented herein
Parameters
The discriminatory function parameters evaluated are summarized in Table 1. For each parameter set, each distance cutoff from the set rcutoff = {4, 5, 6, …, 15} Å was evaluated with a bin size Δr of 0.1 Å.
Table 1.
Discriminatory function parameter sets evaluated in this work
| Set | Distribution Function | Reference State | Composition |
|---|---|---|---|
| nf·m·c | normalized frequency | mean | complete |
| nf·m·r | normalized frequency | mean | reduced |
| nf·c·c | normalized frequency | cumulative | complete |
| nf·c·r | normalized frequency | cumulative | reduced |
| r·m·c | radial | mean | complete |
| r·m·r | radial | mean | reduced |
| r·c·c | radial | cumulative | complete |
| r·c·r | radial | cumulative | reduced |
normalized frequency: probability calculation by normalizing the observed frequencies for each atom type pair at each radial distance bin by the observed frequencies for each atom type pair at all radial distance bins within rcutoff
radial: same as the normalized frequency, except that each observed frequency is further normalized by the spherical volume element
mean: averaging normalization of the reference state over all unique atom type pairs
cumulative: cumulative normalization of the reference state for all unique atom type pairs
complete: composition including all distances from all atom types present in the selected distribution set
reduced: composition including only distances from atoms of type a paired with atoms of type b in the selected distribution set for each molecule in the given biomolecular complex to be evaluated
Metrics
To evaluate the ability of various discriminatory function parameter sets to distinguish native and near-native intermolecular complexes from non-native conformations, the heavy atom root mean square deviation (RMSD) and standard score, or z-score, were calculated.
The RMSD was used to measure the average distance between the native and decoy conformations of the mobile molecule. Due to uncertainty in experimentally determined atomic coordinates, ‘accurate’ discrimination was defined as the lowest scoring intermolecular conformation having an RMSD of less than 0.5 Å from the native conformation. The percent accuracy over all intermolecular complexes in each test set was calculated for each parameter set.
The z-score was used to indicate how many standard deviations the native and nearest-native intermolecular complex scores were above or below the mean score. Consequently, a lower (i.e., more negative) z-score was indicative of the ability of the discriminatory function to more significantly distinguish native and near-native complexes from non-native conformations. The mean native and nearest-native z-scores over all intermolecular complexes in each test set were calculated for each parameter set.
Test sets
Protein-small molecule test set
The publicly available test set [17] published by [18] was used to evaluate the performance of the present function on protein-small molecule decoy discrimination. The test set consisted of 100 crystallographically determined complexes available in the PDB [12], each containing a decoy set of 100 additional small molecule conformations generated using AutoDock [19]. In addition to evaluating various parameter sets of the present discriminatory function, this test set enabled direct comparison to sixteen additional functions [3, 18, 20, 21].
Protein-DNA test set
The publicly available test set [22] published by [4] was used to evaluate the performance of the present function on protein-DNA decoy discrimination. The test set consisted of 45 crystallographically determined complexes available in the PDB [12], each containing a decoy set of 10000 additional intermolecular conformations generated using FTDock [23]. We used this test set to evaluate the effect of distribution set source data (i.e., interatomic distance distributions in the CSD versus the PDB) on discriminatory ability. Additionally, this test set was selected to evaluate discriminatory function performance and parameter selection on multiple types of molecular interactions (i.e., protein-small molecule and protein-DNA) to ensure that the function was not over optimized through back testing on a single class of biomolecular interactions.
Results and Discussion
Evaluation of protein-small molecule interactions
The protein-small molecule test set was used to evaluate discriminatory accuracy and power of various parameter sets, and ensure that the chosen set performs comparably to existing functions.
Accuracy of protein-small molecule interactions
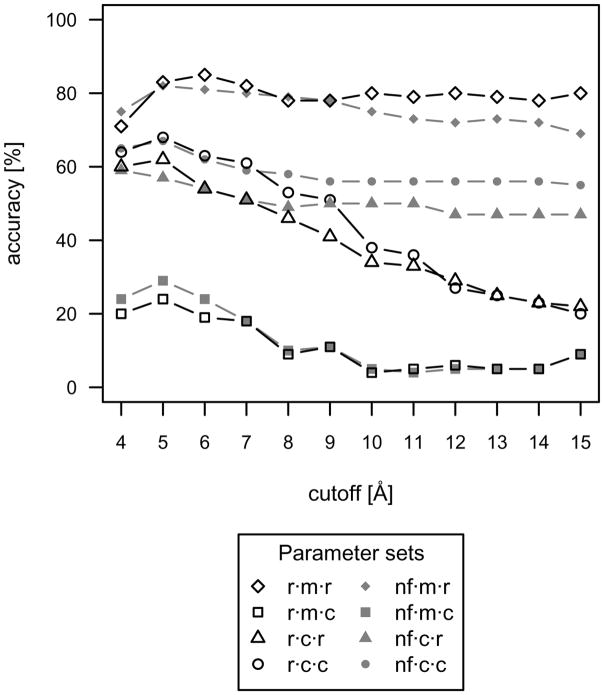
One objective of the present work is to identify parameter sets that have the highest accuracy for identifying protein-small molecule complexes within 0.5 Å RMSD of native. Accordingly, accuracies of the eight evaluated parameter sets have been plotted in Figure 1 as a function of cutoff length.
Fig 1.
Accuracies of the eight evaluated parameter sets for the protein-small molecule test set. ‘Accurate’ discrimination was defined as the lowest scoring protein-small molecule conformation having an RMSD of less than 0.5 Å from the native conformation. The native conformations were included in the accuracy calculation. The radial distribution function with mean reference state, reduced composition, and 6Å cutoff (r·m·r·6) is the most accurate parameter set for protein-small molecule interactions.
The radial distribution function with mean reference state, reduced composition, and 6 Å cutoff (r·m·r·6) is the most accurate parameter set for protein-small molecule interactions, narrowly outperforming the normalized frequency form. For each parameter set, the general trend is for accuracy to decrease at cutoff lengths beyond 6 Å. At the shorter cutoff lengths of 4 to 6 Å, the next best performing sets consist of cumulative reference states and complete compositions. This is closely followed by cumulative reference states and reduced compositions. The parameter sets consisting of mean reference states and complete compositions have very poor accuracy, as an averaging over all atom type pairs, including those not present in the biomolecular complex being evaluated, substantially reduces discriminatory ability.
Comparison to alternative discriminatory functions
The success rates of the r·m·r·6 discriminatory function for several RMSD criteria are compared to other published discriminatory functions in Table 2. Interestingly, less than half of the discriminatory functions perform better than simple steric complementarity with the Lennard-Jones potential. The r·m·r·6 function outperforms these other functions, with DrugScoreCSD coming in close behind. The major difference between these two functions is that the reduced reference state composition of the r·m·r·6 function includes only the atom type pairs present in the given intermolecular complex, whereas the DrugScoreCSD composition includes C, H, O, S, P, N, F, Cl, Br, I, Ca, Fe, and Zn atoms regardless of the atom types present in the complex being evaluated [3].
Table 2.
Protein-Small molecules discriminatory success ratesa
| Function | success rate (%) |
||||
|---|---|---|---|---|---|
| RMSD 0.0 Å | RMSD ≤0.5 Å | RMSD ≤1.0 Å | RMSD ≤1.5 Å | RMSD ≤2.0 Å | |
| r·m·r·6 | 80 | 85 | 87 | 89 | 92 |
| DrugScoreCSD | 77 | 82 | 83 | 85 | 87 |
| ITScore | 64b | 67b | 72 | 79 | 82 |
| Cerius2/PLP | 52 | 58 | 63 | 69 | 76 |
| Cerius2/LigScore | 48 | 58 | 64 | 68 | 74 |
| SYBYL/F-Score | 38 | 47 | 56 | 66 | 74 |
| DrugScorePDB | 49 | 58 | 63 | 68 | 72 |
| Lennard-Jones | 57 | 61 | 65 | 66 | 68 |
| Cerius2/LUDI | 23 | 33 | 43 | 55 | 67 |
| X-Score | 25 | 33 | 40 | 54 | 65 |
| AutoDock | 8 | 19 | 34 | 52 | 62 |
| DFIRE | - | - | 37 | 52 | 58 |
| DOCK/FF | n/ab,c | 18b | 37 | 47 | 58 |
| Cerius2/PMF | 32 | 35 | 40 | 46 | 52 |
| SYBYL/G-Score | 13 | 15 | 24 | 32 | 42 |
| SYBYL/ChemScore | 7 | 8 | 12 | 26 | 35 |
| SYBYL/D-Score | 3 | 3 | 8 | 16 | 26 |
The success rate at each RMSD criterion is the percentage of all protein-small molecule complexes with the best (i.e., lowest) scoring complex having an RMSD to the native conformation within the allowed deviation. The RMSD ≤0.5Å column corresponds to the definition of ‘accurate’ discrimination used in Figure 1.
Huang, S. Personal communication. 15 Feb 2008.
The success rate for DOCK/FF at RMSD 0.0Å is not available as the minimization in DOCK changes the small-molecule position prior to scoring. The r·m·r function outperforms all other functions at distinguishing native and near-native biomolecular interactions from incorrect conformations.
Rationale for improved accuracy of the r·m·r function
Distribution function
The radial distribution functions are generally more accurate than their normalized frequency counterparts, presumably due to the subtle effect of radial increase in shell volume on observed distribution frequencies and accompanying scores.
Reference state
Applying a mean reference state averaged over all unique atom type pairs, rather than a cumulative reference state, accounts for the possibility of differing relative quantities of atom types between the observed distance distributions in the chosen database versus the biomolecular interactions being evaluated, as this can significantly effect the magnitudes of calculated interatomic pair potentials. With a mean reference state, equal weighting is attributed to each interatomic distance distribution regardless of varying atom type occurrences in the distribution set source data. However, this may result in an ineffective potential, as seen with the combination of mean reference state and complete composition, if too many atom type pairs are included in the derivation.
Composition
With the present discriminatory function formulation, native and near-native complexes are identified by finding the most probable atom types from those available in one molecule to be positioned at favorable distances from interacting atoms of another molecule. Consequently, establishing a reference state from a reduced composition improves discriminatory accuracy by focusing solely on those atom type pair interactions that are possible between the given molecular pair. For example, if an intermolecular sp3 carbon and sp2 nitrogen interaction is scored at a distance bin where an sp3 oxygen and sp2 nitrogen pair has a very high occurrence, but sp3 oxygen is not present in either molecule, then the sp3 oxygen distributions should not be included in the reference state and effect the scores for atom types being evaluated at this position.
Discriminatory power of protein-small molecule interactions
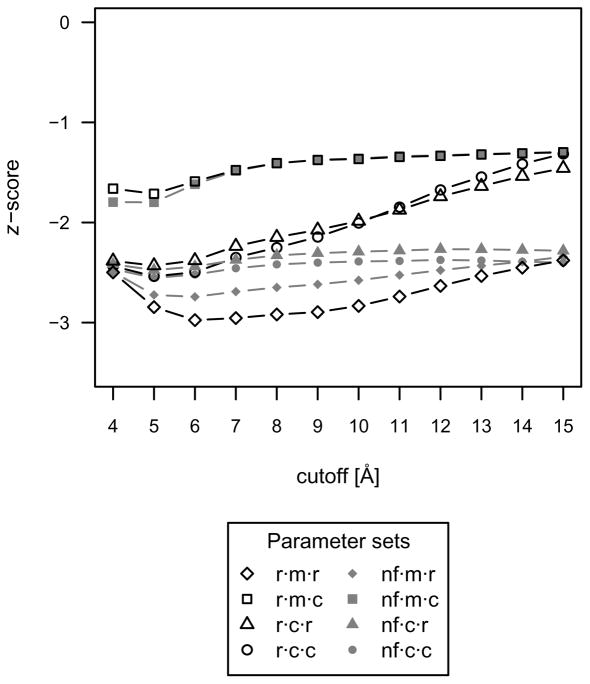
Accurate discrimination should be accompanied by a reduction and funneling of the score as near-native interactions approach the native conformation. Accordingly, the same parameter set should yield both the highest accuracy and best (i.e., lowest) z-score. The mean native z-score over all protein-small molecule complexes is shown in Figure 2 for each evaluated parameter set. The parameter set with the lowest average z-score was the r·m·r·6 function, coinciding with the superior accuracy performance of this parameter set.
Fig 2.
The mean native z-score over all protein-small molecule complexes used as a measure of discriminatory power for each parameter set. The parameter set with the lowest average z-score was the r·m·r·6 function, coinciding with the superior accuracy performance of this parameter set.
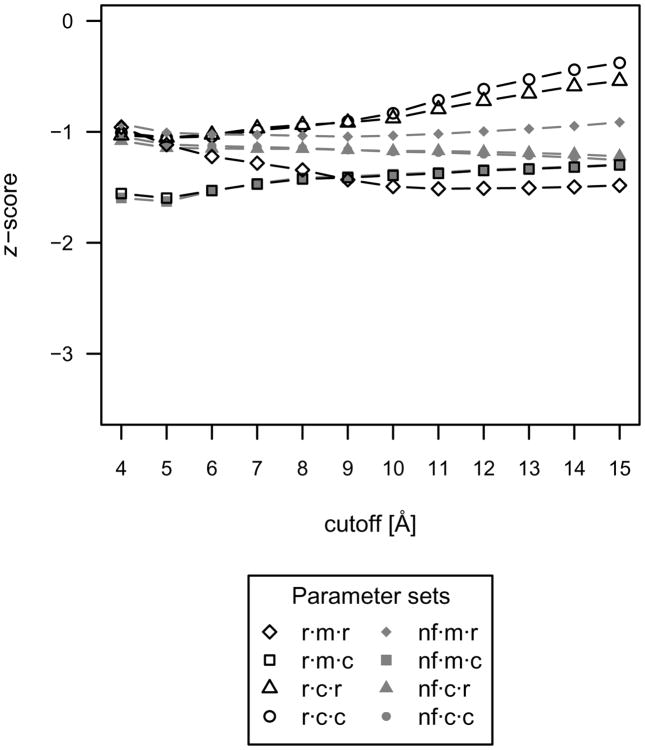
Additionally, the mean z-scores were calculated for the nearest-native complex (ranging from 0.12 to 2.63 Å) to investigate the extent to which native-like protein-small molecule scores are distinguishable from all other decoy complexes in a realistic blind docking experiment, where the native conformation is unknown. These mean nearest-native z-scores are plotted in Figure 3. When the native complex is excluded from the discriminatory power analysis, the lowest mean nearest-native z-score with accompanying high accuracy is achieved with the r·m·r·12 function. However, the accuracy at this cutoff is slightly lower than the r·m·r·6 function, indicating that near native scores may be undesirably more favorable than native scores. Therefore, initial scoring with a 12 Å cutoff, followed by more accurate evaluation around low scoring clusters with a 6 Å cutoff, may be preferable for protein-small molecule interactions when the native conformation is unknown.
Fig 3.
The mean nearest-native z-score, excluding the native complex, over all protein-small molecule complexes used as a measure of discriminatory power for each parameter set. This figure suggests that scoring with the r·m·r parameter set and a combination of 6 and 12Å cutoffs is preferable for protein-small molecule interactions when the native complex is unknown.
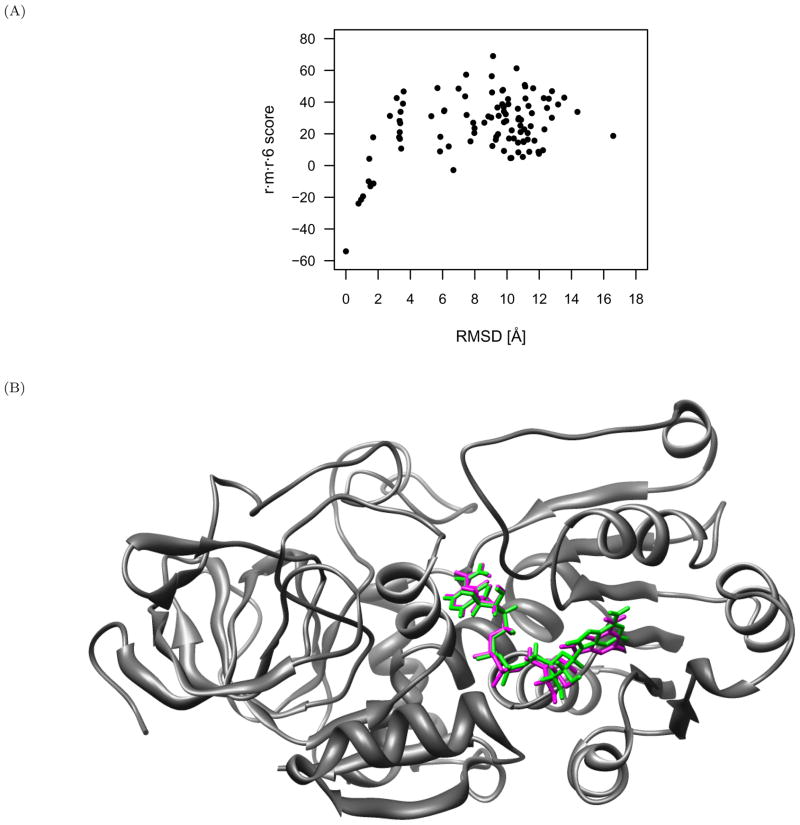
As an example of the score reduction and funneling as near-native interactions approach the native conformation, the r·m·r·6 scores are plotted in Figure 4 as a function of RMSD for PDB identifier 1adb (alcohol dehydrogenase) with z-score of −4.5.
Fig 4.
Successful scoring of alcohol dehydrogenase (PDB identifier 1adb) protein-small molecule complex with the r·m·r·6 function. (A) The scores of the decoys reduce and funnel towards the native complex. The native z-score for this complex is −4.5. (B) Alcohol dehydrogenase protein structure (gray) in complex with the native (green) and nearest-native (magenta) small molecule conformations, both of which score the best amongst all other decoys with the r·m·r·6 function. These conformations are 0.78Å RMSD from each other, and the conformation closest to native would have been identified in a blind docking experiment.
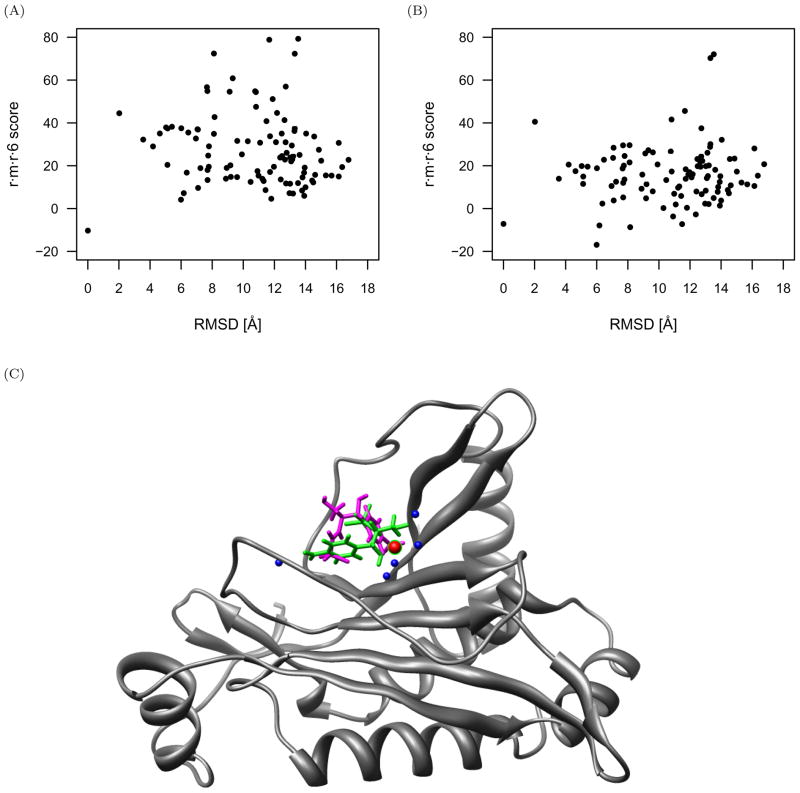
Alternatively, to illustrate the importance of water molecules in the evaluation of protein-small molecule interactions, scores for PDB identifier 1cla (chloramphenicol acetyltransferase) are plotted in Figure 5 as a function of RMSD. With the inclusion of experimental water molecules, the native score is reduced and is successfully identified amongst all other decoys (Figure 5a). When experimental water molecules are excluded from the complex, a non-native decoy is scored more favorably than the native conformation (Figure 5b). The interactions between the protein and small molecule are mediated by water molecules (Figure 5c), which were removed from all experimental complexes during test set generation but should be considered in the evaluation of biomolecular interactions.
Fig 5.
An example illustrating the importance of water in evaluating the chloramphenicol acetyltransferase (PDB identifier 1cla) protein-small molecule complex with the r·m·r·6 function. (A) With the inclusion of experimental water molecules, the native complex is identified as the water mediated interactions between protein and small molecule contribute to this complex having the most favorable score. (B)When experimental water molecules are excluded from the complex, several incorrect conformations, including the best scoring complex at 6 Å RMSD from native, have lower scores than the native complex. With the exclusion of water, this would be an inaccurate prediction in a blind docking experiment. (C) The interactions between the protein (gray) and small molecule are mediated by water molecules (five blue and one red sphere), which were removed from all experimental complexes during test set generation. With the inclusion of these experimental water molecules, the native conformation (green) is successfully identified from all other decoys as the waters mediate hydrogen bonds between the protein and small molecule, and the red colored water sphere sterically prohibits the incorrect decoy conformation (magenta) from being experimentally preferable. The protein binding site is identified with and without the experimental waters.
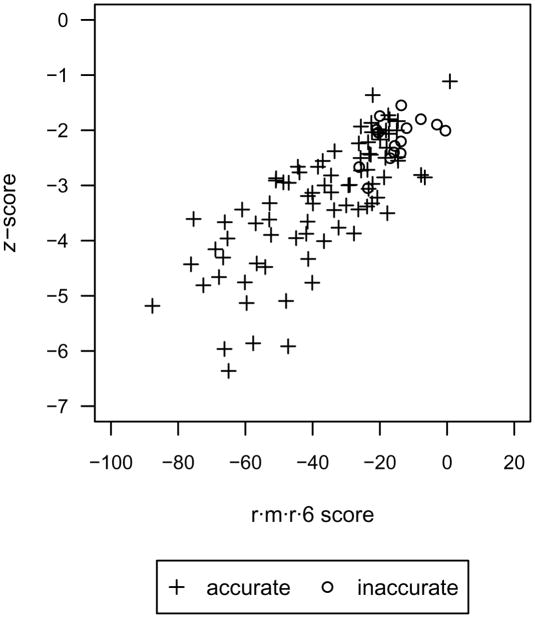
Ideally, the distribution of score and z-score magnitudes would be indicative of whether native and near-native complexes have been successfully identified. For example, Figure 6 shows the score of the lowest scoring complex for each protein-small molecule pair, including native and non-native decoys, with respect to the z-score for each complex. While there is not a complete distinction between the accurate and inaccurate protein-small molecule pairs, the inaccurate pairs are clustered at the region of highest scores and z-scores. This may serve as a guide for confidence in protein-small molecule scoring when the native conformation is unknown.
Fig 6.
The r·m·r·6 score of the lowest scoring complex for each protein-small molecule pair, including native and non-native decoys, with respect to the z-score for accurately and inaccurately scored pairs. The inaccurately scored pairs are clustered at the region of highest scores and z-scores.
Conformational sampling requirements for protein-small molecule interactions
In an actual blind docking experiment, the native conformation is unknown and the discriminatory function should be able to identify near-native interactions as the decoy conformations are more native-like. Consequently, the conformational sampling requirements can be guided by the discriminatory ability of the function with the exclusion of native conformations from the test set. To evaluate the conformational sampling requirements of the r·m·r·6 discriminatory function, ‘near-native accuracy’ was defined as the best scoring decoy being within 0.5 Å RMSD of the native conformation (due to uncertainty in experimentally determined atomic coordinates) or the best scoring decoy being closer to the native conformation than all other decoys, indicating that the score is becoming more favorable as the biomolecular complex is sampled closer to native. While these criteria are more stringent than the typical 2Å allowed deviation to be considered near-native, this is helpful to set conformational sampling parameters for accurate identification of more native-like conformations.
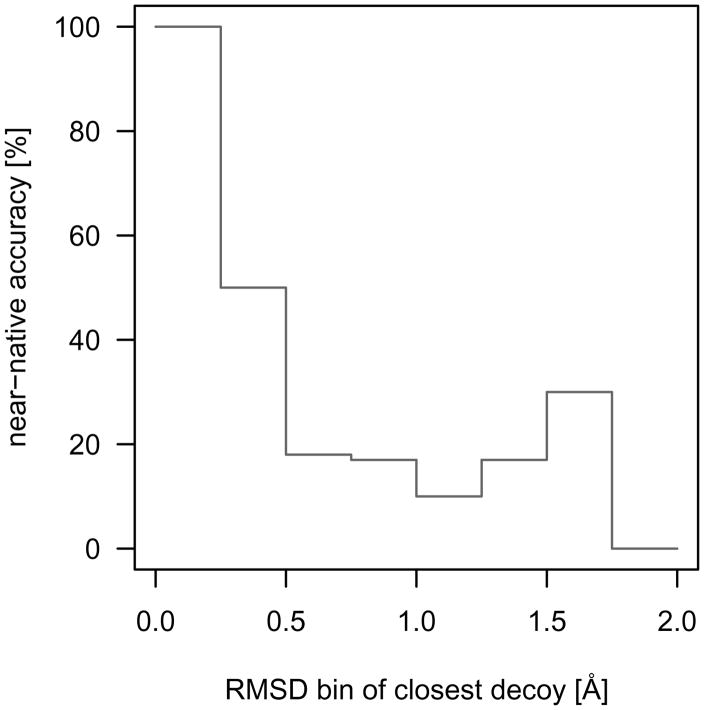
As shown in Figure 7, sampling within 0.25 Å RMSD of native allows for accurate near-native decoy discrimination. The near-native accuracy quickly drops to 50 % when the nearest decoy is between 0.25 Å and 0.5 Å RMSD to native. The drop in near-native accuracy at this distance range is due to large discrete conformational sampling step sizes combined with uncertainty in experimentally determined atomic coordinates leading to a higher probability that the evaluated binding mode is outside of the near-native scoring funnel. More specifically, if the experimentally determined atomic coordinates have an uncertainty of 0.5 Å RMSD and the evaluated decoy is another 0.25 to 0.5 Å RMSD from this position, then the resulting decoy may be up to 1 Å RMSD away from the true experimental conformation and the discriminatory function may not identify this distant nearest-native decoy. The continued drop in near-native accuracy indicates that, while the discriminatory accuracy and power of native complexes are strong for the present function, conformations should be sampled within 0.25 Å of native for blind protein-small molecule interactions to be evaluated within the near-native scoring funnel. This can be accomplished, for example, by conducting a coarse grain search using a discriminatory function with softer interatomic pair potentials followed by more thorough sampling and evaluation around low scoring clusters with the present function. Alternatively, highly focused searches can be conducted near known or predicted binding sites selected by methods such as MFS [24] and Q-SiteFinder [25].
Fig 7.
Protein-small molecule conformational sampling requirements of the r·m·r·6 discriminatory function. The ‘near-native accuracy’ was defined as the best scoring decoy being within 0.5Å RMSD of the native conformation (due to uncertainty in experimentally determined atomic coordinates) or the best scoring decoy being closer to the native conformation than all other decoys, indicating that the score is becoming more favorable as the biomolecular complex is sampled closer to native. Sampling within 0.25Å RMSD of native allows the most accurate near-native decoy discrimination for the evaluated protein-small molecule test set.
Evaluation of protein-DNA interactions
The protein-DNA test set was used to evaluate the effect of distribution set source data from the CSD and the PDB on discriminatory ability. Additionally, this test set was independently chosen to evaluate parameter selection on multiple types of molecular interactions (i.e., protein-small molecule and protein-DNA). Discriminatory accuracy and power were used to address these issues.
Accuracy of protein-DNA interactions
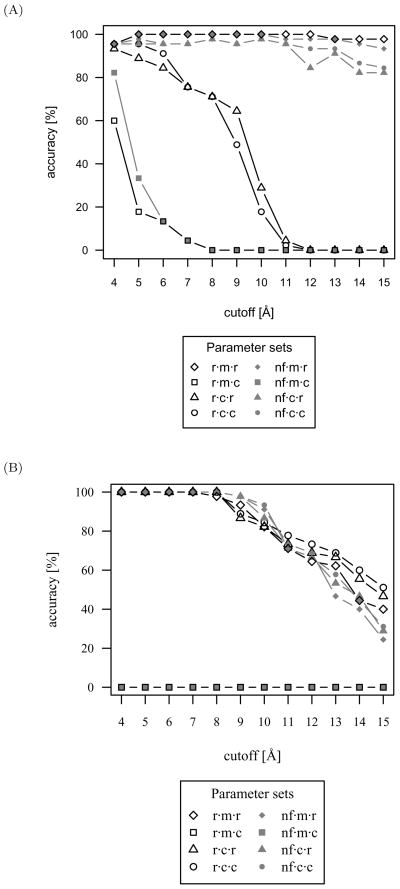
Accuracies of the eight evaluated parameter sets are plotted in Figure 8 for the CSD and PDB distribution sets. The most accurate discrimination for the PDB distribution set occurs from 4 to 8 Å, with a wider range of high accuracy cutoffs for the CSD distribution set from 4 to 12 Å. The high accuracy at 4 Å cutoff is a result of the test set generation method. Unlike AutoDock decoy generation for the protein-small molecule test set, the FTDock decoy generation for protein-DNA interactions allows for moderate steric atomic clashes. Consequently, at 4 Å cutoff the shape complementarity of the native complex is readily identified amongst the remaining non-native decoys for nearly all parameter sets. The optimal cutoff varies among parameter sets at longer lengths, and so the high accuracy at 12 Å can be attributed to fundamental geometric and chemical properties of protein-DNA interactions being well characterized by interatomic pair potentials of the r·m·r parameter set with the CSD distribution set.
Fig 8.
Accuracies of the eight evaluated parameter sets for the protein-DNA test set. ‘Accurate’ discrimination was defined as the lowest scoring protein-DNA conformation having an RMSD of less than 0.5Å from the native conformation. The native conformations were included in the accuracy calculation. (A) With scores derived from the CSD distribution set. The radial distribution function with mean reference state, reduced composition, and 12 Å cutoff (r·m·r·12) is the most accurate parameter set for protein-DNA interactions. (B) With scores derived from the PDB distribution set. The PDB distribution set does not perform as well as that of the CSD for reference state derivation.
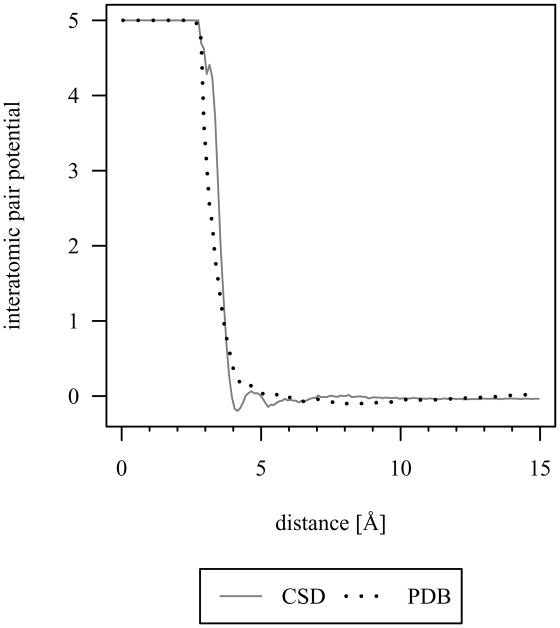
At longer cutoff lengths, the CSD distribution set has higher discriminatory accuracy than the PDB distribution set. The improved performance of CSD over PDB distribution sets has been previously discussed for protein-small molecule interactions [3]. The authors have attributed the performance to the uncertainties in atomic coordinates being lower in the CSD, showing steeper pair potential wells and better defined higher order minima. The same rationale is applicable here to protein-DNA interactions as similar characteristics are evident, for example, in Figure 9 for the hydrophobic sp3 carbon-carbon interatomic pair potential. Additionally, the interatomic pair potential converges closer to zero at longer cutoff lengths for the CSD distribution set, which is an important feature for a discriminatory function. Based on discrimination accuracy, the CSD distribution set is preferred over the PDB distribution set for reference state derivation.
Fig 9.
Interatomic pair potential for sp3 carbon-carbon with the r·m·r parameter set. The lower uncertainties in atomic coordinates in the CSD leads to steeper pair potential wells, better defined higher order minima, and more stable convergence to zero at longer cutoff lengths.
Discriminatory power of protein-DNA interactions
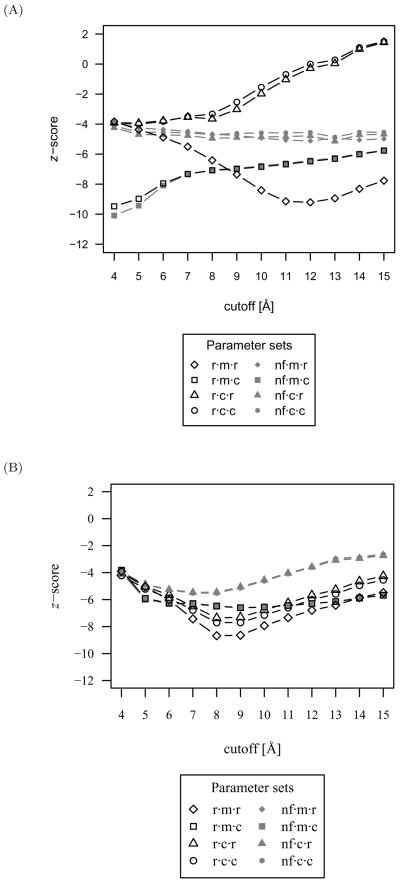
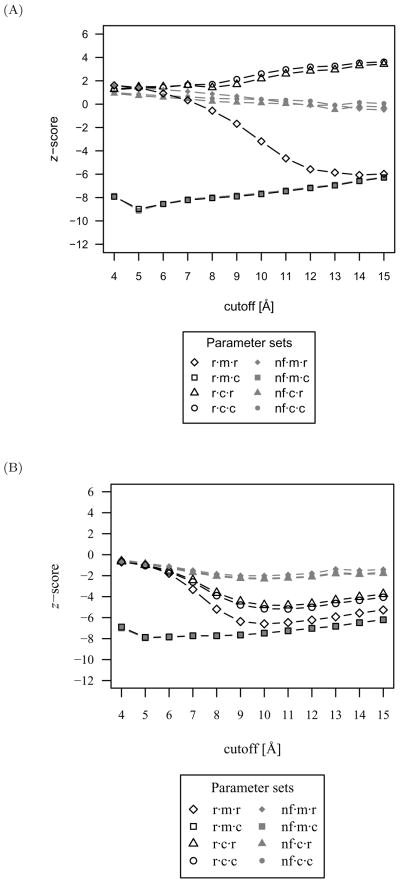
Due to the high accuracy of several parameter sets, the z-score is used to assist in parameter set selection. The mean native z-scores over all protein-DNA complexes scored with the CSD and PDB distribution sets are shown in Figure 10 for each evaluated parameter set. Similarly, the mean z-scores were calculated for the nearest-native complex (ranging from 0.50 to 1.44 Å) to investigate the extent to which native-like protein-DNA scores are distinguishable in a blind docking experiment from all other decoy complexes. These mean nearest-native z-scores are plotted in Figure 11 for the CSD and PDB distribution sets.
Fig 10.
The mean native z-score over all protein-DNA complexes as a measure of the discriminatory power for each parameter set. (A) With scores derived from the CSD distribution set. Due to the high accuracy of several parameter sets, the z-score is used to assist in parameter set selection. The parameter set with the lowest average native z-score accompanied by the highest accuracy was the r·m·r·12 function with the CSD distribution set. (B) With scores derived from the PDB distribution set. The discriminatory power of the PDB distribution set is inferior to that attained with the CSD distribution set.
Fig 11.
The mean nearest-native z-score, excluding the native complex, over all protein-DNA complexes as a measure of the discriminatory power for each parameter set. (A) With scores derived from the CSD distribution set. While the lowest mean nearest-native z-score with accompanying high accuracy is achieved with the r·m·r·14 function, a combination of highest accuracy and lowest z-score is attained with the r·m·r·12 function and CSD distribution set and is therefore preferable for discrimination of protein-DNA interactions. (B) With scores derived from the PDB distribution set. The discriminatory power of the PDB distribution set is inferior to that attained with the CSD distribution set.
While short cutoffs demonstrated high accuracy, equivalent accuracies and accompanying lower z-scores were primarily achieved at longer cutoffs. The exception is parameter sets consisting of mean reference states and complete compositions, which have the most favorable z-scores, yet have very poor accuracy performance at all cutoff lengths. The parameter set with the lowest average native z-score accompanied by the highest accuracy was the r·m·r·12 function with the CSD distribution set. This is in agreement with the superior protein-small molecule discriminatory performance of the r·m·r·6 parameter set, differing only in cutoff length. As with accuracy, the discriminatory power of the CSD distribution set with lower z-scores is better than that attained with the PDB distribution set.
When the native complex is excluded from the discriminatory power analysis, the lowest mean nearest-native z-score with accompanying high accuracy is achieved with the r·m·r·14 function and the CSD distribution set. However, the accuracy at this cutoff is slightly lower than the r·m·r·12 function, indicating that near native scores may be undesirably more favorable than native scores. The r·m·r·12 function with the CSD distribution set is therefore preferable for discrimination of protein-DNA interactions.
Conformational sampling requirements for protein-DNA interactions
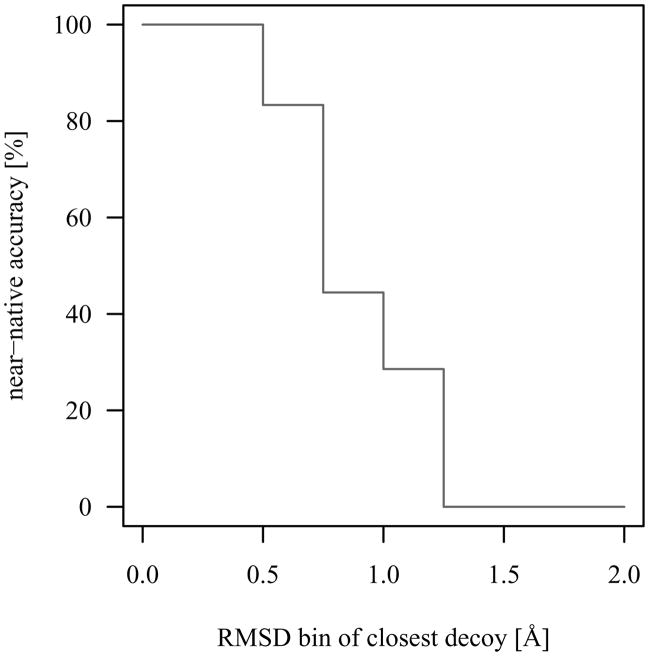
In an actual blind docking experiment, the native conformation is unknown and the discriminatory function should be able to identify decoys as they are more native-like. Therefore, to evaluate the conformational sampling requirements of the r·m·r·12 discriminatory function with the CSD distribution set in the case where the native conformation is unknown, ‘near-native accuracy’ was defined as the best scoring decoy being within 0.5 Å RMSD of the native conformation (due to uncertainty in experimentally determined atomic coordinates) or the best scoring decoy being closer to the native conformation than all other decoys, indicating that the score is becoming more favorable as the biomolecular complex is sampled closer to native.
As shown in Figure 12, sampling within 0.5 Å RMSD of native allows for accurate near-native decoy discrimination. The near-native accuracy is reduced to 83 % when the nearest decoy is between 0.5 Å and 0.75 Å RMSD to native. The continued drop is indicative that conformations should be sampled within 0.5 Å of native for blind protein-DNA scoring. This can be accomplished, for example, by using smaller translation and rotation step sizes in fast Fourier transform (FFT) docking protocols [23, 26, 27], accompanied by more thorough sampling around low scoring clusters. The conformational sampling requirements for protein-DNA interactions are less stringent than for protein-small molecule interactions (0.5 Å versus 0.25 Å, respectively), presumably due to the larger and symmetric helical binding interface of protein-DNA complexes allowing for near-native conformations to be more readily identified.
Fig 12.
Protein-DNA conformational sampling requirements of the r·m·r·12 discriminatory function with the CSD distribution set. The ‘near-native accuracy’ was defined as the best scoring decoy being within 0.5Å RMSD of the native conformation (due to uncertainty in experimentally determined atomic coordinates) or the best scoring decoy being closer to the native conformation than all other decoys, indicating that the score is becoming more favorable as the biomolecular is sampled closer to native. Sampling within 0.5 Å RMSD of native allows the most accurate near-native decoy discrimination for the evaluated protein-DNA test set.
Comparison to an alternative discriminatory function
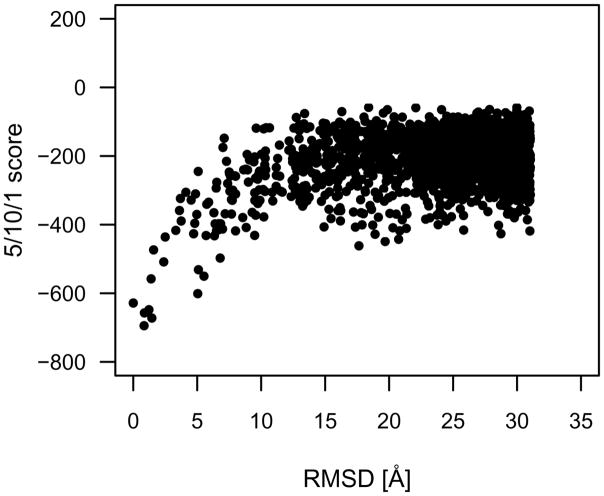
The discriminatory performance of the r·m·r·12 function can be compared to the best performing 5/10/1 all-atom discriminatory function of [4]. The key differences are that the 5/10/1 function used a bin size Δr of 1 Å, scored all intermolecular heavy atom pairs located at distances r within the range of 5 < r < 10 Å, and used the PDB for distribution set source data, whereas the r·m·r·12 function used a bin size Δr of 0.1 Å, scored all intermolecular heavy atom pairs located at distances r within the range of 0 < r ≤ 12 Å, and evaluated both the PDB and CSD for distribution set source data.
The accuracy of the 5/10/1 function was 17.8 %, whereas that of the r·m·r·12 function was 100 % with the CSD distribution set. While the accuracy of the 5/10/1 function is substantially lower, 82.2 % of the lowest scoring decoy complexes (i.e., excluding native) were within 2 Å RMSD of native. For the r ·m·r·12 function, only 46.7 % of the lowest scoring decoy complexes were within 2 Å RMSD of native with the CSD distribution set, and 55.6 % with the PDB distribution set.
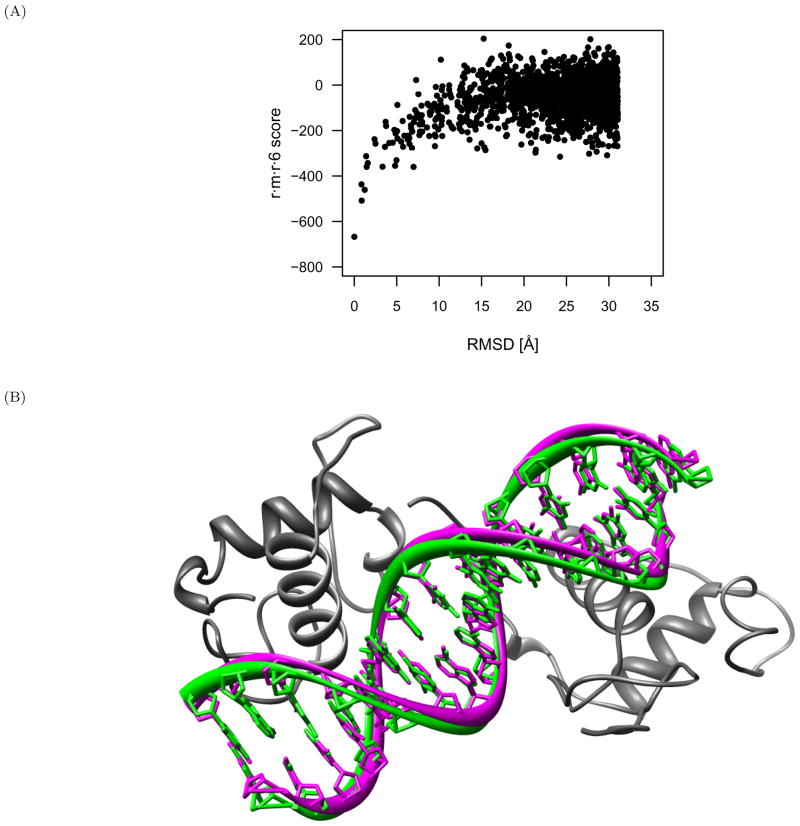
In the analysis conducted by [4], only the top 2000 FTDock scored decoys were considered. The average native z-score for the 5/10/1 function was −6.8, whereas that of the r·m·r·12 function was −8.0 (−9.2 for all 10000 decoys). These z-scores are indicative of the native conformations having substantially more favorable scores than the decoy conformations. While the 5/10/1 function does generate lower scores for native and near-native complexes with respect to non-native decoys, it usually does not identify the native experimental structure. However, identification of the lowest scoring decoy conformation within 2 Å of native for 82.2 % of the protein-DNA complexes combined with an average native z-score of −6.8 is indicative of broad funneling of the 5/10/1 function. This is exemplified in Figures 13 and 14 with PDB identifier 1dsz (RXR-RAR DNA-binding complex). For the 5/10/1 discriminatory function (Figure 13) there is a wider funnel towards native, with scores reducing from the non-native distribution as far away as 7 Å until reaching a minimum score at 0.84 Å RMSD from native. Conversely, the r ·m·r·12 discriminatory function (Figure 14) has a narrower funnel at approximately 1 Å that continues to drop in score as the native conformation is approached. The broader funneling of the 5/10/1 function can be attributed to the larger 1 Å bin size and the less defined pair potential wells of the PDB distribution set. Broader near-native funneling, as accomplished with the 5/10/1 function, is preferable for initial stage scoring to identify favorable clusters of coarsely sampled conformations, with the r·m·r·12 function being subsequently applied for finely sampled near-native scoring.
Fig 13.
RMSD versus score for the RXR-RAR DNA-binding complex (PDB identifier 1dsz) with the 5/10/1 protein-DNA discriminatory function [4]. For the 5/10/1 discriminatory function there is a wide funnel towards native, with scores reducing from the non-native distribution as far away as 7Å until reaching a minimum score at 0.84 Å RMSD from native. The broader near-native funneling of the 5/10/1 function can be attributed to the larger 1 Å bin size and the less defined pair potential wells of the PDB distribution set.
Fig 14.
Scoring the RXR-RAR DNA-binding complex (PDB identifier 1dsz) with the r·m·r·12 discriminatory function and CSD distribution set. (A) The r·m·r·12 discriminatory function has a narrow scoring funnel at approximately 1 Å that continues to drop in score as the native conformation is approached. (B)The protein structure (gray) in complex with the native (green) and nearest-native (magenta) DNA conformations, both of which score the best amongst all other decoys with the r·m·r·12 function. The two conformations are 0.84 Å RMSD from each other, and the nearest-native one would have been identified in a blind docking experiment.
Summary and Conclusions
Several established and novel discriminatory function formulations and reference state derivations have been evaluated to identify parameter sets capable of distinguishing native and near-native biomolecular interactions from incorrect decoys. The radial distribution function with mean reference state and reduced composition (r·m·r) had the best combination of discriminatory accuracy and power for protein-small molecule and protein-DNA interactions, regardless of whether the native complex was included or excluded from the test set. The superior performance of the r·m·r parameter set for both protein-small molecule and protein-DNA interactions was indication that the function was not over-optimized through back-testing on a single class of biomolecular interactions. The only parameter to be modified and evaluated for different classes of biomolecular interactions is the cutoff length.
The conformational sampling requirements for blind evaluation of biomolecular interactions was guided by the discriminatory ability of the r·m·r parameter set with the exclusion of native conformations from the test sets. Due to the narrow funneling and score reduction as the native complex is approached, conformations should be sampled within 0.25 Å of native for small molecules and 0.5 Å of native for DNA to achieve accurate discrimination. This can be achieved by initial stage scoring to identify favorable clusters of coarsely sampled conformations, with the r·m·r parameter set being subsequently applied for finely sampled near-native scoring.
The improved performance of CSD over PDB distribution sets, discussed previously for protein-small molecule interactions [3], was shown to be applicable to protein-DNA interactions as well. This improved performance can be attributed to the lower uncertainties in atomic coordinates in the CSD leading to steeper pair potential wells, better defined higher order minima, and the interatomic pair potential converging to zero at longer cutoff lengths.
Naturally, the discriminatory performance is related to the extent to which the distribution set accurately represents the probability of observing a distance r for each intermolecular pair ij of atom types ab in a correct binding mode C. The novel ‘reduced reference state’ was created to more accurately represent these probabilities for any given biomolecular complex. The initial success of this reference state implies that further improvements are possible by deriving probabilities from subsets of the CSD, using structures that consist of only the atom types to be considered for the given biomolecular interaction. If an atom type is not present in the complex, then the intermolecular distance distributions of CSD structures containing this atom type should not be included in the reference state and effect the observed probabilities for the atom types being evaluated.
Availability
The method is available as a web server module at http://protinfo.compbio.washington.edu.
Acknowledgments
The authors thank members of the Samudrala group, especially Gong Cheng, Shyamala Iyer, and Michal Guerquin for helpful discussions. The authors also thank Liz Potterton for modifications and assistance with the CCP4 molecular-graphics package. This work was supported in part by NIH grant GM068152, NSF grant DBI-0217241, an NSF CAREER award, a Searle Scholar Award, and the Puget Sound Partners in Global Health.
References
- 1.Kitchen DB, Decornez H, Furr JR, Bajorath J. Docking and scoring in virtual screening for drug discovery: methods and applications. Nat Rev Drug Discov. 2004;3(11):935–949. doi: 10.1038/nrd1549. [DOI] [PubMed] [Google Scholar]
- 2.Samudrala R, Moult J. An all-atom distance-dependent conditional probability discriminatory function for protein structure prediction. J Mol Biol. 1998;275(5):895–916. doi: 10.1006/jmbi.1997.1479. [DOI] [PubMed] [Google Scholar]
- 3.Velec HF, Gohlke H, Klebe G. DrugScore(CSD)-Knowledge-Based Scoring Function Derived from Small Molecule Crystal Data with Superior Recognition Rate of Near-Native Ligand Poses and Better Affinity Prediction. J Med Chem. 2005;48(20):6296–6303. doi: 10.1021/jm050436v. [DOI] [PubMed] [Google Scholar]
- 4.Robertson TA, Varani G. An all-atom, distance-dependent scoring function for the prediction of protein-DNA interactions from structure. Proteins. 2007;66(2):359–374. doi: 10.1002/prot.21162. [DOI] [PubMed] [Google Scholar]
- 5.Huang SY, Zou X. An iterative knowledge-based scoring function for protein-protein recognition. Proteins. 2008;72(2):557–579. doi: 10.1002/prot.21949. [DOI] [PubMed] [Google Scholar]
- 6.Sippl MJ. Calculation of conformational ensembles from potentials of mean force. An approach to the knowledge-based prediction of local structures in globular proteins. J Mol Biol. 1990;213(4):859–883. doi: 10.1016/s0022-2836(05)80269-4. [DOI] [PubMed] [Google Scholar]
- 7.Sippl MJ. Boltzmann’s principle, knowledge-based mean fields and protein folding. An approach to the computational determination of protein structures. J Comput Aided Mol Des. 1993;7(4):473–501. doi: 10.1007/BF02337562. [DOI] [PubMed] [Google Scholar]
- 8.Chandler D. Introduction to Modern Statistical Mechanics. Oxford University Press; USA: 1987. [Google Scholar]
- 9.Allen FH. The Cambridge Structural Database: a quarter of a million crystal structures and rising. Acta Crystallogr B. 2002;58(3 Part 1):380–388. doi: 10.1107/s0108768102003890. [DOI] [PubMed] [Google Scholar]
- 10.Bruno IJ, Cole JC, Edgington PR, Kessler M, Macrae CF, McCabe P, Pearson J, Taylor R. New software for searching the Cambridge Structural Database and visualizing crystal structures. Acta Crystallogr B. 2002;58(3 Part 1):389–397. doi: 10.1107/s0108768102003324. [DOI] [PubMed] [Google Scholar]
- 11.Potterton L, McNicholas S, Krissinel E, Gruber J, Cowtan K, Emsley P, Murshudov GN, Cohen S, Perrakis A, Noble M. Developments in the CCP4 molecular-graphics project. Acta Crystallogr D. 2004;60(12 Part 1):2288–2294. doi: 10.1107/S0907444904023716. [DOI] [PubMed] [Google Scholar]
- 12.Berman HM, Westbrook J, Feng Z, Gilliland G, Bhat TN, Weissig H, Shindyalov IN, Bourne PE. The Protein Data Bank. Nucl Acids Res. 2000;28(1):235–242. doi: 10.1093/nar/28.1.235. [DOI] [PMC free article] [PubMed] [Google Scholar]
- 13.Meng EC, Lewis RA. Determination of molecular topology and atomic hybridization states from heavy atom coordinates. J Comput Chem. 1991;12(7):891–898. [Google Scholar]
- 14.Pettersen EF, Goddard TD, Huang CC, Couch GS, Greenblatt DM, Meng EC, Ferrin TE. UCSF Chimera–a visualization system for exploratory research and analysis. J Comput Chem. 2004;25(13):1605–1612. doi: 10.1002/jcc.20084. [DOI] [PubMed] [Google Scholar]
- 15.Bondi A. van der Waals Volumes and Radii. J Phys Chem. 1964;68(3):441–451. [Google Scholar]
- 16.Rowland R, Taylor R. Intermolecular nonbonded contact distances in organic crystal structures: Comparison with distances expected from van der Waals radii. J Phys Chem. 1996;100(18):7384–7391. [Google Scholar]
- 17.Zhang J, Wang R. [Accessed 1 February 2008];2007 November 12; [online]〈 http://sw16.im.med.umich.edu/software/xtool/〉.
- 18.Wang R, Lu Y, Wang S. Comparative evaluation of 11 scoring functions for molecular docking. J Med Chem. 2003;46(12):2287–2303. doi: 10.1021/jm0203783. [DOI] [PubMed] [Google Scholar]
- 19.Morris GM, Goodsell DS, Halliday RS, Huey R, Hart WE, Belew RK, Olson AJ. Automated docking using a Lamarckian genetic algorithm and an empirical binding free energy function. J Comput Chem. 1998;19(14):1639–1662. [Google Scholar]
- 20.Zhang C, Liu S, Zhu Q, Zhou Y. A knowledge-based energy function for protein-ligand, protein-protein, and protein-DNA complexes. J Med Chem. 2005;48(7):2325–2335. doi: 10.1021/jm049314d. [DOI] [PubMed] [Google Scholar]
- 21.Huang SY, Zou X. An iterative knowledge-based scoring function to predict protein-ligand interactions: II. Validation of the scoring function. J Comput Chem. 2006;27(15):1876–1882. doi: 10.1002/jcc.20505. [DOI] [PubMed] [Google Scholar]
- 22.Robertson TA, Varani G. [Accessed 5 February 2008];2007 [online]〈 http://depts.washington.edu/varani2/downloads/index.shtml〉.
- 23.Gabb HA, Jackson RM, Sternberg MJ. Modelling protein docking using shape complementarity, electrostatics and biochemical information. J Mol Biol. 1997;272(1):106–120. doi: 10.1006/jmbi.1997.1203. [DOI] [PubMed] [Google Scholar]
- 24.Wang K, Horst JA, Cheng G, Nickle DC, Samudrala R. Protein meta-functional signatures from combining sequence, structure, evolution and amino acid property information. PLoS Comput Biol. 2008;4(9):e1000181. doi: 10.1371/journal.pcbi.1000181. [DOI] [PMC free article] [PubMed] [Google Scholar]
- 25.Laurie ATR, Jackson RM. Q-SiteFinder: an energy-based method for the prediction of protein-ligand binding sites. Bioinformatics. 2005;21(9):1908–1916. doi: 10.1093/bioinformatics/bti315. [DOI] [PubMed] [Google Scholar]
- 26.Kozakov D, Brenke R, Comeau SR, Vajda S. PIPER: an FFT-based protein docking program with pairwise potentials. Proteins. 2006;65(2):392–406. doi: 10.1002/prot.21117. [DOI] [PubMed] [Google Scholar]
- 27.Mintseris J, Pierce B, Wiehe K, Anderson R, Chen R, Weng Z. Integrating statistical pair potentials into protein complex prediction. Proteins. 2007;69(3):511–520. doi: 10.1002/prot.21502. [DOI] [PubMed] [Google Scholar]


