Abstract
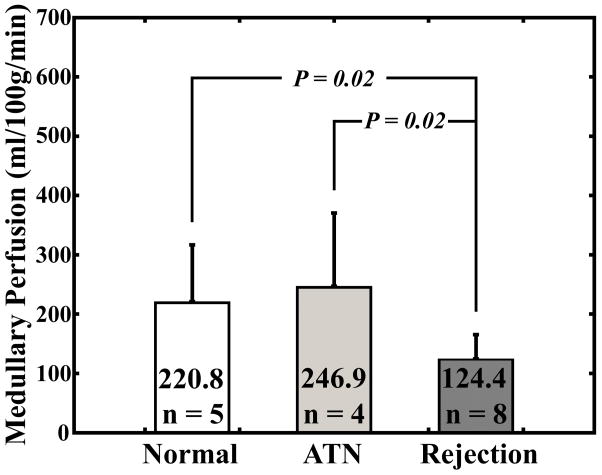
Functional magnetic resonance imaging (fMRI) is a powerful tool for examining kidney function, including organ blood flow and oxygen bioavailability. We have used contrast enhanced perfusion and blood oxygen level dependent (BOLD) MR imaging to assess kidney transplants with normal function, acute tubular necrosis (ATN) and acute rejection. BOLD and MR-perfusion imaging were performed on seventeen subjects with recently transplanted kidneys. There was a significant difference between medullary R2* values in the group with acute rejection (R2*=16.2/s) compared to allografts with ATN (R2*=19.8/s;P=0.047) and normal-functioning allografts (R2*=24.3/s;P=0.0003). There was a significant difference between medullary perfusion measurements in the group with acute rejection (124.4±41.1 ml/100g/min) compared to those in patients with ATN (246.9±123.5 ml/100g/min;P=0.02) and normal-functioning allografts (220.8±95.8 ml/100g/min;P=0.02). This study highlights the utility of combining perfusion and BOLD MR imaging to assess renal function. We have demonstrated a decrease in medullary R2* (decrease deoxyhemoglobin) on BOLD MR imaging and a decrease in medullary blood flow by MR perfusion imaging in those allografts with acute rejection, which indicates an increase in medullary oxygen bioavailability in allografts with rejection, despite a decrease in blood flow.
1. Introduction
Magnetic resonance (MR) imaging is a powerful tool for examining the kidney. MR images depict kidney structure, allowing one to visualize the integrity of the cortex and medulla, kidney size, and any potential renal lesions. MR imaging can map the renal vasculature and diagnose vascular abnormalities, such as renal artery stenosis. More recently the assessment of filtration capacity, organ blood flow and oxygen bioavailability by functional magnetic resonance imaging (fMRI) has become possible [1–3].
Blood flow and oxygen bioavailability are controlled by numerous mechanisms; these mechanisms are different in the cortex and medulla [4–9]. Perfusion and blood oxygen level-dependent (BOLD) MR imaging are able to non-invasively assess the functional changes in blood flow and oxygen bioavailability in the cortex and medulla separately. The ability to separately study cortical versus medullary function is advantageous in understanding normal kidney physiology and the aberrant changes in these parameters that characterize kidney disease in both native and transplanted kidneys [10, 11].
Kidney transplantation has become the preferred method of kidney replacement since the first successful transplant more than 50 years ago [12]. This patient population undergoes close monitoring of their renal function post-transplantation to assess for signs of graft dysfunction. Detecting and treating the cause of dysfunction early prevents unnecessary nephron loss that can lead to permanent graft failure. Furthermore, disease pathophysiology in a kidney transplant may be different than in a native kidney [13, 14]. Therefore, transplant-specific tools to understand and monitor progressive changes in allograft function would be valuable.
Functional MR imaging has been used by investigators to study the native kidney under physiologic and pharmacologic stresses [15–34]. Few investigators have used functional MR imaging to study the transplanted kidney [15, 19, 28, 32, 33]. To date, there have been no reports of combining perfusion and BOLD MR imaging to non-invasively assess renal blood flow and oxygen bioavailability in a single exam. The goal of this research was to determine the feasibility of assessing differences in kidney transplants with normal function, acute tubular necrosis (ATN) and acute rejection using BOLD and perfusion MR imaging during a single exam and to correlate these fMRI parameters with laboratory and pathology evaluation.
2. Material and Methods
2.1 Subjects
This HIPAA compliant study was approved by our institutional human subjects review committee and written informed consent was obtained from all subjects. We prospectively evaluated 21 subjects with recently transplanted kidneys in a consecutive fashion as they presented to transplant clinic for their routine clinical visit, between June 2003 and September 2004. All subjects less than four months post-transplantation were eligible for the study if their transplanted kidney was functioning normally or if the subjects had evidence of allograft dysfunction for which they would be undergoing a biopsy for clinically suspected acute rejection or ATN. Normal function and graft dysfunction were determined by the clinical transplant nephrologist. Those allografts with dysfunction caused by cyclosporine toxicity, infection, vascular compromise, and ureteral obstruction as determined by clinical, laboratory and imaging testing were excluded from the study.
The indications for clinical biopsy early after transplantation included an increasing serum creatinine or β2-microglobulin level in the absence of other causes of transplant dysfunction. Two 18-gauge biopsy cores were taken under ultrasound guidance at the time of biopsy by the transplant nephrologist. One 18-gauge core was used entirely for histological assessment. Half of the second core was paraffin-embedded for immunohistochemistry. The other half of the second core was stored at −70°C for additional mRNA studies. C4d immunostaining was performed on each sample as per the standard of care at our institution.
All subjects who underwent BOLD and perfusion MR imaging did so within 48 hours after their biopsy. Biopsy results were not provided beforehand to the individuals analyzing the BOLD and perfusion MR data.
All subjects refrained from water or intravenous fluid intake for four hours prior to the MR imaging/exam. The total exam time was between 45–60 minutes, which included setup, scout, BOLD, and perfusion MR image acquisitions.
2.2 MR Examination
Imaging was performed on a 1.5 T MRI system (Signa Excite, GE Healthcare, Waukesha, WI, USA) using a four-element phased array torso coil. BOLD MR imaging was performed using a T2*-weighted multi-gradient-recalled-echo sequence using 16 echoes, three slices with a 1 mm gap between each slice, and a 5 mm slice thickness in the coronal plane through the kidney. The following parameters were used for the BOLD acquisition: TR/TE/flip = 87ms/7–41.8ms/40°, BW = 62.5 kHz, FOV = 32–34 cm, and 256 × 128 matrix. Each slice was acquired during an 11-second breath hold. On all patients a saline bag was placed over the skin where the transplant was located to diminish artifacts caused by the skin/air interface.
Perfusion MR imaging was performed using a T2*-weighted, echo planar sequence applied during an injection of 0.1 mmol/kg gadodiamide contrast agent (Omniscan, GE Healthcare, Princeton, NJ, USA) at a rate of 3cc/s. The total acquisition time was 180 seconds. The subjects held their breath for the first 30 seconds and then were allowed to breathe freely for the remaining perfusion acquisition time. The following parameters were used for the perfusion acquisition: TR/TE/flip = 1000ms/30ms/60°, FOV = 340 × 340 mm, matrix = 128 × 64, slice thickness = 10 mm, and temporal resolution = 1.0 s. Three slices were imaged per transplanted kidney along the long axis of the kidney such that one of the three slices transected the renal artery or the aorta.
2.3 R2* Measurement Analysis
Images acquired using the BOLD MR acquisition were analyzed using FuncTool® (GE Healthcare, Waukesha, WI, USA) by a radiologist with seven years of experience in BOLD MR imaging. Regions of interest (ROIs) were placed in the cortex and medulla in a fashion similar to that previously described, utilizing T1-weighted images and color maps to assist in ROI placement [5]. A total of 6–10 ROIs were placed in the medulla and 6–10 ROIs were placed in the cortex. The number of ROIs per slice depended on how much bowel artifact was present in a specific patient. The mean and standard deviation for both the cortex and medulla were recorded. The means of the cortical and medullary ROIs for a given allograft were used for calculating the group means and for comparing between groups.
2.4 MR Perfusion Calculations
All perfusion MR exams were analyzed using custom scripts written in MATLAB (MATLAB version 7.0, The MathWorks Inc., Cambridge, MA, USA). A medical physicist supervised a research assistant in the performance of the perfusion calculations described in Appendix A. Regions of interest (ROIs) were defined in a proximal major artery (either in the renal artery or in the aorta superior to the branching of the renal arteries). Regions of interest also were placed at various locations within both the renal cortex and the renal medulla. The sizes of the ROIs were on the order of 10 pixels. A total of 4 ROIs were placed in the cortex and 4 ROIs in the medulla. The number of ROIs defined per slice was limited in some patients due to susceptibility-induced artifacts from bowel gas. Placement of the ROIs in the medulla and cortex was aided by examining T1-weighted anatomical images and by rapidly scrolling through the temporal series of perfusion images for each slice location. Renal blood flow (RBF) values were converted to units of mL/min/100g by assuming that the hematocrit level was equal in large and small vessels and that the tissue density was 1.04 g/mL. The mean and standard deviation of each ROI was recorded. The means over the cortical and medullary ROIs for a given allograft were used for calculating the group means and for comparing between groups.
2.5 Statistical Analysis
Medullary R2*, cortical R2*, medullary perfusion, and cortical perfusion measurements were compared between groups of patients with normal functioning allografts, ATN, and acute rejection using a two-sample equal variance Student’s t-test with a significance level set at P = 0.05. Correlation between medullary and cortical perfusion measurements, medullary and cortical R2* measurements, creatinine, and hematocrit were determined using Pearson correlation coefficients and visualized using scatter plots.
3. Results
The patient population consisted of thirteen males and eight females ranging in age from 21 to 70 years. Four subjects were excluded from the final analysis. One subject could not complete the exam due to inability to lie flat for the entire exam. One subject was excluded due to underlying polyomavirus infection discovered after the MR imaging exam had been performed. Two subjects were excluded due to technical failure (incorrect slice placement for measurement of the arterial input function for the perfusion calculations). There were a total of 17 patients in the final analysis.
Average ages, average time between transplant and MR examination, average serum creatinine levels, and average hematocrit are summarized in Table 1 for subjects in each group. There was a significant difference between serum creatinine levels in patients with normal functioning allografts (1.6 ± 0.5 mg/dl) and those with acute rejection (4.2 ± 1.9 mg/dl; P = 0.01). There was no other significant difference in serum creatinine levels between groups. No statistically significant difference was computed between groups for age, time between transplant and MR examination, and hematocrit.
Table 1.
Average age, average time between transplant and magnetic resonance examination, average serum creatinine and average hematocrit for seventeen renal transplant subjects.
| Normal Functioning | Acute Tubular Necrosis | Acute Rejection | |
|---|---|---|---|
| Number of subjects | 5 | 4 | 8 |
| Age (years) | 43 ± 12 | 49 ± 15 | 52 ± 9 |
| Days from transplantation to MRI | 50 ± 43 | 44 ± 38 | 68 ± 34 |
| Creatinine (mg/dl) | 1.6 ± 0.5 | 3.5 ± 2.5 | 4.2 ± 1.9† |
| Hematocrit (%) | 36 ± 7.1 | 32 ± 3.4 | 33 ± 7.5 |
MRI = magnetic resonance imaging
The value marked with a † is statistically significant between the acute rejection and normal functioning groups (p < 0.05).
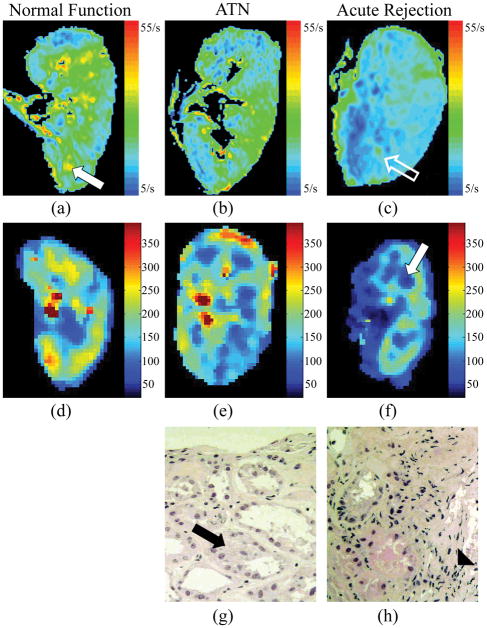
Representative color R2* maps, color perfusion maps and histopathological findings are depicted in allografts with normal function, ATN and acute rejection (Fig. 1). On the color R2* map, blue represents areas of lowest R2* and lowest deoxyhemoglobin, and green, yellow, and orange, respectively, represent increasing R2* values and higher deoxyhemoglobin levels. Visually the R2* color maps are different between normal functioning allografts, those with ATN and those with acute rejection. In acutely rejecting kidneys there are more blue areas, particularly in the region of the medullary pyramids, which correspond to lower R2* values (decrease deoxyhemoglobin concentrations) (Fig. 1c). On perfusion color maps, there are darker blue and black areas in the medulla of transplanted kidneys, corresponding to lower perfusion values (Fig. 1f). On histopathological evaluation there is cellular debris in the tubules and relative preservation of the capillaries in the specimen from allografts with ATN (Fig. 1g), while the specimens from allografts with acute rejection demonstrate polymorphonuclear cell infiltration and swelling of the tubular cells and vessels (Fig. 1h).
Fig. 1.
In the R2* color map of a normal functioning transplanted kidney (a) there are green, yellow and orange areas in the medullary pyramids (white solid arrow). In a transplanted kidney with acute rejection, the R2* color map demonstrates more blue areas (c), particularly in the region of the medullary pyramids (open white arrow) that corresponds to lower R2* values in the medulla (c). On perfusion color maps, there are darker blue and black areas in the medulla of transplanted kidneys with acute rejection (white solid arrow), corresponding to lower perfusion values (Fig. 1f). On histopathological evaluation there is cellular debris (black arrow) in the tubules and relative preservation of the capillaries in the specimen from allografts with ATN (Fig. 1g). The specimens from allografts with acute rejection demonstrate polymorphonuclear cell infiltration (solid arrowhead) and swelling of the tubular cells and vessels (Fig. 1h).
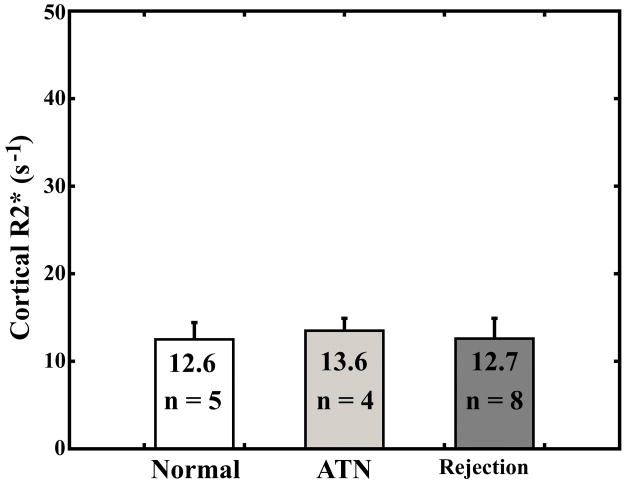
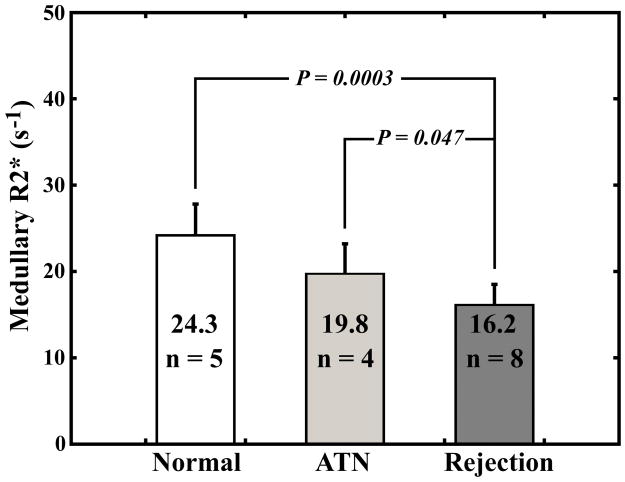
There was no significant difference between any of the groups for R2* values measured in the cortex (Fig. 2a). There was a significant difference between R2* values measured in the medulla of patients with acute rejection compared with R2* values in the medulla of patients with ATN (P = 0.047) and normal functioning allografts (P = 0.0003) (Fig. 2b).
Fig. 2.
Average cortical R2* measurements (a) and average medullary R2* measurements (b) for subjects with normal functioning allografts, subjects with ATN, and subjects with acute rejection. Error bars are standard deviation.
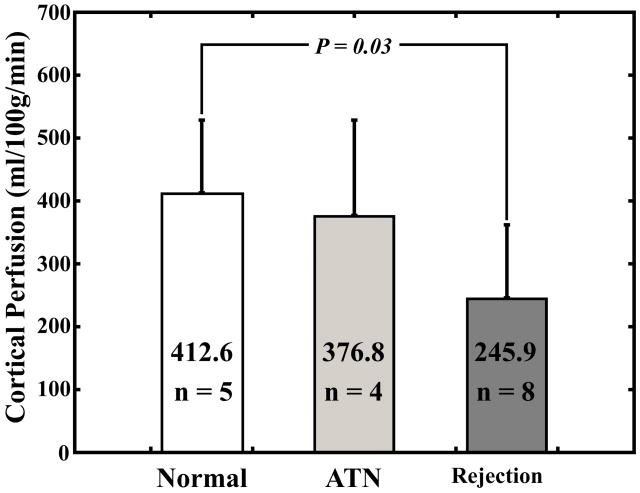
There was a significant difference in cortical perfusion measurements between subjects with acute rejection (245.9 ± 116.0 ml/100g/min) and normal functioning allografts (412.6 ± 115.9 ml/100g/min; P = 0.03) (Fig. 3a). There was a significant difference between medullary perfusion measurements in the group with acute rejection (124.4 ± 41.1 ml/100g/min) compared to medullary perfusion measurements in patients with ATN (246.9 ± 123.5 ml/100g/min; P = 0.02) and normal-functioning allografts (220.8 ± 95.8 ml/100g/min; P = 0.02) (Fig. 3b).
Fig. 3.
Average cortical perfusion measurements (a) and average medullary perfusion measurements (b) for subjects with normal functioning allografts, subjects with ATN, and subjects with acute rejection. Error bars are standard deviation.
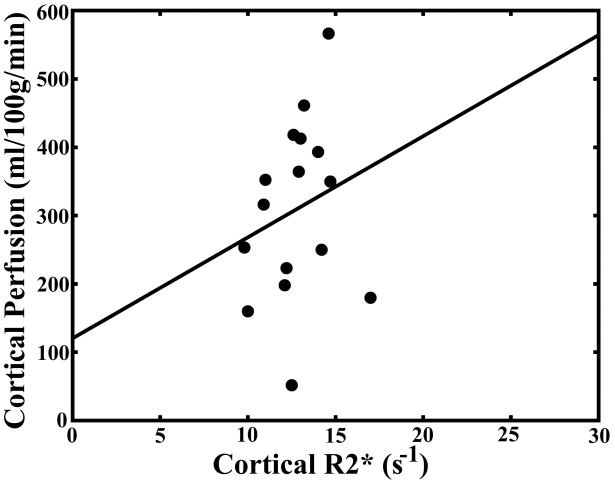
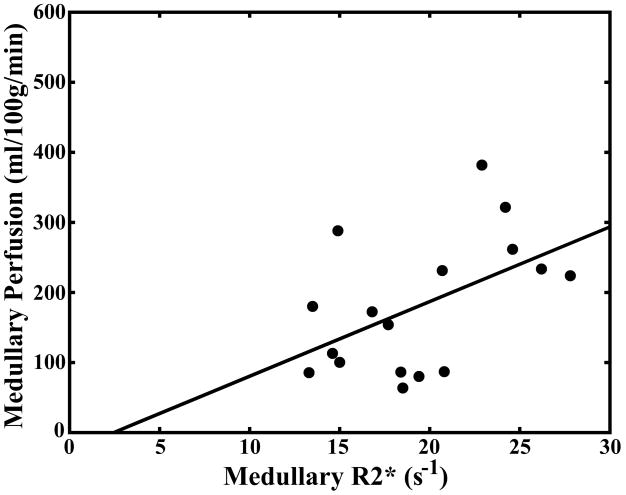
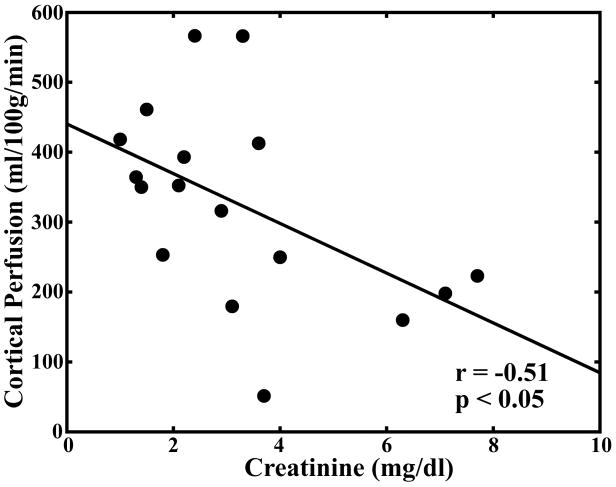
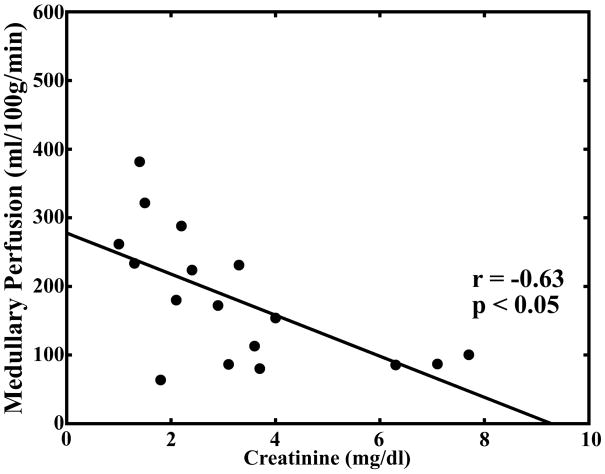
Pearson correlation coefficients for comparison of serum creatinine levels, hematocrit, medullary and cortical R2* measurements, and medullary and cortical perfusion measurements are summarized in Table 2. There was a significant correlation (P < 0.05) between cortical and medullary blood flow (r = 0.67). There was a significant correlation between medullary blood flow and medullary R2* (r = 0.50) but not between cortical blood flow and cortical R2* (r = 0.48; Fig. 4a–b). There was an inverse correlation between serum creatinine levels and both cortical (r = −0.51) and medullary blood flow (r = −0.63; Fig. 4c–d).
Table 2.
Pearson correlation coefficients calculated with measurements of oxygenation, perfusion, creatinine, and hematocrit in seventeen renal transplant patients.
| Cortical Renal Perfusion | Medullary Renal Perfusion | Cortical R2* | Medullary R2* | Creatinine | Hematocrit | |
|---|---|---|---|---|---|---|
| Cortical Renal Perfusion | 1 | 0.67† | 0.48 | 0.44 | −0.51† | 0.23 |
| Medullary Renal Perfusion | 1 | 0.22 | 0.50† | −0.63† | 0.08 | |
| Cortical R2* | 1 | 0.14 | −0.05 | 0.05 | ||
| Medullary R2* | 1 | −0.47 | 0.25 | |||
| Creatinine | 1 | 0.07 | ||||
| Hematocrit | 1 |
Values marked with a † are statistically significant (p < 0.05).
Fig. 4.
Scatter plot demonstrating no significant correlation between cortical perfusion and cortical R2* (r = 0.48; P = 0.0508) (a). Scatter plot demonstrating a significant correlation between medullary perfusion and medullary R2* (r = 0.50; P < 0.05) (b). Scatter plots demonstrating an inverse and significant correlation (P < 0.05) between cortical perfusion and creatinine (r = −0.51) (c) and medullary perfusion and creatinine (r = −0.63) (d).
4. Discussion
Assessing blood flow and oxygen bioavailability reproducibly is important in both native and transplanted kidneys, because trends in these functional parameters can be followed longitudinally and related to kidney function non-invasively in humans [1–3]. Furthermore, fMRI allows us to study kidney physiology as a dynamic interaction between renal blood flow and oxygenation, thus advancing our knowledge in basic human kidney function and the roles blood flow and oxygen balance play in disease states. Currently, fMRI is an active area of research to determine the most clinically useful methods for assessing renal function.
The results of this study demonstrate BOLD and perfusion MR imaging can non-invasively assess changes in blood flow and oxygen bioavailability in the cortex and medulla of transplanted kidneys during a single exam. Compared to allografts with normal function and those with ATN, allografts with biopsy-proven acute rejection have significantly decreased medullary R2* values on BOLD MR imaging and decreased medullary blood flow by perfusion MR imaging. The decrease in R2* values in the medulla of rejecting allografts indicates decreased deoxyhemoglobin levels and increased oxyhemoglobin levels, despite decreases in medullary blood flow.
The findings of decreased blood flow and increased oxygen bioavailability in the medulla of acutely rejecting transplanted kidneys is suggestive of a greater decrease in oxygen utilization compared to the decline in medullary perfusion. This apparent increase in oxygen bioavailability may be due to a decrease in glomerular filtration in this group. In animal studies, other investigators have noted increases in oxygen partial pressure in the medulla of kidneys with decreases in glomerular filtration rates [4, 5]. However, there was a decrease in glomerular filtration as measured by serum creatinine levels in the ATN group as well, yet the R2* measurements in the medulla were not significantly different from normal functioning allografts. Although the number of subjects with ATN in our study is small, our initial results suggest that the changes seen in the acutely rejecting allografts could represent an accumulation of medullary oxyhemoglobin due to impaired oxygen delivery to the cells as a result of parenchymal and microvascular inflammatory injury or decreased metabolic rate of the tubular cells, rather than being due to a decrease in the glomerular filtration rate.
Other investigators have noted decreases in medullary R2* in transplanted kidneys compared to normal native kidneys, as well as allografts undergoing acute rejection compared to normal functioning allografts [19, 30, 33]. In separate studies, changes in cortical and medullary perfusion have been noted using a qualitative MR perfusion imaging technique, which analyzed the magnitude of the peak signal intensity of the first pass during contrast enhanced MR imaging [15, 28, 32]. The current study supports the findings of other investigators and is the first study to date to correlate cortical and medullary perfusion and oxygen bioavailability in transplanted kidneys within the same exam.
BOLD and perfusion MR parameters were not significantly decreased in patients with ATN compared to normal functioning allografts. Post-transplant ATN or delayed graft function is primarily due to kidney allograft injury secondary to prolonged cold-ischemia time. In surgically successful transplants, with no septic or hypotensive episode following the procedure, the allograft blood flow is not compromised. Therefore, regional perfusion and oxygenation levels may not be significantly impaired in the absence of ongoing hemodynamic or immunological injury [8, 9, 14].
There was a correlation between cortical and medullary MR measured blood flows. This is not surprising knowing the medulla receives its blood flow via the vasa recta that emanate from cortical arterioles [35]. There was also an inverse relationship between serum creatinine and both cortical and medullary blood flows. This was an expected finding as the renal blood flow decreases during many varied pathologic and pharmacologic stresses that cause decreased renal function as measured by creatinine [4–6, 18, 24, 36].
There was a significant correlation between medullary blood flow and medullary R2* but not between cortical blood flow and cortical R2*. We interpret this in the context of using deoxyhemoglobin as an endogenous contrast agent [22, 26, 37]. The oxyhemoglobin saturation dissociation curve suggests that at PaO2 values above 40 mmHg, as in the renal cortex, the curve is relatively flat and changes in the PaO2 result in small changes in oxyhemoglobin saturation. However between PaO2 of 10 and 40 mmHg, as in the renal medulla, changes in PaO2 result in large changes in oxyhemoglobin saturation [38]. Therefore small alterations in PaO2 in the medulla cause changes in oxyhemoglobin concentrations detectable by BOLD MR imaging. Conversely, the changes in PaO2 in the cortex may result in minimal changes in oxyhemoglobin concentration; these differences may not be detectable by BOLD MR imaging at 1.5 Tesla.
There are limitations to consider when interpreting the results of our study. First is the small number of subjects that were studied. Despite the large differences we report between the group of allografts with acute rejection and those with normal function and ATN, our results need to be validated with a large cohort of subjects. This study is a point-in-time analysis and both blood flow and oxygen bioavailability are dynamic physiologic processes. Further studies are needed to determine if a single time point or a series of time points will be more sensitive and specific in the diagnosis of renal transplant dysfunction. Also, we only included patients who were less than four months post-transplantation and therefore our findings may not be applicable to patients with allograft dysfunction beyond the early postoperative period. Lastly, while our perfusion MR measurements in the cortex and medulla of transplanted kidneys are consistent with accepted values published in the literature [10], the model used to estimate perfusion (Appendix A) assumes contrast agent does not leave the vascular space during the first pass. However, filtration of gadolinium is known to occur instantaneously, and during the first pass up to 20 percent is filtered in a normally functioning kidney [38]. This is a constant that can potentially be related to the subject’s serum creatinine. Therefore our perfusion measures are estimates of absolute perfusion and are in part dependent on the glomerular filtration rate.
In light of recent concerns about gadolinium-containing contrast agent and nephrogenic systemic fibrosis (NSF), our group had performed all of these experiments well before this association was suspected [39]. Currently, contrast perfusion MR imaging needs to be approached cautiously, particularly in those with elevated serum creatinine values or diminished glomerular filtration rates. As data on the subject of gadolinium containing contrast agents and NSF emerges, the hope is to find a more stable agent that can be used safely in patients with renal insufficiency [40, 41]. Furthermore, non-contrast arterial spin labeling techniques are being developed to study renal perfusion and may take the place of contrast MR perfusion techniques in those with decreased renal function.
In conclusion, this study demonstrated the feasibility of using BOLD and perfusion MR imaging methods to assess changes in transplanted kidney function during a single exam. Compared to normal functioning allografts and those with ATN, MR-measured blood flow was decreased and oxygen bioavailability was increased in the medulla of acutely rejecting kidneys. Further studies verifying these changes in transplanted kidney physiology are warranted as fMRI may provide a sensitive and specific method for the diagnosis of disease in transplanted kidneys and a means by which to follow patients non-invasively during treatment.
Appendix A
In kidneys with normal perfusion, first pass is readily identified and modeled with a conventional gamma-variate function, but for reduced perfusion in disease, temporal mixing of first pass and contrast uptake in the nephrons contributes to error in the perfusion estimate. We utilized an iterative convolution approach for estimation of the tissue impulse response function, H(t) that may allow for more quantitative and reproducible results in cases of reduced perfusion observed in disease. We outline the iterative convolution method in the appendix below.
The measured signal, S(t), can be related to the contrast concentration, Cm(t), by:
| (1) |
S0 is defined as the signal intensity prior to contrast arrival, and k is dependent on the R2* relaxivity of the contrast agent.
Cm(t) was calculated according to Equation 1. Cm(t) was defined for both a major artery (renal or aorta), as well as the tissue of the transplanted kidney, Ca(t) and Ctiss(t) respectively. Ca(t) is also referred to as the arterial input function (AIF).
A time window encompassing the first pass of gadolinium was set within which Ca(t) was least-squares fit to a gamma-variate curve; elsewhere Ca(t) was set to zero. Ctiss(t) is fit by an iterative method described below.
As the dispersion of the bolus in the arterial input contributes to the dispersion of gadolinium observed in the organ, Ctiss(t) can be described as a convolution of Ca(t) and the tissue impulse response, H(t):
| (2) |
In our method, Ca(t) is known, and an initial guess at H(t) is made, H0(t). H0(t) is defined by a five variable lag-normal curve:
| (3) |
where C, tc, σ, γ, and tlag are free variables. Ca(t) is then convolved with H0(t) to yield Ctiss′ (t). A chi-squared quality of fit value is calculated for Ctiss′ (t) with respect to measured data, Cm(t). The five parameters defining H0(t) are then modified, to produce H′(t). The process is iterated until a minimum for the chi-squared value is found. The H′(t), and Ctiss′ (t) associated with the minima are defined as the final H(t) and Ctiss(t).
From H(t), the mean transit time (MTT) can be calculated according to:
| (4) |
where Hmax denotes the maximum value of H(t). The regional renal blood volume (rRBV) can be calculated from Ctiss(t) and Ca(t) by:
| (5) |
where κ is a function of the measured hematocrit (taken to equal 0.7333), and ρ is the density of the kidney (taken to equal 1.04 g/ml). Finally, in accordance with the central volume principal, the quantitative renal blood flow (RBF) is calculated by:
| (6) |
References
- 1.Huang AJ, Lee VS, Rusinek H. Functional renal mr imaging. Magn Reson Imaging Clin N Am. 2004;12:469–486. doi: 10.1016/j.mric.2004.04.001. [DOI] [PubMed] [Google Scholar]
- 2.Prasad PV. Functional mri of the kidney: Tools for translational studies of pathophysiology of renal disease. Am J Physiol Renal Physiol. 2006;290:F958–974. doi: 10.1152/ajprenal.00114.2005. [DOI] [PMC free article] [PubMed] [Google Scholar]
- 3.Rusinek H, Kaur M, Lee VS. Renal magnetic resonance imaging. Curr Opin Nephrol Hypertens. 2004;13:667–673. doi: 10.1097/00041552-200411000-00014. [DOI] [PubMed] [Google Scholar]
- 4.Brezis M, Agmon Y, Epstein FH. Determinants of intrarenal oxygenation. I. Effects of diuretics. Am J Physiol. 1994;267:F1059–1062. doi: 10.1152/ajprenal.1994.267.6.F1059. [DOI] [PubMed] [Google Scholar]
- 5.Brezis M, Heyman SN, Epstein FH. Determinants of intrarenal oxygenation. Ii. Hemodynamic effects. Am J Physiol. 1994;267:F1063–1068. doi: 10.1152/ajprenal.1994.267.6.F1063. [DOI] [PubMed] [Google Scholar]
- 6.Just A, Arendshorst WJ. Dynamics and contribution of mechanisms mediating renal blood flow autoregulation. Am J Physiol Regul Integr Comp Physiol. 2003;285:R619–631. doi: 10.1152/ajpregu.00766.2002. [DOI] [PubMed] [Google Scholar]
- 7.Norman JT, Stidwill R, Singer M, et al. Angiotensin ii blockade augments renal cortical microvascular po2 indicating a novel, potentially renoprotective action. Nephron Physiol. 2003;94:39–46. doi: 10.1159/000071289. [DOI] [PubMed] [Google Scholar]
- 8.Pallone TL, Zhang Z, Rhinehart K. Physiology of the renal medullary microcirculation. Am J Physiol Renal Physiol. 2003;284:F253–266. doi: 10.1152/ajprenal.00304.2002. [DOI] [PubMed] [Google Scholar]
- 9.Schurek HJ, Johns O. Is tubuloglomerular feedback a tool to prevent nephron oxygen deficiency? Kidney Int. 1997;51:386–392. doi: 10.1038/ki.1997.51. [DOI] [PubMed] [Google Scholar]
- 10.Brezis M, Rosen S. Hypoxia of the renal medulla--its implications for disease. N Engl J Med. 1995;332:647–655. doi: 10.1056/NEJM199503093321006. [DOI] [PubMed] [Google Scholar]
- 11.Epstein FH. Oxygen and renal metabolism. Kidney Int. 1997;51:381–385. doi: 10.1038/ki.1997.50. [DOI] [PubMed] [Google Scholar]
- 12.Ramanathan V, Goral S, Helderman JH. Renal transplantation. Semin Nephrol. 2001;21:213–219. doi: 10.1053/snep.2001.21213. [DOI] [PubMed] [Google Scholar]
- 13.Gill JS, Tonelli M, Mix CH, et al. The change in allograft function among long-term kidney transplant recipients. J Am Soc Nephrol. 2003;14:1636–1642. doi: 10.1097/01.asn.0000070621.06264.86. [DOI] [PubMed] [Google Scholar]
- 14.Perico N, Cattaneo D, Sayegh MH, et al. Delayed graft function in kidney transplantation. Lancet. 2004;364:1814–1827. doi: 10.1016/S0140-6736(04)17406-0. [DOI] [PubMed] [Google Scholar]
- 15.Beckmann N, Joergensen J, Bruttel K, et al. Magnetic resonance imaging for the evaluation of rejection of a kidney allograft in the rat. Transpl Int. 1996;9:175–183. doi: 10.1007/BF00335383. [DOI] [PubMed] [Google Scholar]
- 16.dos Santos EA, Li LP, Ji L, et al. Early changes with diabetes in renal medullary hemodynamics as evaluated by fiberoptic probes and bold magnetic resonance imaging. Invest Radiol. 2007;42:157–162. doi: 10.1097/01.rli.0000252492.96709.36. [DOI] [PMC free article] [PubMed] [Google Scholar]
- 17.Epstein FH, Veves A, Prasad PV. Effect of diabetes on renal medullary oxygenation during water diuresis. Diabetes Care. 2002;25:575–578. doi: 10.2337/diacare.25.3.575. [DOI] [PubMed] [Google Scholar]
- 18.Gandy SJ, Sudarshan TA, Sheppard DG, et al. Dynamic mri contrast enhancement of renal cortex: A functional assessment of renovascular disease in patients with renal artery stenosis. J Magn Reson Imaging. 2003;18:461–466. doi: 10.1002/jmri.10381. [DOI] [PubMed] [Google Scholar]
- 19.Han F, Xiao W, Xu Y, et al. The significance of bold mri in differentiation between renal transplant rejection and acute tubular necrosis. Nephrol Dial Transplant. 2008;23:2666–2672. doi: 10.1093/ndt/gfn064. [DOI] [PubMed] [Google Scholar]
- 20.Hofmann L, Simon-Zoula S, Nowak A, et al. Bold-mri for the assessment of renal oxygenation in humans: Acute effect of nephrotoxic xenobiotics. Kidney Int. 2006;70:144–150. doi: 10.1038/sj.ki.5000418. [DOI] [PubMed] [Google Scholar]
- 21.Juillard L, Lerman LO, Kruger DG, et al. Blood oxygen level-dependent measurement of acute intra-renal ischemia. Kidney Int. 2004;65:944–950. doi: 10.1111/j.1523-1755.2004.00469.x. [DOI] [PubMed] [Google Scholar]
- 22.Kone BC. A ‘bold’ new approach to renal oxygen economy. Circulation. 1996;94:3067–3068. doi: 10.1161/01.cir.94.12.3067. [DOI] [PubMed] [Google Scholar]
- 23.Kristensen DH, Pedersen M, Gron MC, et al. Intrarenal blood oxygenation and renal function measured by magnetic resonance imaging during long-term cyclosporine treatment. Transplant Proc. 2005;37:3302–3304. doi: 10.1016/j.transproceed.2005.09.013. [DOI] [PubMed] [Google Scholar]
- 24.Michaely HJ, Schoenberg SO, Oesingmann N, et al. Renal artery stenosis: Functional assessment with dynamic mr perfusion measurements--feasibility study. Radiology. 2006;238:586–596. doi: 10.1148/radiol.2382041553. [DOI] [PubMed] [Google Scholar]
- 25.Pedersen M, Dissing TH, Morkenborg J, et al. Validation of quantitative bold mri measurements in kidney: Application to unilateral ureteral obstruction. Kidney Int. 2005;67:2305–2312. doi: 10.1111/j.1523-1755.2005.00334.x. [DOI] [PubMed] [Google Scholar]
- 26.Prasad PV, Edelman RR, Epstein FH. Noninvasive evaluation of intrarenal oxygenation with BOLD MRI. Circulation. 1996;94:3271–3275. doi: 10.1161/01.cir.94.12.3271. [DOI] [PubMed] [Google Scholar]
- 27.Prasad PV, Priatna A, Spokes K, et al. Changes in intrarenal oxygenation as evaluated by BOLD MRI in a rat kidney model for radiocontrast nephropathy. J Magn Reson Imaging. 2001;13:744–747. doi: 10.1002/jmri.1103. [DOI] [PMC free article] [PubMed] [Google Scholar]
- 28.Preidler KW, Szolar D, Schreyer H, et al. Differentiation of delayed kidney graft function with gadolinium-dtpa-enhanced magnetic resonance imaging and doppler ultrasound. Invest Radiol. 1996;31:364–371. doi: 10.1097/00004424-199606000-00009. [DOI] [PubMed] [Google Scholar]
- 29.Ries M, Basseau F, Tyndal B, et al. Renal diffusion and bold mri in experimental diabetic nephropathy. Blood oxygen level-dependent. J Magn Reson Imaging. 2003;17:104–113. doi: 10.1002/jmri.10224. [DOI] [PubMed] [Google Scholar]
- 30.Sadowski EA, Fain SB, Alford SK, et al. Assessment of acute renal transplant rejection with blood oxygen level-dependent mr imaging: Initial experience. Radiology. 2005;236:911–919. doi: 10.1148/radiol.2363041080. [DOI] [PubMed] [Google Scholar]
- 31.Schachinger H, Klarhofer M, Linder L, et al. Angiotensin ii decreases the renal mri blood oxygenation level-dependent signal. Hypertension. 2006;47:1062–1066. doi: 10.1161/01.HYP.0000220109.98142.a3. [DOI] [PubMed] [Google Scholar]
- 32.Szolar DH, Preidler K, Ebner F, et al. Functional magnetic resonance imaging of human renal allografts during the post-transplant period: Preliminary observations. Magn Reson Imaging. 1997;15:727–735. doi: 10.1016/s0730-725x(97)00088-x. [DOI] [PubMed] [Google Scholar]
- 33.Thoeny HC, Zumstein D, Simon-Zoula S, et al. Functional evaluation of transplanted kidneys with diffusion-weighted and bold mr imaging: Initial experience. Radiology. 2006;241:812–821. doi: 10.1148/radiol.2413060103. [DOI] [PubMed] [Google Scholar]
- 34.Zuo CS, Rofsky NM, Mahallati H, et al. Visualization and quantification of renal r2* changes during water diuresis. J Magn Reson Imaging. 2003;17:676–682. doi: 10.1002/jmri.10314. [DOI] [PubMed] [Google Scholar]
- 35.Netter F. Kidneys, ureters and urinary bladder. 5. Summit, NJ: Novartis; 1997. pp. 15–19. [Google Scholar]
- 36.Franchini KG, Cowley AW., Jr Sensitivity of the renal medullary circulation to plasma vasopressin. Am J Physiol. 1996;271:R647–653. doi: 10.1152/ajpregu.1996.271.3.R647. [DOI] [PubMed] [Google Scholar]
- 37.Jandl J. Blood: Textbook of hematology. 2. Boston, MA: Little, Brown and Company; 1987. pp. 154–157. [Google Scholar]
- 38.Laissy JP, Idee JM, Fernandez P, et al. Magnetic resonance imaging in acute and chronic kidney diseases: Present status. Nephron Clin Pract. 2006;103:c50–57. doi: 10.1159/000090609. [DOI] [PubMed] [Google Scholar]
- 39.Marckmann P, Skov L, Rossen K, et al. Nephrogenic systemic fibrosis: Suspected causative role of gadodiamide used for contrast-enhanced magnetic resonance imaging. J Am Soc Nephrol. 2006;17:2359–2362. doi: 10.1681/ASN.2006060601. [DOI] [PubMed] [Google Scholar]
- 40.Sieber MA, Lengsfeld P, Frenzel T, et al. Preclinical investigation to compare different gadolinium-based contrast agents regarding their propensity to release gadolinium in vivo and to trigger nephrogenic systemic fibrosis-like lesions. Eur Radiol. 2008;18:2164–2173. doi: 10.1007/s00330-008-0977-y. [DOI] [PubMed] [Google Scholar]
- 41.Thomsen HS, Marckmann P, Logager VB. Enhanced computed tomography or magnetic resonance imaging: A choice between contrast medium-induced nephropathy and nephrogenic systemic fibrosis? Acta Radiol. 2007;48:593–596. doi: 10.1080/02841850701370717. [DOI] [PubMed] [Google Scholar]


