Abstract
A laboratory study was conducted to examine gait changes associated with aging and the effect of these changes on initiation of slips and frequency of falls utilizing newly defined biomechanical parameters of slips and falls. Twenty-eight participants from two age groups (young and old) walked around a circular track at a comfortable pace wearing a safety harness. A slippery floor surface was placed on the walking track over the force plate at random time intervals without the participants' awareness. Synchronized kinetic and kinematic measurements were obtained on both slippery and non-slippery walking surfaces. The results indicated that older participants' horizontal heel contact velocity was significantly faster, step length was significantly shorter, and transitional acceleration of the whole body centre-of-mass (COM) was significantly slower than younger participants. Older participants' initial friction demand, as measured by required coefficient of friction (RCOF), was not significantly different than their younger counterparts. Additionally, older participants slipped longer and faster, and fell more often than younger participants. A comparison of horizontal heel contact velocity for participants who fell with participants who did not fall indicated that, in general, fallers' horizontal heel contact velocity was faster than non-fallers. However, a comparison of RCOF for participants who fell with participants who did not fall suggested that RCOF was not a totally deterministic factor influencing actual fall events. These findings suggest that gait changes associated with aging (especially higher horizontal heel contact velocity and slower transition of the whole body COM) affect initiation of slip-induced falls.
Keywords: Slips and falls, Gait, Biomechanics, Aging, Friction demand, Slip distances, Heel velocity, Coefficient of friction
1. Introduction
Falls and gait instabilities are among the most serious problems facing older adults. Many studies have shown that with advancing age there is an increasing incidence of fatal slip and fall injuries (Campbell et al. 1981, Rubenstein et al. 1988, Agnew and Suruda 1993). Falls are the leading cause of death resulting from injury among elderly adults (over age 75), and the second highest cause of accidental death for 45 – 75 year olds (National Safety Council 1998). The National Safety Council reported that in 1997, 14 900 Americans met their death by falling, and of these deaths, 12 000 were people over 65 years of age (National Safety Council 1998). Furthermore, fall accidents are the second leading cause of fatalities next to motor vehicle accidents world-wide (Courtney et al. 2001).
A review of the biomechanical literature indicates that there are several differences in the gait characteristics of older and younger people. Older adults tend to walk slower, have a shorter step length, and a broader walking base. This results in a gait cycle with a longer stance or double support time (Murray et al. 1969, Imms and Edholm 1979, Gillis et al. 1986, Winter et al. 1990). On slippery floor surfaces, people of all ages tended to shorten their step length to reduce horizontal foot forces and reduce the likelihood of slipping (Cooper and Glassow 1963: 140 – 175, Llewellyn and Nevola 1992). It is generally believed that the shorter step length and the slower walking velocity of older adults results in a more stable or safer gait pattern.
Most slips that lead to falls occur when the frictional force (Fμ) opposing the movement of the foot is less than the shear force (Fh) of the foot immediately after the heel contacts the floor (Perkins and Wilson 1983). Specifically, at the time of the heel contact, there is a forward thrust component of force on the swing foot against the floor. This results in a forward horizontal shear force (Fh) of the ground against the heel. Additionally, a vertical force (Fv) results as the body weight and the downward momentum of the swing foot (and leg) make contact against the ground.
Perkins (1978) identified six peak forces in a normal gait cycle by observing ground reaction forces exerted between the shoe and ground, and calculated the ratio of horizontal to vertical foot forces (Fh/Fv). This ratio (Fh/Fv) has been used to identify where in the gait cycle a slip is most likely to occur (slip initiation). Analysing this ratio, Perkins suggested that dangerous forward slips were most likely to occur shortly after (< 50 – 100 ms) the heel contact phase of the gait cycle (peak 3). Currently this ratio (Fh/Fv at peak 3) is termed `Required Coefficient of Friction (RCOF)' because this it is thought to represent the general friction demand (minimum coefficient of friction that must be available or `required') at the shoe-floor interface to prevent initiation of forward slipping (Redfern and Andres 1984). Hanson et al. (1999) have reported the number of slip and fall events increased as the difference between the RCOF and measured dynamic COF of the floor surface increased. Walking speed, which is the product of cadence and step length, affects the magnitude of the shear force (Fh), and therefore, affects the RCOF during locomotion (e.g., increases in walking velocity and step length, increases the RCOF) (Carlsöö 1962, James 1983, Soames and Richardson 1985, Myung et al. 1992). Kinematically, RCOF has also been related to the tangent of the angle between the leg and a line perpendicular to the floor (Perkins 1978, Grönqvist et al. 1989).
The slower walking speeds and shorter step lengths observed in older adults should lower the RCOF and result in an associated reduced likelihood of slipping and falling. However, epidemiological studies clearly indicate that this is not the case. Other factors must therefore be involved. Gait parameters previously ignored in RCOF discussions, but associated with aging, are heel contact velocity, and the transitional acceleration of the whole body centre-of-mass (COM) during and shortly after heel contact. Winter et al. (1990) and Lockhart (1997) have reported that the horizontal heel velocity during the heel contact phase of the gait cycle was significantly higher for older individuals than for younger individuals, even though the walking velocity of older participants was slower. During walking, horizontal heel velocity rises gradually after heel-off, reaches a maximum velocity late in the swing phase, and falls rapidly to near zero just prior to heel contact. When the foot contacts the ground, the horizontal heel velocity must rapidly go to zero to support the stance leg. Given the constant contact time (t) and mass (m) associated with heel contact phase of the gait cycle (Irvine, 1986), the impulse-momentum relationship indicates that horizontal shear force (Fh) increases proportionally with horizontal heel velocity (Vh):
| (1) |
where mass (m) and time (t) are constant.
Traditional measurements of RCOF occur 50 to 100 ms after the heel contacts the ground (Peak 3 as defined by Perkins [1978]) and do not seem to be associated with the initial shoe-floor dynamics or the slippery floor surfaces. For example, in many slips and falls observed in the laboratory, heel velocity never reaches zero and Peak 3 seldom occurs on the slippery floor surfaces (Lockhart 1997). Thus, on the very slippery floor surfaces, heel contact velocity may provide a more sensitive measurement for predicting slips and falls among older adults than RCOF. Furthermore, characteristics associated with the transition of the whole body COM may play an important role in variation of horizontal as well as vertical foot force components during and after heel contact. In normal level walking, the whole body COM describes a smooth sinusoidal curve when projected on the plane of progression. The summits occur at the middle of the stance phase of each side and the lowest point occurs during double support when both feet are on the ground. At the time of the heel contact, the whole body COM is falling and progressing forward. Consequently, horizontal and vertical forces are altered (Lockhart, 2000). Recently, Pai and Patton (1997) and You et al. (2001) have reported that the whole body COM velocity was an important factor in predicting balance conditions of the participants. Additionally, Lockhart et al. (2000b) found that older individuals' whole body COM velocity during the heel contact phase of the gait cycle was slower than their younger counterparts. Consequently, older participants exhibited slower transition of the whole body COM (i.e., transitional acceleration of the whole body COM between heel contact to shortly after heel contact). This slower transitional acceleration of the whole body COM of the older adults may influence slip initiation due to alteration of the ground reaction forces, and may affect likelihood of slips and falls.
The objective of this study was to investigate the relationship between age-related gait changes, initial friction demand (e.g., RCOF), and characteristics associated with inadvertent slips and falls. It was also to provide sensitive diagnostic measurements for evaluating the potential for slips and falls among older adults. The specific research questions addressed by this study were: (1) are heel contact velocity and transitional acceleration of the whole body COM related to initial friction demand (e.g., RCOF), and is it possible to identify specific age-related changes in these parameters; and (2) are gait changes associated with aging and resultant initial friction demand (e.g., RCOF) related to the increased incidence of slipping and falling found in older adults. To relate these parameters (i.e., heel contact velocity, transitional acceleration of the whole body COM, step length, and RCOF) to actual slipping and falling incidents, participants were asked to walk across floor surfaces where slippery segments could be introduced at unexpected random time intervals. Kinematics and kinetic measurements taken during these trials were used to quantify slip severity and the likelihood of falling. It was hypothesized that gait changes among older individuals, specifically higher horizontal heel contact velocity and slower transitional acceleration of the whole body COM would affect severity of slip initiations and ultimately result in more falls than their younger counterparts.
2. Methods
2.1. Participants
Fourteen young individuals (7 male and 7 female) and 14 older individuals (7 male and 7 female) participated in this experiment. Age, stature and weight information for each participant group is presented in table 1. The young participants were recruited from the general student population at Texas Tech University and older participants were recruited from the local community (Lubbock, TX, USA). Prior to participating in the experiment, older participants were examined by a physician to ensure that they were in generally good physical health. Participants also received a peripheral neuropathy examination in the Neurology Department at St. Mary's Hospital in Lubbock, Texas. Participants were excluded from the study based on these tests (below 50% of the norm), and the physician's professional judgment. All subjects signed a release form approved by Texas Tech University IRB. All participants were compensated for their time and effort.
Table 1.
Subject information.
| Young(18 – 29 yrs.) | Old (65 yrs. and over) | |
|---|---|---|
| Mean (SD) | Mean (SD) | |
| Age (years) | 22.6 (2.1) | 75.5 (6.8) |
| Stature (cm) | 169.7 (6.1) | 170.2 (6.4) |
| Weight (kg) | 68.7 (9.6) | 76.8 (13.3) |
2.2. Apparatus
Two commonly used floor materials were used in this experiment: outdoor carpet (Beau Lieu ¼ Olefin) and vinyl tile (Armstrong). The vinyl tile surface was covered with motor oil (10W40) to reduce the coefficient of friction (COF). Dynamic coefficient of friction (DCOF) values for each surface were measured using a lab-produced 4.54 Kg horizontal pull slip-meter with rubber sole mounting (7 cm × 12 cm) on the force platform and found to be 1.80 for the outdoor carpet and 0.08 for the oily vinyl tile. DCOF measurements were conducted at a constant velocity of 20 cm/s. Means of 10 measurements on each of two floor surfaces were used as a final DCOF values. Standard shoes with rubber soles were supplied to all participants to maintain constant COF levels.
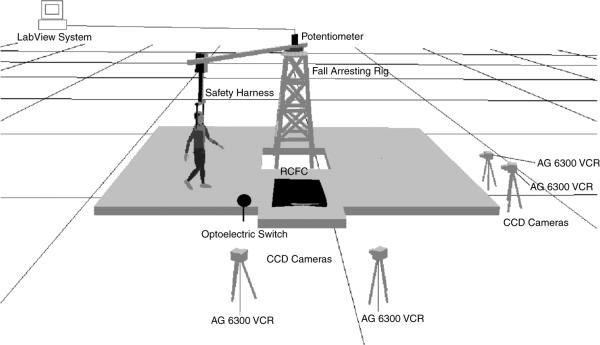
Walking trials were conducted on a circular track (20 metre in circumference) using an overhead fall arresting rig as shown in figure 1. The wooden deck was approximately 6.7 metres × 6.7 metres. The entire deck was covered with outdoor carpet.
Figure 1.
Field layout of the experiment including; fall arresting rig, potentiometer interfaced with the LabView system, safety harness, force platforms, optoelectric switch, CCD cameras (4), AG 6300 VCR (4) and Remote Control Floor Changer (RCFC) Units with base line carpet floor material.
A fall arresting rig was used to protect participants from falling during the experiment. The rig consisted of a full-body parachute harness attached to an automated overhead suspension arm. A feedback control system allowed the arm to sense the position of the participant and increase or reduce velocity to stay overhead. The rig was designed to permit the participant to fall approximately 15 cm before arresting the fall and stopping the forward motion. An Ariel Performance Analysis System (APAS) and four Panasonic video recorders (CCD) were used to collect the three-dimensional posture data of the participants as they walked over the test surface. Posture data were sampled and recorded at a rate of 60 Hz. Twenty-six reflective markers were used to define a whole body model. The locations and definitions of the external and extrapolated internal landmarks are shown in section 2.4.8. The ground reaction forces of the participants walking over the test surfaces were measured using two Bertec force plates (Bertec Corporation, Columbus, OH, USA) also sampled at a rate of 60 Hz.
A remote controlled floor changer (RCFC) was used to change the test floor surfaces so as to provide unexpected slippery conditions. The RCFC unit was composed of a DC motor (LEESON Electric Corp.) and a gliding shaft (ACME Thread) attached to a platform. The test surfaces were mounted on a platform, which was connected to the force plates. A remote control unit controlled the DC motor. Once triggered, the DC motor turned the ACME thread thereby, moving the platform to a desired floor position. The overall function of the system allowed a participant to walk under experimental conditions without being aware of the floor surface change.
2.3. Procedures
The participants participated in two testing sessions within a single week. A familiarization session was scheduled before the walking experiment. During the familiarization, the fall arresting system and walking conditions were introduced. During the experiment, the participants walked across the carpeted floor surface (base line floor) for 10 min. Within the 10 min session, 2 slippery conditions were randomly introduced by the system, and measurements of participant's posture and ground reaction forces were recorded (the second trial was used only if the first trial was not acceptable). A base-line measurement was first collected on the carpeted floor surface prior to introducing the slippery surface. While walking, participants were instructed to focus their eyes on a light emitting diode located approximately 2 m above and 3 m away from the testing area. A secondary task that required them to call out when the light was on and when it was off was used to ensure that they did not watch the floor changer. Participants were also supplied with a Walkman (listening to old comedy routines) during the walking experiment to conceal any sound of the floor changer's motors.
2.4. Calculations of dependent measures
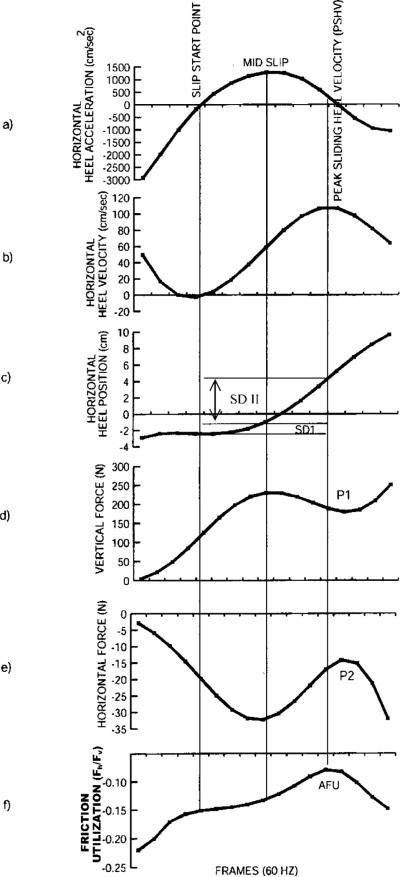
The converted coordinate data from APAS and ground reaction forces were observed during a typical slip behavior to provide robust definitions of the gait parameters. Figure 2 illustrates a typical slip-grip response starting from the heel contact phase. Heel contact was defined as the time when the vertical ground reaction force (GRF) exceeded 10 N (to synchronize kinetic and kinematic parameters, an LED was coupled to the vertical force output of the force plates, when the force exceeded 10 N, an LED was triggered).
Figure 2.
Composite view of the heel dynamics (kinetic and kinematic profiles) during a typical slip-grip response on the oily vinyl tile floor surface.
2.4.1. Initial Slip Distance (SDI)
Initial slip distance (SDI) (the resultant distance travelled by the foot after the heel contact phase of the gait cycle) was measured to provide information concerning the severity of initiation of slips. The slip-start point was defined as the point where non-rearward positive acceleration of the foot after heel contact occurred (where the first minimum of the vertical heel velocity after the heel contact occurred), and the slip-stop point for SDI was defined as the point where peak heel acceleration occurred after the slip-start point (mid slip on figure 2a). Thus, SDI was calculated using the heel coordinates between slip-start (X1,Y1) and slip-stop (X2, Y2) points on the vinyl floor surface (figure 2c), and using the formula:
| (2) |
2.4.2. Slip Distance II (SDII)
Slip distance II (SDII) was developed to provide information concerning the slip behaviur after the initiation of slips. The start point for the Slip distance II (SDII) was defined as a SDI slip-stop point (peak heel acceleration [mid-slip]–on figure 2a), and the end of slip (for the purpose of calculation) as the time where the first maximum of the horizontal heel velocity after slip start point occurred (Peak Sliding Heel Velocity [PSHV], figure 2a,b). Additionally, SDII was calculated utilizing a general distance formula (2).
2.4.3. Sliding Heel Velocity (νs)
The relative sliding heel velocity (νs) of the heel after heel contact was calculated (assess severity of slips and falls) by the mean of the instantaneous sliding heel velocity (ISHV) during the slip-start and PSHV points (figure 2a) and using the formula:
| (3) |
thus,
| (4) |
2.4.4. Step Length (SL)
The linear distance in the direction of progression between successive points of foot-to-floor contact of the first foot (X1, Y1) and other foot (X2, Y2) was measured. The step length was calculated from the difference between consecutive positions of the heel contacting the floor (resultant) using the general distance formula (2).
2.4.5. Step Length Index (SLI)
Normalized step length index was calculated by using the formula:
| (5) |
2.4.6. Heel Contact Velocity (νhc)
The instantaneous horizontal heel velocity (νhc) at heel contact was calculated utilizing heel velocities in the horizontal direction at the foot displacement of 1/60 s (Δt) before and after the heel contact phase of the gait cycle using the formula:
| (6) |
2.4.7. Initial Friction Demand (e.g., RCOF)
The required coefficient of friction (RCOF) was obtained by dividing the horizontal ground reaction force by the vertical ground reaction force (Fh/Fv) after heel contact (peak 3 as defined by Perkins, 1978) on the carpeted floor surface to obtain the initial friction demand.
2.4.8. Horizontal (plane of progression) velocities (before and after heel contact) of the whole body COM
Sagittal and frontal 3-D link (14) segment models were used to calculate position and velocities of the whole body COM. The sagittal and frontal models utilized the 14-component link-segment system defined by MacKinnon and Winter, 1993, and the anthropometric model (Winter 1990).
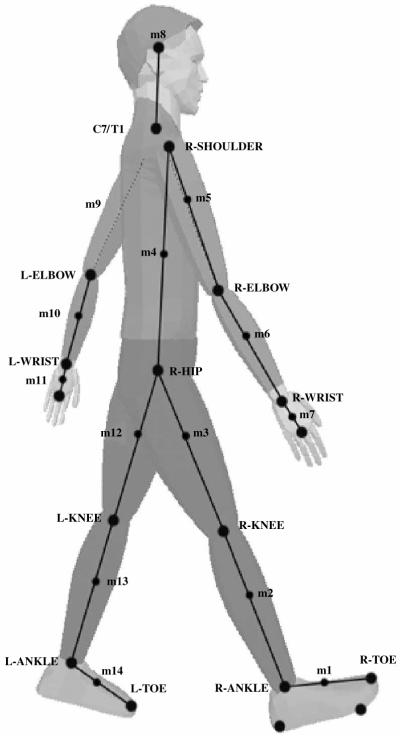
Twenty-six reflective markers were used to define a whole body model. The locations of the external and extrapolated internal landmarks are shown in figures 3 and 4. Internal landmarks were estimated at the mid-metatarsalphalangeal (MTP), subtalar, hip (in frontal plane), C7/T1 joints, mid-femoral condyles and mid-head (on figure 3, white balls represent internal landmarks). Internal landmarks at the knees, C7/T1 and head were calculated as the midpoint between markers as shown in figures 3 and 4. The mediolateral location of the mid-metatarsalphalangeal joint centre was determined as the point intersection of a line between the toe marker and subtalar joint centre and the perpendicular line to a marker placed on the lateral border of the head of the fifth metatarsal. The subtalar joint centre was estimated by extrapolating down 1.9 cm (Isman and Inman 1969) and perpendicular to the midpoint of the line between markers placed on the lateral and medial malleoli. The mediolateral location of the hip joint centre was determined by extrapolating medially 19.7% (Brinckmann et al. 1981) of the distance between the right and left greater trochanter (hip) markers. The vertical and anterior/posterior location of the hip was determined using the coordinates of the greater trochanter (hip) marker. The internal and external landmarks allowed definition of a 14-segment whole body model which includes; foot, lower leg, thigh, abdomen and thorax, head and neck, upper arm, forearm, and hand segments (tables 2 and 3).
Figure 3.
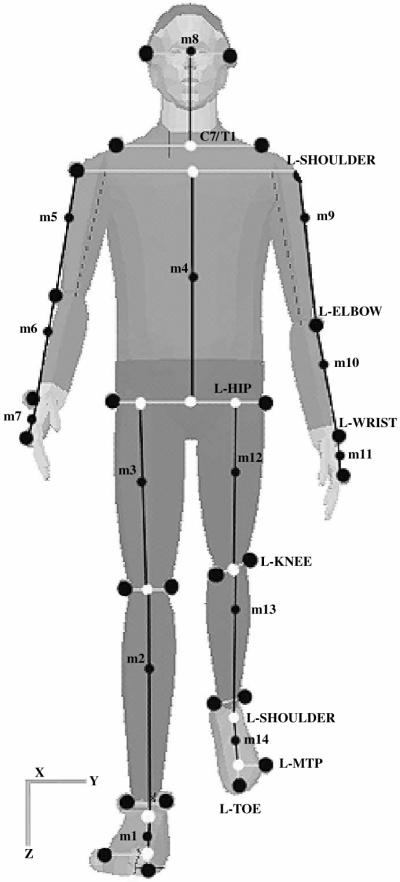
Marker placements and internal landmarks used to generate the frontal model.
Figure 4.
Marker placements and internal landmarks used to generate the sagittal model.
Table 2.
Definition of the 14-segments and the location of COM of the segments employed in the sagittal model.
| Segment | Segment Definition | Total Body Weight | COM Location |
|---|---|---|---|
| Foot (m1, m14) | Lateral malleolus/head metatarsal II | 0.0145 | Midpoint between lateral malleolus and head of metatarsal II |
| Leg (m2, m13) | Femoral condyles/Medial malleolus | 0.0465 | 43.3% below femoral condyle markers |
| Thigh (m3, m12) | Greater trochanter/Femoral condyles | 0.1000 | 43.3% below greater trochanter markers |
| Trunk (m4) | Greater trochanter/Glenohumeral joint | 0.497 | Midpoint between greater trochanter and glenohumeral joint |
| Upper arm (m5, m9) | Glenohumeral axis/elbow axis | 0.028 | 43.6% below glenohumeral axis |
| Forearm (m6, m10) | Elbow axis/ulnar styloid | 0.016 | 43.0% below elbow axis |
| Hand (m7, m11) | Wrist axis/knuckle II middle finger | 0.006 | 49.4% above knuckle II middle finger |
| Head and Neck (m8) | C7/T1 and 1st rib/ear canal | 0.081 | At the 1st rib/ear canal |
Table 3.
Definition of the 14-segments and the location of COM of the segments employed in the frontal model.
| Segment | Segment Definition | Total Body Weight | COM Location |
|---|---|---|---|
| Foot (m1, m14) | Extrapolating down 1.9 cm and perpendicular to the midpoint of the line between markers placed on the lateral and medial malleoli (SUBTALAR)/Perpendicular line to a marker placed on the lateral border of the head of the fifth metatarsal (MTP) and intersection of the head of metatarsal II | 0.0145 | Midpoint between SUBTALAR and the intersection of the line perpendicular to the MTP and head of metatarsal II |
| Leg (m2, m13) | Mid point between medial and lateral femoral condyles/Subtalar | 0.0465 | 43.3% below femoral condyle markers |
| Thigh (m3, m12) | Extrapolating medially 19.7% of the distance between the right and left Greater trochanter (HIP)/Mid point between medial and lateral femoral condyles | 0.1000 | 43.3% below hip markers |
| Trunk (m4) | Mid point between the right and left hip markers/Mid point between the right and left shoulder markers | 0.497 | Midpoint between the line intersecting hip and shoulder |
| Upper arm (m5, m9) | Glenohumeral axis/elbow axis | 0.028 | 43.6% below glenohumeral axis |
| Forearm (m6, m10) | Elbow axis/ulnar styloid | 0.016 | 43.0% below elbow axis |
| Hand (m7, m11) | Wrist axis/knuckle II middle finger | 0.006 | 49.4% above knuckle II middle finger |
| Head and Neck (m8) | Mid point between the right and left acromion of scapula (C7/T1)/Mid point between the right and left 1st rib/ear markers | 0.081 | At the 1st rib/ear canal |
2.4.8.1. Velocity of the whole body COM before heel contact (νCOMb)
The relative horizontal COM velocity of the whole body was calculated by taking the mean of the displacement over 3 time intervals (50 ms) of the instantaneous COM velocity before the heel contact phase (ICOMVB) of the gait cycle using the formula:
| (7) |
thus,
| (8) |
2.4.8.2. Velocity of the whole body COM after heel contact (νCOMa)
The relative horizontal COM velocity of the whole body was calculated on the oily vinyl floor surface to identify a fall (νs>νCOMa) by taking the mean of the instantaneous velocity of the COM (ICOMVA) during the slip-start and PSHV points (period of slip) and using the formula:
| (9) |
thus,
| (10) |
2.4.8.3. Transitional acceleration of the whole body COM ()
The relative horizontal COM differences between νCOMb and νCOMa was calculated for the carpeted floor surface to describe the relationship between the speed of the whole body COM transfer and RCOF differences among different age groups. This analysis was only performed on the carpeted floor surface condition to compare with RCOF during normal walking conditions using the formula:
| (11) |
2.5. Treatment of data
The converted coordinate data for each of the 26 body markers and the ground reaction forces were digitally smoothed using a fourth-order, zero-lag, low-pass Butterworth filter (Winter 1990). Residual analyses of the difference between the filtered and unfiltered signals over three different cutoff frequencies (6, 10, and 12 Hz) determined 6 Hz as the preferred cutoff frequency.
The dependent measures; step length (SL), step length index (SLI), horizontal heel contact velocity (νhc), and walking velocity (as measured by velocity of the whole body centre-of-mass [COM]-before heel contact [νCOMb]); were analysed using a 2×2 (age×floor) two-way repeated measures analyses of variance (ANOVA). RCOF, velocity of the whole body COM-after heel contact (νCOMa), and transitional acceleration of the whole body COM () were analysed using a one-way analysis of variance on the carpeted floor surface. Initial slip distance (SDI), slip distance II (SDII), and sliding heel velocity (νs) were analysed using one-way analyses of variance on the oily vinyl tile floor surface. Results were considered significant at ≥0.05. For these analyses, floor (where applicable) was treated as a within-participants effect, while age was a between-participants effect.
Bivariate regression analyses were performed between the independent (RCOF) and dependent variables (νhc, νCOMb, νCOMa, and ) in order to elaborate on the relationships between older adults gait changes and severity of slip initiation (RCOF) utilizing base-line measurements on the carpeted floor surface. Additionally, bivariate regression analyses were performed between the independent (νhc) and dependent variables (SDI and SDII) to describe the relationship between heel contact velocity (νhc) and the severity of slips on the oily vinyl floor surface.
Furthermore, a fall index was developed utilizing sliding heel velocity (νs) and velocity of the whole body COM after heel contact (νCOMa) on the oily vinyl floor surface (along with video inspection, a fall was defined if νs>νCOMa).
The p-values in the repeated measures ANOVA were adjusted for violations of the assumptions regarding the variance-covariance matrix using the Huynh-Feldt method to estimate η and adjusting the degree-of-freedom accordingly (Winer et al. 1991). In addition, constant variance and normality assumptions were verified using residual analysis and normality plots. A computer algorithm was written in C++ 6.0 to objectively determine the dependent measures.
3. Results
3.1. Step Length (SL) and Step Length Index (SLI)
Consistent with previous findings (Bassey et al. 1976, Imms and Edholm 1979, Winter 1991: 87 – 94, Lockhart 1997), a reduction in step length was observed for the older individuals. In general, the result of two-way ANOVA indicated statistically significant (p≤0.05) SL differences between the age groups (F(1,26)=5.307, p≈0.029, =1.04). Similarly, the ANOVA analysis of SLI also showed significant effects for the age groups (F(1,26)=8.605, p≈0.007, ε=1.04). Additionally, there were no statistically significant (p>0.05) floor effects on SL (F(1,26)=1.859, p≈0.1844, ε=1.04) and SLI (F(1,26)=1.642, p≈ 0.211, ε=1.04).
Table 4 summarizes the mean values and standard deviations for each of the dependent measures as a function of age.
Table 4.
Summary of gait parameters.
| Young (18 – 29 yrs.) | Old (> 65 yrs.) | ||
|---|---|---|---|
| Variables | Symbol | Mean (SD) | Mean (SD) |
| Step Length (cm) | SL | 65.35 (7.45) | 58.97 (7.93) |
| SL Index (SLI) | SLI | 0.39 (0.04) | 0.35 (0.03) |
| Heel contact velocity (cm/s) | vhc | 27.09 (14.52) | 39.21 (17.93) |
| Before heel contact COM velocity (cm/s) | vCOMb | 109.99 (14.42) | 99.87 (16.39) |
| *After heel contact COM velocity (cm/s) | vCOMa | 120.81 (14.19) | 107.69 (16.41) |
| *Transitional acceleration of COM (cm/s2) | 303.93 (11.85) | 200.30 (5.18) | |
| *Initial friction demand | RCOF | 0.177 (0.02) | 0.187 (0.02) |
| **Initial Slip Distance (cm) | SDI | 1.09 (0.39) | 2.17 (0.36) |
| **Slip Distance II (cm) | SDII | 4.25 (0.87) | 7.67 (0.93) |
| **Sliding heel velocity (cm/s) | vs | 47.34 (9.74) | 75.84 (9.86) |
Measured on carpeted floor surface only.
Measured on oily vinyl surface only.
3.2. Heel contact velocity (νhc) and the whole body COM velocity before heel contact (νCOMb)
The result of two-way ANOVA indicated that the horizontal heel contact velocity (νhc) of older individuals was significantly (p≤0.05) faster than their younger counterparts (F(1,26)=5.076, p≈ 0.033) even though the walking velocity (νCOMb) of older individuals was significantly slower than their younger counterparts (F(1,26)=4.404, p≈0.045). Additionally, there were no statistically significant (p>0.05) floor effects on νhc (F(1,26)=1.767, p≈ 0.1953) and νCOMb (F(1,26)=1.906, p≈0.1792).
3.3. Velocity of the whole body COM after heel contact (νCOMa) and Transitional acceleration of the whole body COM ()
The velocity of the whole body COM after heel contact (νCOMa) was defined as the relative horizontal COM velocity of the whole body after heel contact phase of the gait cycle, and the transitional acceleration of the whole body COM () was defined as the relative horizontal whole body COM velocity differences between νCOMb and νCOMa.. In general, progression of the whole body COM after heel contact (νCOMa) was faster than before heel contact phase of the gait cycle (νCOMb). The result of one-way ANOVA indicated that the older individuals' νCOMa was significantly slower than their younger counterparts (F(1,26)=3.334, p≈0.046). Additionally, the older individuals' transitional acceleration of the whole body COM () was significantly slower than their younger counterparts (F(1,26)=4.218, p≈ 0.019).
3.4. Initial friction demand (e.g., RCOF)
Although the mean RCOF for older individuals was higher than their younger counterparts, the one-way ANOVA analysis of RCOF indicated no statistically significant difference between the age groups (F(1,26)=1.763, p<0.1958).
3.5. Slip distances (SDI and SDII)
The initial slip distance (SDI) of older individuals was significantly longer than their younger counterparts (F(1,26)=4.075, p<0.05). Additionally, the slip distance II (SDII) for older individuals was significantly longer than their younger counterparts (F(1,26)=7.18, p<0.013).
3.6. Sliding heel velocity (νs)
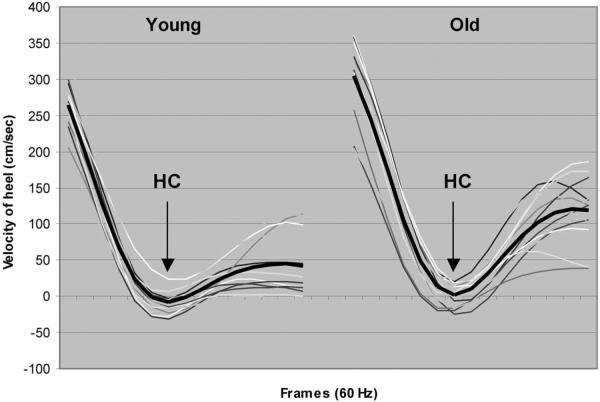
The one-way ANOVA analysis of νs indicated that sliding heel velocity (νs) of the older individuals was significantly faster than their younger counterparts (F(1,26)=4.221, p<0.05). Figure 5 illustrates the results of individual trials and means (darker line) of heel velocity before heel contact (νhc) and after heel contact (νs) on the oily vinyl floor surface among young and older individuals.
Figure 5.
Composite pattern of young and older individuals heel velocity before heel contact (νhc) and after heel contact (νs) (7 frames before and 7 frames after heel contact) on an oily vinyl floor surface (including the heel contact frame (HC)). Heel contact was defined as the time when the vertical ground reaction force exceeded 10 N. The darker line expresses the mean pattern of the heel velocities.
3.7. Relationship between the gait parameters (νhc, νCOMb, νCOMa, and ) and RCOF (carpeted floor surface)
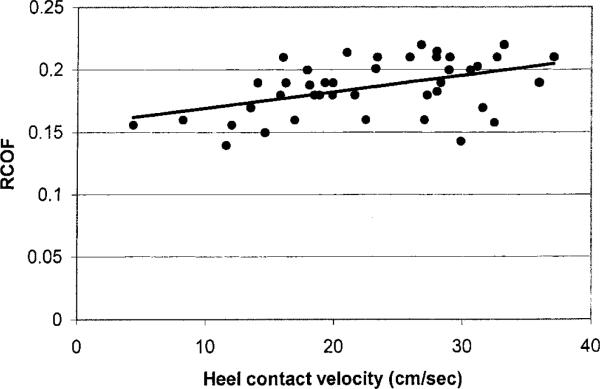
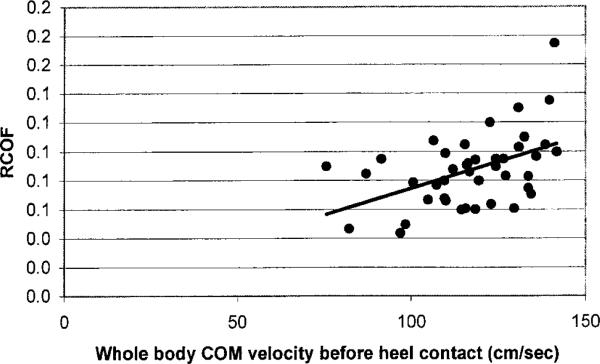
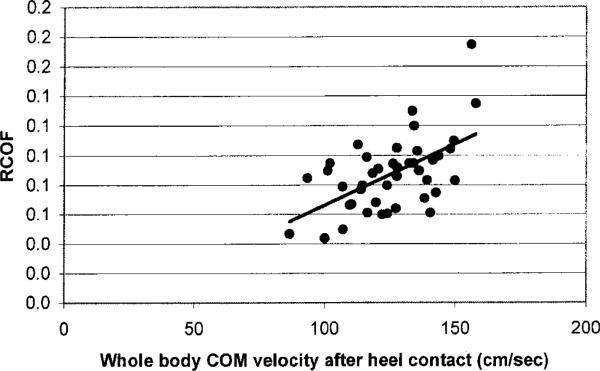
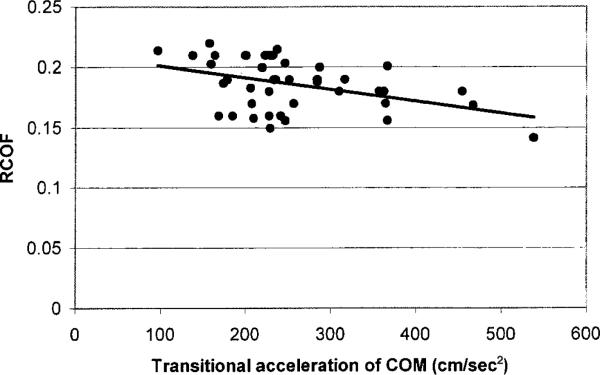
Table 5 summarizes the R2 and p-values for each of the bivariate regression analyses. In general, regression analysis between RCOF and νhc indicated a statistically significant relationship with R2=0.21 (figure 6). A stronger relationship was observed for the relationship between RCOF and progression of the whole body COM (νCOMb (Figure 7) and νCOMa (Figure 8)), and transitional acceleration of the whole body COM () (Figure 9).
Table 5.
Results of bivariate regression analyses.
| Variables |
|||
|---|---|---|---|
| Dependent | Independent | R2 | p |
| RCOF | vhc | 0.21 | 0.002* |
| RCOF | vCOMb | 0.4616 | 0.0001* |
| RCOF | vCOMa | 0.4838 | 0.0001* |
| RCOF | 0.4981 | 0.0001* | |
| vhc | SDI | 0.41 | 0.0001* |
| vhc | SDII | 0.18 | 0.0001* |
Significant relationships.
Figure 6.
Relationship between initial friction demand (e.g., RCOF) and heel contact velocity (νhc). Relatively low R2 (0.21) value indicates that νhc is not the only variable affecting the initial friction demand (e.g., RCOF).
Figure 7.
Relationship between initial friction demand (e.g., RCOF) and progression of the whole body COM before heel contact (νCOMb). Relatively high R2 (0.46) indicates that RCOF is a function of walking velocity (or progression of the whole body COM).
Figure 8.
Relationship between initial friction demand (e.g., RCOF) and progression of the whole body COM after heel contact (νCOMa). Relatively high R2 (0.48) indicates that RCOF is a function of walking velocity (or progression of the whole body COM).
Figure 9.
Relationship (R2 = 0.498) between initial friction demand (e.g., RCOF) and transitional acceleration of the whole body COM between before and after heel contact ().
3.8. Relationship between the heel contact velocity (νhc) and Initial Slip Distance (SDI)
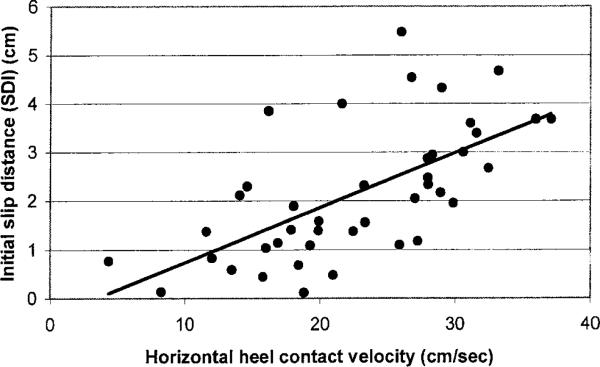
The relationship between heel contact velocity (νhc) and initial slip distance (SDI) was observed to indicate (and quantify) effects of horizontal heel contact velocity on initiation of slips. The result of regression analysis indicated a statistically significant relationship between νhc and SDI (p≈ 0.0001) with R2=0.41 (figure 10). This result suggests that individuals with higher horizontal heel contact velocity slipped longer initially.
Figure 10.
Relationship between Initial Slip Distance (SDI) and horizontal heel contact velocity (νhc) on the oily vinyl floor surface. Relatively high R2 (0.41) value indicates that higher heel contact velocity increased severity of slip initiation as defined by initial slip distance.
3.9. Relationship between the heel contact velocity (νhc) and Slip Distance II (SDII)
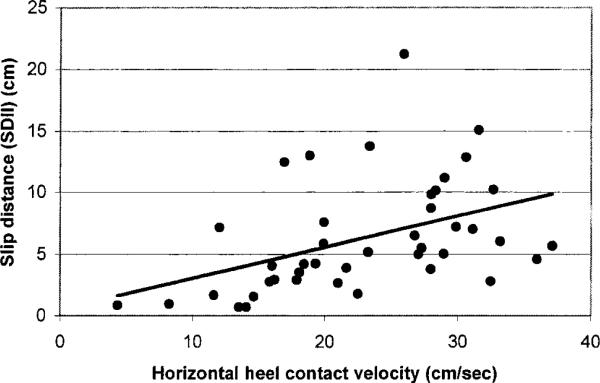
The relationship between heel contact velocity (νhc) and slip distance II (SDII) was observed to investigate effects of νhc on slipping behaviour after the initiation of slips. The result of regression analysis between νhc and SDII indicated a statistically significant relationship (p≈0.0001), however, the relationship (R2=0.18) between νhc and slip distance II (SDII) was lower than the relationship between νhc and initial slip distance (SDI) (figure 11). This result suggests that slip distance II (SDII) may be affected by factors other than instantaneous horizontal heel contact velocity.
Figure 11.
Relationship between Slip Distance II (SDII) and horizontal heel contact velocity (νhc) on the oily vinyl floor surface. Relatively low R2 (0.18) value indicates that horizontal heel contact velocity may not be an only factor influencing Slip Distance II (SDII).
3.10. Frequency of actual falls (Fall Index)
A Fall Index was obtained by comparing horizontal velocity of the whole body COM (νCOMa) with sliding heel velocity (νs) of the individuals on the oily vinyl floor surface (during the period of slipping). In order to objectively assess an actual fall, a fall was identified as whenever the νs was greater than the νCOMa during slipping. In addition, visual inspections of video recordings of the actual fall trials (as defined by Fall Index) were made to ensure that actual falls occurred. The result of the Fall Index indicated that younger individuals (2 participants) fell twice (out of total of 14 trials), and older individuals (7 participants) fell a total of 7 times (out of total of 14 trials).
3.11. Slip recovery threshold
Threshold values were established for initial slip distance (SDI) and sliding heel velocity (νs) to differentiate falling from slipping behaviour (table 6). The results of Slip Recovery Threshold indicated that the younger individuals' mean recovery threshold was higher and suggests that the recovery threshold is not all same for the entire population. Thus, in a given situation, older individuals are at a higher risk for fall accidents (i.e., younger individuals can slip longer and faster and not fall).
Table 6.
Slip recovery threshold across two age groups.
| SDI (cm) | SHV (cm/s) | |
|---|---|---|
| Young | 3.91 | 144.45 |
| Old | 3.12 | 107.63 |
3.12. Fallers and non-fallers profile of RCOF and vhc
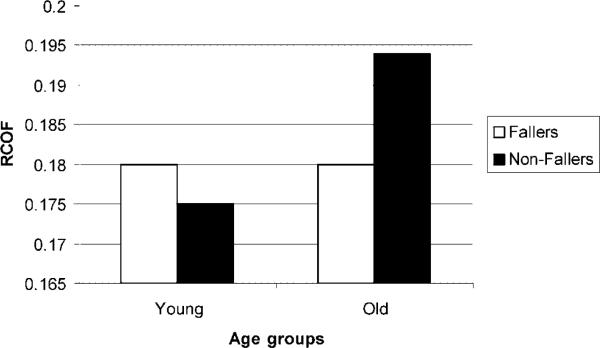
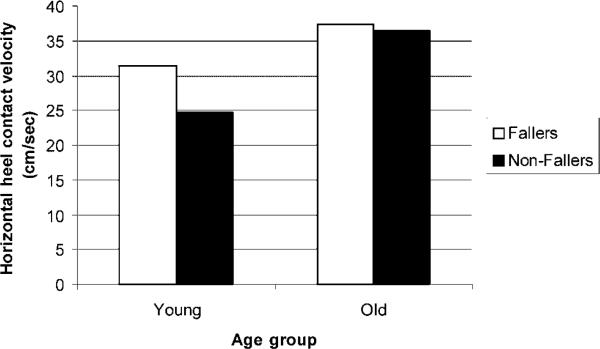
In order to investigate the relationship between initial friction demand, as measured by RCOF, and heel contact velocity (vhc), and actual fall events, a Fall Index and an individual's RCOF and vhc were utilized to compare fallers and non-fallers. The results suggest that for the younger individuals, the RCOF of fallers was on average, higher than the non-fallers. For the older individuals, however, the RCOF for fallers was lower than for non-fallers (figure 12). In terms of horizontal heel contact velocity (vhc), the vhc of younger individuals was slightly faster for fallers than non-fallers. Additionally, for older individuals, vhc was faster for the fallers than the non-fallers (figure 13). These results suggest that friction demand as measured by RCOF may not be a totally deterministic predictor of actual fall events.
Figure 12.
Comparison of faller and non-faller RCOF profiles between young and older age groups.
Figure 13.
Comparison of faller and non-faller heel contact velocity (νhc) profiles between young and older age groups.
4. Discussion
This research project was undertaken to provide a better understanding of how gait changes among older adults affect initiation of inadvertent slips and falls. In this section, the specific research questions addressed by this study will be elaborated.
Question 1: Are heel contact velocity or transitional velocity of the whole body COM related to initial friction demand (e.g., RCOF), and is it possible to identify specific age-related changes in these parameters?
Base-line measurements on the carpeted floor surface were used to elaborate on the relationships between the gait changes of older adults and initial friction demand (e.g., RCOF).
As indicated by many researchers, initial gait characteristics; such as step length, walking velocity (i.e., velocity of the whole body COM) and heel contact velocity; may affect RCOF due to an alteration in horizontal foot forces at the time of heel contact. Consistent with previous findings (Winter et al. 1990, Winter 1991, Lockhart 1997) the step length of older adults was shorter, walking velocity was slower, and heel contact velocity was faster than their younger counterparts. Furthermore, the results from this investigation indicated that RCOF of older adults was not significantly lower than their younger counterparts. Kinematically and kinetically, these results are somewhat confusing due to the fact that the shorter step length and slower walking velocity of older adults should have decreased the magnitude of the horizontal ground reaction force thereby resulting in lower overall mean value of the RCOF (Perkins 1978, Soames and Richardson 1985, Grönqvist et al. 1989). This generalization leads toward assuming that the higher heel contact velocity of older adults increased the RCOF, however, thorough investigation of the relationships between the initial gait parameters and the RCOF suggest that multiple mechanisms are involved in control of initial friction demand (e.g., RCOF).
Calculation of the RCOF at `peak 3' occurs shortly after the heel contacts the ground (at this instance the heel is already on the ground and going backwards), and thus, the instantaneous heel velocity at or before heel contact may have minimum effect on RCOF. This statement is further supported by the relationship between the RCOF and vhc. Bivariate regression analysis between the RCOF and vhc indicated no statistically significant relationship (R2 = 0.1177, p = 0.286).
Furthermore, since the RCOF is a function of both horizontal and vertical ground reaction forces after the heel contact phase of the gait cycle, factors influencing horizontal as well as vertical force components after heel contact may play an important role in fluctuation of the RCOF.
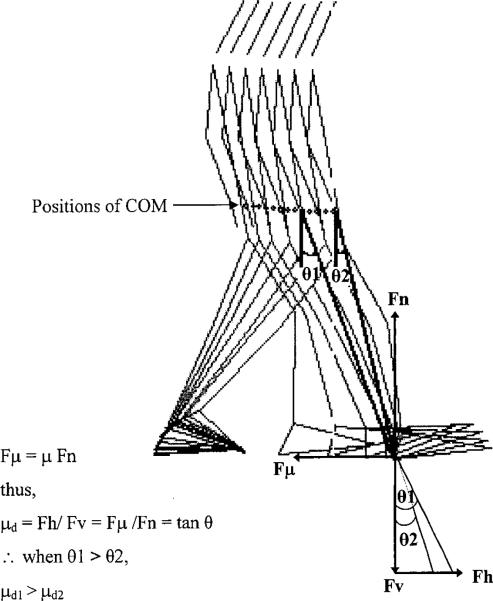
A typical slip-grip response with progression of the whole body COM and vertically projected angle θ between the instance of heel contact (θ1), and shortly after the heel contact (θ2) is illustrated in figure 14.
Figure 14.
Positions of the whole body COM and force vectors applied by the left foot during heel contact phase in normal level walking, where, Fh = horizontal; Fv = vertical; Fμ = frictional; and Fn = normal force; μ = coefficient of friction; μd = friction demand (e.g., RCOF); μd1 = friction demand at heel contact association with θ1; and μd2 = friction demand after heel contact associated with θ2.
As the transfer of the whole body COM progresses forward, projected angle θ decreases from heel contact to shortly after heel contact (i.e., transition of the whole body COM). At the time of the heel contact (θ1), force vectors applied by the contacting foot (especially the horizontal foot force) will be greater than the horizontal force vector applied after heel contact (θ2) as a result of force-angle relationship – given that the angle at the knee of interest is straight at the time of heel contact (Saunders et al. 1953). In other words, initial friction demand (e.g., RCOF) decreases from θ1 to θ2. This statement is further supported by bivariate correlation analysis between RCOF and transitional acceleration of the whole body COM. Relatively high R2 (0.498) value and negative relationship suggest that RCOF is a function of transfer of the whole body COM (before and shortly after heel contact phase of the gait cycle), and the faster the transfer, the lower RCOF will be. Intuitively, quicker transition of the whole body COM may be beneficial in terms of reducing initial friction demand (e.g., RCOF) and associated reduced likelihood of slipping. However, older adults transfer of their COM was slower than their younger counterparts, and thus, may have increased the ratio of horizontal to vertical foot force (i.e. RCOF) for older adults, even though walking velocity was slower and step length was shorter.
In conclusion, older adult's RCOF was not significantly lower than their younger counterparts, and initial gait characteristics such as heel contact velocity did not significantly influence RCOF. The results from bivariate correlation analyses between RCOF and vCOMb, and vCOMa suggest that the RCOF is affected by walking velocity (or the whole body COM velocity) rather than heel velocity alone. Furthermore, may have even greater influence on RCOF values than the all other variables discussed so far.
Question 2: Are gait changes associated with aging and resultant initial friction demand (e.g., RCOF) related to the increased incidence of slipping and falling found in older adults?
Although typical slips are initiated at `Peak 3' shortly after the heel contact, this may not be always the case on very slippery floor surfaces. In these situations, initial heel contact velocity may play an important role in initiation of slips and falls. This statement is further supported by the relationship between initial slip distance (SDI) and horizontal heel contact velocity (vhc). The relationship (R2 = 0.41) between SDI and vhc indicated that individuals with higher horizontal heel contact velocity slipped longer initially. Furthermore, the result of the age effect on SDI indicated that the initial slip distance of older individuals was significantly longer than their younger counterparts. Thus, in a given situation, older adults are placed at a higher risk for initiation of slips than their younger counterparts due to the higher heel contact velocity and slower transition of the whole body COM.
In terms of falling frequencies, the Fall Index indicated that older individuals fell considerably more than their younger counterparts. Non-significant relationship between vhc and SDII (R2 = 0.18) indicated that horizontal heel contact velocity was not a deterministic factor influencing SDII. This suggests that vhc is accounted for in SDI and its effect has been mitigated by the time SDII is measured. SDII has been related to the beginning of the recovery phase of the slips and falls (Lockhart et al. 2000a). Thus it seems that factors influencing the recovery phase of the slips and falls (muscular strength and sensory information, Lockhart et al. 2000a) may influence SDII more than initial horizontal heel contact velocity. Furthermore, as suggested by Hanson et al. (1999) RCOF may not be a totally deterministic factor influencing actual fall events. Faller and non-faller profiles of RCOF further support this statement. As indicated, there was a disagreement between RCOF and actual fall events (especially for older adults). Therefore, it seems that transition of the whole body COM and horizontal heel contact velocity (vhc) will influence initial friction demand (e.g., RCOF) and initiation of slips, however, they may not be totally deterministic predictors of the actual fall events.
Previous studies investigating the whole body COM with respect to slips and falls (Pai and Patton 1997, You et al. 2001) suggested that velocity of COM with respect to base of support was an important variable influencing slips, and recovery of slips. In this study, age-related walking characteristics and the whole body COM transition before heel contact to shortly after heel contact significantly influenced initial friction demand (e.g., RCOF) and initiation of slips. Thus, evaluation of these two parameters should be included in the effective diagnosis of slip initiation analysis for older adults.
Although every attempt was made to study inadvertent slips and falls, some assumptions made in this study could lead to potential sources of error. For example, it was assumed that the participant's gait was consistent for all trials, but there may have been some subtle changes in gait between conditions. Although speculated, an inspection of the data indicated that the participants were consistent throughout the experiment. For example, in this study, the step length and step length index were analysed on both (slippery and non-slippery) floor surfaces to observe age related gait changes as well as to assist in the determination of a base line assumption on inadvertency. Previous non-inadvertent experiment findings suggested that when walking on the slippery floor surfaces participants tended to reduce their step length. The overall step length for the carpeted floor surface was only slightly longer (less than 1 cm) than for the oily vinyl floor surface (compared to the previous non-inadvertent experiment where step length difference between slippery and non-slippery floor surfaces was greater than 10 cm (Lockhart 1997)). Lack of significant SL and SLI differences between slippery and non-slippery floor surfaces suggest that participants were not aware of the floor changes and thus did not alter their step length when stepping on the slippery floor surface.
In conclusion, heel contact velocity (νhc) and transition of the whole body COM can be analysed to evaluate slip initiation, however they may not be totally deterministic predictors of actual fall events. To better predict falls, factors influencing recovery of slips and falls should be examined (such as musculoskeletal strength, and sensory information).
Acknowledgements
This research was supported by the National Institute of Health (NIH) Grant R03/small grant. The paper's contents are solely the responsibility of the authors and not necessarily represent the official views of the NIH.
References
- Agnew J, Suruda AJ. Age and fatal work-related falls. Human Factors. 1993;35:731–736. doi: 10.1177/001872089303500411. [DOI] [PubMed] [Google Scholar]
- Bassey EJ, Fentem PH, MacDonald IC, Scriven PM. Self-paced walking as a method for exercise testing in elderly and young men. Clinical Science and Molecular Medicine. 1976;51:609–612. doi: 10.1042/cs0510609. [DOI] [PubMed] [Google Scholar]
- Brinckmann P, Hoefer H, Jongen H. Sex differences in the skeletal geometry of the human pelvis and hip joint. Journal of Biomechanics. 1981;14:427–430. doi: 10.1016/0021-9290(81)90060-9. [DOI] [PubMed] [Google Scholar]
- Campbell AJ, Reinken J, Allan BC, Martinez GS. Falls in old age: a study of frequency and related factors. Age and Ageing. 1981;10:264–270. doi: 10.1093/ageing/10.4.264. [DOI] [PubMed] [Google Scholar]
- Carlsöö S. A method for studying walking on different surfaces. Ergonomics. 1962;5:271–274. [Google Scholar]
- Cooper JM, Glassow RB. Kinesiology. Mosby; New York: 1963. [Google Scholar]
- Courtney TK, Sorock GS, Manning DP, Collins JW, Holbein-Jenny MA. Occupational slip, trip, and fall-related injuries - can the contribution of slipperiness be isolated? Ergonomics. 2001;44:1118–1137. doi: 10.1080/00140130110085538. [DOI] [PubMed] [Google Scholar]
- Gillis B, Gilroy K, Lawley H, Mott L, Wall JC. Slow walking speeds in healthy young and elderly females. Physiotherapy Canada. 1986;38:350–352. [Google Scholar]
- Grönqvist R, Roine J, Jarvinen E, Korhonen E. An apparatus and a method for determining the slip resistance of shoes and floors by simulation of human foot motions. Ergonomics. 1989;32:979–995. doi: 10.1080/00140138908966859. [DOI] [PubMed] [Google Scholar]
- Hanson JP, Redfern MS, Mazumdar M. Predicting slips and falls considering required and available friction. Ergonomics. 1999;42:1619–1633. doi: 10.1080/001401399184712. [DOI] [PubMed] [Google Scholar]
- Isman RE, Inman VT. Anthropomeric studies of the human foot and ankle. Bulletin of Prosthesis Research. 1969;10:97–127. [Google Scholar]
- Imms FJ, Edholm OG. The assessment of gait and mobility in the elderly. Age and Ageing. 1979;8:261–267. doi: 10.1093/ageing/8.4.261. [DOI] [PubMed] [Google Scholar]
- Irvine CH. Evaluation of the effect of contact-time when measuring floor slip resistance. Journal of Testing and Evaluation. 1986;1:19–22. [Google Scholar]
- James DI. Rubber and plastics in shoe and flooring: the importance of kinetic friction. Ergonomics. 1983;26:83–99. [Google Scholar]
- Llewellyn MGA, Nevola VR. Strategies for walking on low-friction surfaces. In: Lotens WA, Havenith G, editors. Fifth International Conference on Environmental Ergonomics; Maastricht. 1992. pp. 156–157. [Google Scholar]
- Lockhart TE. The ability of elderly people to traverse slippery walking surfaces. Human Factors and Ergonomics Society 41st Annual Meeting; Santa Monica, CA: Human Factors and Ergonomics Societies; 1997. pp. 125–129. [Google Scholar]
- Lockhart TE. Ph.D. Dissertation. Texas Tech University; 2000. Effects of musculoskeletal and sensory degradation due to aging on the biomechanics of slips and falls. [Google Scholar]
- Lockhart TE, Smith JL, Woldstad JC, Lee PS. Effects of musculoskeletal and sensory degradation due to aging on the biomechanics of slips and falls. 14th congress of the IEA and the 44th Annual Meeting of the HFES; Santa Monica, CA: Human Factors and Ergonomics Society; 2000a. pp. 83–86. [Google Scholar]
- Lockhart TE, Woldstad JC, Smith JL, Hsiang SM. Prediction of falls using a robust definition of slip distance and adjusted required coefficient of friction. 14th congress of the IEA and the 44th Annual Meeting of the HFES; Santa Monica, CA: Human Factors and Ergonomics Society; 2000b. pp. 506–509. [Google Scholar]
- MacKinnon CD, Winter DA. Control of whole body balance and posture in the frontal plane during human walking. Journal of Biomechanics. 1993;26:633–644. doi: 10.1016/0021-9290(93)90027-c. [DOI] [PubMed] [Google Scholar]
- Murray MP, Kory RC, Clarkson BH. Walking patterns in healthy old men. Journal of Gerontology. 1969;24:169–178. doi: 10.1093/geronj/24.2.169. [DOI] [PubMed] [Google Scholar]
- Myung R, Smith JL, Leamon TB. Slip distance for slip/fall studies. In: Kumar S, editor. Advances in Industrial Ergonomics and Safety IV. Taylor & Francis; London: 1992. pp. 983–987. [Google Scholar]
- National Safety Council . Accidents Facts 1998 edition. Author; Itasca, IL: 1998. [Google Scholar]
- Pai YC, Patton J. Center of mass velocity-position predictions for balance control. Journal of Biomechanics. 1997;30:347–354. doi: 10.1016/s0021-9290(96)00165-0. [DOI] [PubMed] [Google Scholar]
- Perkins PJ. Measurement of slip between the shoe and ground during walking. 1978:71–87. [Google Scholar]
- Perkins PJ, Wilson MP. Slip resistance testing of shoes-new developments. Ergonomics. 1983;26:73–82. [Google Scholar]
- Redfern MS, Andres RO. The analysis of dynamic pushing and pulling; required coefficients of friction. 1984 International Conference on Occupational Ergonomics; Rexdale, Ontario: Human Factors Association of Canada; 1984. pp. 569–572. [Google Scholar]
- Rubenstein LZ, Robbins AS, Schulman BL, Rosado J, Osterweil D, Josephson KR. Falls and instability in the elderly. Journal of the American Geriatrics Society. 1988;36:266–278. doi: 10.1111/j.1532-5415.1988.tb01811.x. [DOI] [PubMed] [Google Scholar]
- Saunders JBDM, Inman VT, Eberhart HD. The major determinants in normal and pathological gait. J. Bone It. Surg. 1953;35-A:543–558. [PubMed] [Google Scholar]
- Soames RW, Richardson RPS. Stride length and cadence: Their influence on ground reaction forces during gait. In: Winter DA, et al., editors. Biomechanics IX. Human Kinetics Publisher; Champaign, IL: 1985. pp. 406–410. [Google Scholar]
- Winer BJ, Brown DR, Michels KM. Statistical Principles in Experimental Design. 3rd. edn McGraw-Hill; New York, NY: 1991. [Google Scholar]
- Winter DA. The Biomechanics and Motor Control of Human Gait: Normal, Elderly and Pathological. 2nd edn. University of Waterloo Press; Waterloo, Canada: 1991. pp. 87–94. [Google Scholar]
- Winter DA, Patla AE, Frank JS, Walt SE. Biomechanical walking pattern changes in the fit and healthy elderly. Phys. Ther. 1990;70:340–347. doi: 10.1093/ptj/70.6.340. [DOI] [PubMed] [Google Scholar]
- You JY, Chou YL, Lin CJ, Su FC. Effects of slip on movement of body centre of mass relative to base of support. Clinical Biomechanics. 2001;16:167–173. doi: 10.1016/s0268-0033(00)00076-0. [DOI] [PubMed] [Google Scholar]


