Abstract
In this paper, we present a semi-automated segmentation method for magnetic resonance images of the quadriceps muscles. Our method uses an anatomically anchored, template-based initialization of the level set-based segmentation approach. The method only requires the input of a single point from the user inside the rectus femoris. The templates are quantitatively selected from a set of images based on modes in the patient population, namely, sex and body type. For a given image to be segmented, a template is selected based on the smallest Kullback–Leibler divergence between the histograms of that image and the set of templates. The chosen template is then employed as an initialization for a level set segmentation, which captures individual anatomical variations in the image to be segmented. Images from 103 subjects were analyzed using the developed method. The algorithm was trained on a randomly selected subset of 50 subjects (25 men and 25 women) and tested on the remaining 53 subjects. The performance of the algorithm on the test set was compared against the ground truth using the Zijdenbos similarity index (ZSI). The average ZSI means and standard deviations against two different manual readers were as follows: rectus femoris, 0.78 ± 0.12; vastus intermedius, 0.79 ± 0.10; vastus lateralis, 0.82 ± 0.08; and vastus medialis, 0.69 ± 0.16.
KEY WORDS: Osteoarthritis, MRI, muscle segmentation, templates, level sets
Introduction
Osteoarthritis (OA) is the most common form of arthritis,1 with an incidence in one or more joints of up to 90% in persons over the age of 65.2 The pain and reduced mobility caused by advancing OA is a major cause of concern for both the aging population and the healthcare system. OA is characterized by degeneration of the articular cartilage with concomitant cartilage repair and remodeling, subchondral bone sclerosis (hardening), and osteophyte (bone spur) and bone cyst formation.2 Clinical signs and symptoms that may accompany these joint changes include joint pain, effusion, crepitus, movement restriction, and gait abnormalities. Currently, the diagnosis of OA is based largely on an overall clinical picture, integrating patient presentation (joint pain) with laboratory (erythrocyte sedimentation rate and synovial fluid evaluation) and radiographic (joint space narrowing on X-ray) studies.3 However, the nature of the disease has been difficult to delineate beyond a symptomatic or morphologic presentation.
Known risk factors for knee OA, derived mainly from cross-sectional studies, include obesity, previous knee injury, selected forms of physical activity, and a family history of the disease. One potential risk factor that has not been particularly well-explored is the role of the quadriceps in knee OA. A recent study has demonstrated an association between quadriceps weakness (as measured by isometric strength) and knee OA in 2,472 subjects age 60 years and older.4 However, this study did not investigate cross-sectional area (CSA) of the quadriceps. Hence, it does not help elucidate the relationship between muscle weakness and muscle size, the neuromuscular system, pain, or a combination of these factors. There have also been longitudinal studies that have suggested that quadriceps weakness is a risk factor for incident OA of the knee.5,6
Interestingly, it has been shown in at least one study that obesity, knee injury, and level of physical activity influence incidence of OA more than its radiographic progression.7 However, the application of magnetic resonance imaging (MRI) to the study of OA offers information about the entire joint not readily available in simple radiographs. Recent studies have shown that a decrease in anatomical and physiological muscle CSA measured on MRI is related to loss of strength.8,9 In addition, the measurement of quadriceps muscle volume from both serial and single-slice MRI studies has been shown to be reliable in adult males.10 Therefore, the analysis of anatomical measurements of the quadriceps muscles on MRI, coupled with strength measurements, may allow for an improved understanding of the functional relationships between loss of strength, reduction in quadriceps CSA, and clinical symptoms of OA. Such information could be extremely useful in devising novel prevention and treatment strategies.
Collectively, recent literature has provided the motivation to begin investigating the quadriceps and to determine if there is an association between CSA and extent of knee OA in data sets with a large cohort of subjects. Previous work in image analysis of OA of the knee has focused mainly on cartilage. Semi-automated methods for segmentation of the cartilage have been developed using methods for initial point selection/curve refinement, such as active contours,11–14 and edge-tracking procedures, such as livewire.15,16 With respect to muscle segmentation, the common practice is to trace the muscles using a light pen, trackball, or mouse-controlled pointer.17 Some computer-assisted segmentation methods have also been developed to segment muscles.18 In these methods, edge detection methods and watershed are used to segment muscles, which need to be verified by human readers and modified. These methods are surely inefficient when it comes to segmenting individual components of the quadriceps muscles. Although there is some work in segmentation of some components from CT images where the intensity values are standardized to Hounsfield units,19 to the best of the authors’ knowledge, there has been no previous work performed on the (semi)-automated segmentation of the individual quadriceps muscles from MR images. Initial experiments for the current work were performed with livewire segmentation; however, the results of the segmentations were extremely poor qualitatively (i.e., visually), so this method was not pursued further.
Our study describes a method of semi-automatically segmenting the four quadriceps muscles—rectus femoris (RF), vastus intermedius (VI), vastus lateralis (VL), and vastus medialis (VM)—which can be used to facilitate the discovery and characterization of imaging biomarkers of OA. The method is based on templates quantitatively determined as representative of a subpopulation of subjects to be segmented, followed by a level set-based contour evolution on pre-processed images to capture anatomical variations in a specific subject.
Data
Data were obtained from the Osteoarthritis Initiative (OAI) database, available for public access at http://www.oai.ucsf.edu/.20 The study has enrolled 4,796 volunteers from ages 45 to 79, with 42% men and 58% women and 20% ethnic minorities. Each volunteer undergoes a series of clinical, biochemical, genetic and imaging procedures during an enrollment visit. They then participate in annual follow-up visits for a period of 4 years, with the same tests performed at each visit similar to enrollment. Specific datasets used were from version 0.B.2 of the OAI release. T1-weighted axial MRI scans of the thigh, approximately 17 cm proximal to the medial femoral epiphysis of the right knee, were analyzed (Table 1). The images were 512 × 256 pixels. Images and corresponding clinical scores (KL grades21) were available for 103 subjects from the baseline OAI study (Table 2); hence, these were the only data used for the development of the algorithm. There were 53 men and 50 women, with a mean age of 61.2 years (Table 2).
Table 1.
Protocol Parameters for Acquisition of Thigh MRIs
| Weighting | T1 lnt |
|---|---|
| Plane | Axial |
| Number of slices | 15 |
| Field of view (mm) | 500 |
| Slice thickness (mm) | 5 |
| Skip (mm) | 0 |
| TE/TI (ms) | 13 |
| TR (ms) | 600 |
| X-resolution (mm) | 0.977 |
| Y-resolution (mm) | 0.977 |
| Gray levels (bits/pixel) | 16 |
Table 2.
Subject Information for Total Sample Population, Training Set, and Testing Set
| Total | Train | Test | |
|---|---|---|---|
| Number of subjects | 103 | 50 | 53 |
| Age | |||
| Mean | 61.2 | 61.6 | 60.8 |
| Standard deviation | 10.2 | 10.4 | 10.1 |
| Sex | |||
| Male | 53 | 25 | 28 |
| Female | 50 | 25 | 25 |
| Ethnicity | |||
| Caucasian | 85 | 40 | 45 |
| African American | 16 | 10 | 6 |
| Asian | 1 | 0 | 1 |
| Other non-white | 1 | 0 | 1 |
| KL grade | |||
| 0 | 11 | 6 | 5 |
| 1 | 19 | 10 | 9 |
| 2 | 34 | 15 | 19 |
| 3 | 35 | 17 | 18 |
| 4 | 4 | 2 | 2 |
The algorithm was developed using a randomly selected training dataset of 50 subjects (25 male and 25 female) from the full dataset of 103 subjects. The subjects selected for this training set were verified as representative of the entire population of patients with respect to age, body mass index, and severity of OA (using the KL grade). All methodology parameters were experimentally optimized for this training subset.
Methodology
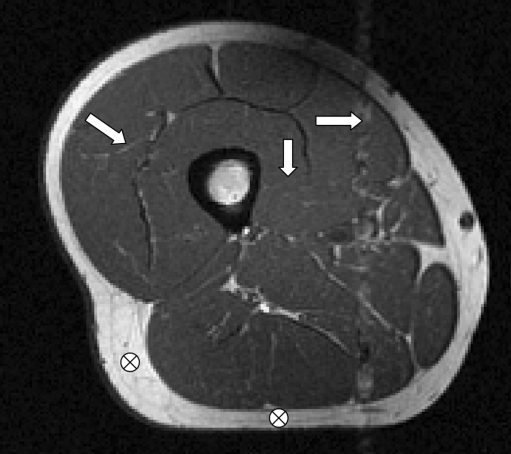
Segmentation of the quadriceps muscles from MR images is challenging due to lack of delineating landmarks between muscle subgroups, the presence of intramuscular adipose and connective tissue with high contrast, acquisition artifacts caused by arterial flow, and non-uniformity due to bias fields (Fig. 1)22. Such problems make the use of simple segmentation procedures, such as thresholding, unfeasible.
Fig 1.
Image showing features which cause segmentation difficulties: lack of delineating landmarks (vertical arrow), high contrast intramuscular adipose tissue (diagonal arrow), flow artifacts (horizontal arrow), and bias fields (marks showing low and high intensity subcutaneous fat regions, which should be same intensity).
The multistep method that we propose herein utilizes templates to model basic anatomical structures and then employs a level-set procedure to capture anatomical variations in each subject (Fig. 2).
Fig 2.
Diagram of the segmentation pipeline.
Image Pre-processing for Template Selection
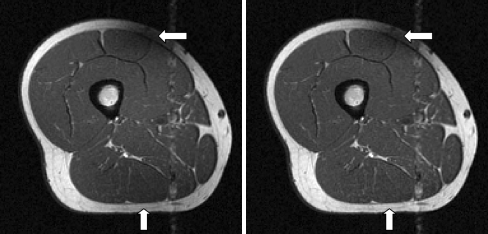
The first step in the algorithm was a pre-processing of the images to standardize the MR image intensities. The standardization of MR image intensities across subjects with images acquired at different times and at different sites was important for the consistent application of the developed algorithm. Intensity standardization was achieved through a two-step process (Fig. 3):
Correction of the slowly varying multiplicative bias field created by magnetic field inhomogeneities using the nonparametric, nonuniform intensity normalization (N3) algorithm described in Sled et al.23 Other methods attempted for bias field correction included homomorphic filtering and entropy-based intensity correction; on visual examination, these methods did not perform as well as the N3 algorithm.
Scaling of the bias-field corrected images to [0,1]. Outliers were removed from the scaling operation and instead scaled directly to one. Multiple values for percentage of truncated intensities were tested—0.05%, 0.1%, 0.5%, 1%, and 5%. It was determined that only a small percentage of outliers needed to be removed for the consistent calculation of KL divergence between image histograms in the template matching step (described later). Therefore, a value of 0.05% was used.
Fig 3.
Original image (left) and N3-corrected image (right). Note the intensity correction of the subcutaneous fat (vertical arrow); however, the artifact due to the RF coil is not completely removed (horizontal arrow).
Bias field correction followed by intensity scaling for use in intensity standardization follows the order suggested in Madabhushi and Udupa.24
Template Selection
The selection of the images to use as templates, along with the selection of the proper template to use for segmentation of a given image, is an important initial step for the successful final segmentation of the quadriceps muscles by level set contour evolution. There is a large variation in the images to be segmented due to sex and body type. Therefore, we employed a set of templates based on sex and body type to more accurately initialize the segmentation process. Initially, thigh shape was taken as a criterion for template selection. The results turned out to be unacceptable. It was then found that the use of an automatically derived affine transformation (described later) allowed the shapes of templates and the images to be segmented to be well-matched. The quantification of body type was instead calculated using a muscle/fat ratio, described below.
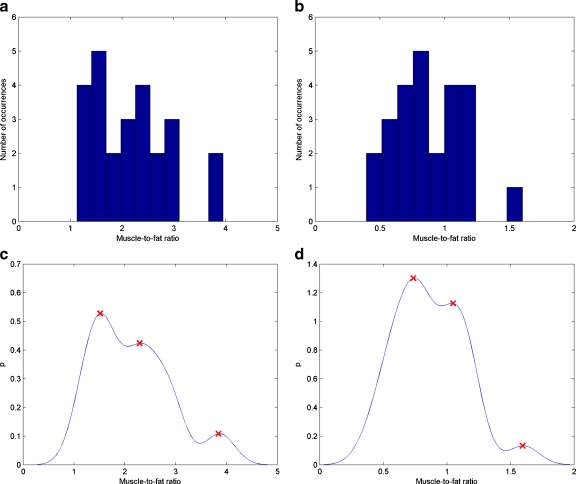
The training set was used for selection of images to be used as templates. First, the training set was separated by sex. The intensity histogram of the thigh region of interest was then generated for each image. The intensity histograms each consisted of two modes: a low-intensity mode, which corresponded to muscle, and a high-intensity mode, which corresponded to fat. The modes were separated by employing an experimentally determined optimal threshold of 0.45. This value was determined in previous work with the same dataset, which analyzed the optimal intensity threshold for separating intramuscular fat from lean muscle.25 The ratio of muscle/fat pixels was then calculated for each image. The results were used to generate a ten bin histogram of muscle/fat ratios for each sex (Fig. 4). The use of ten bins allowed for significant collections of similar muscle/fat ratios to be included in a single bin while retaining the contrast between subjects with qualitatively (i.e., visually) different body types. The intensity probability density function was then estimated by kernel density estimation26,27
 |
1 |
where n was set to the number of histogram bins, the kernel K was Gaussian with a bandwidth h equal to the width of the histogram bins, and Xj was the value of data point j.
Fig 4.
Histograms of muscle/fat ratios for a male and b female subjects in training set and corresponding kernel smoothed density estimations showing probability p of muscle/fat ratios of c male and d female subjects, with modes marked with x.
The modes of the smoothed histograms were calculated by identifying local maxima. The number of modes detected corresponded to the number of different templates used for each sex. For both men and women, three templates corresponding to three maxima were used. Three representative images with muscle/fat ratios closest to each mode were then selected as templates.
Registration of Template to Image
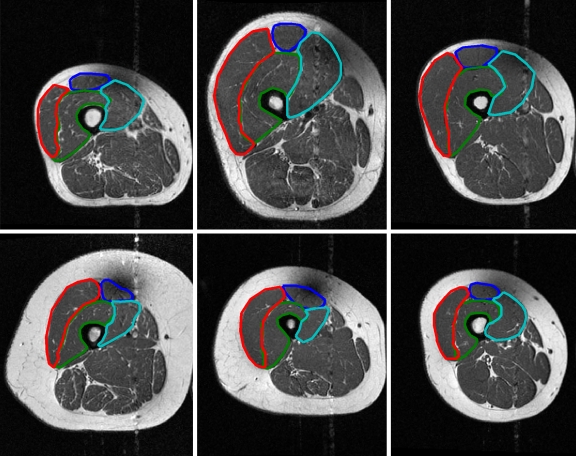
There were a total of six templates used, three each for men and women (Fig. 5). Histograms were employed to compare template images to the image to be segmented. Background pixels were removed. The number of bins in each histogram was set to 100, a value experimentally determined to be adequate for comparisons of the templates and the image to be segmented. For typical MR values, this number was a good choice to allow both (1) gray-level variation between different organs and tissues in the image and (2) manageable computations, considering that the original gray levels would result in 216 bins. The normalized histograms were used to select the proper template by calculating the Kullback–Leibler (K-L) divergence, Di(p,qi) between the image’s normalized histogram p, and each template’s normalized histogram qi, i = 1,2,3.28
 |
2 |
The template corresponding to the lowest divergence was chosen as the template to be used for the segmentation  .
.
Fig 5.
Template images for each sex with differing relative fat/muscle content. Top row Male, bottom row female, left column low muscle/fat, center column medium muscle/fat, right column large muscle/fat. The manual segmentations are also shown: blue RF, green VI, red VL, cyan VM.
The selected template  was then aligned to the image under consideration, I by an affine registration using landmark points,29 which were extracted from
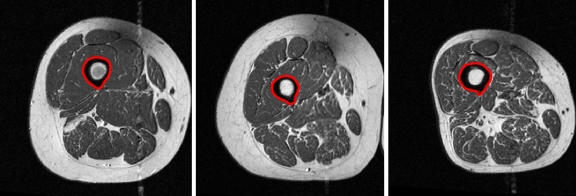
  and I automatically. An affine registration of the template was appropriate as thighs tend to be of different sizes, but the shapes tend to be circular or elliptical. Therefore, both scaling and skewing were important operations for the registration. The first landmark point, the centroid of the femur, was extracted by locating the femur medulla (a high intensity circular region) and expanding the contour encapsulating that region to include the cortex (a low intensity region surrounding the medulla) using the method described in Prescott et al.30 (Fig. 6). Two test subjects had errors in the segmentation of the femur; therefore, manual femur segmentations were substituted.
Fig 6.
Results of the femur segmentation algorithm for three different subjects.
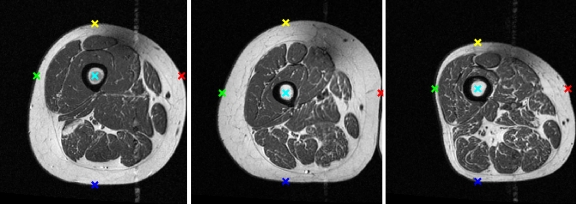
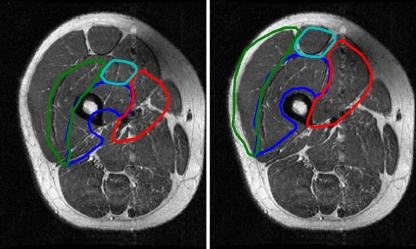
Using the segmented femur region, four points lying on the boundary of the thigh were identified along the horizontal and vertical axes extending from the femur centroid (Fig. 7). The resulting five points (femur centroid and four thigh boundary points) in each image were used to calculate the affine transformation. Muscle contours of the quadriceps muscles of  were then transformed into the coordinate space of I by this affine transformation (Fig. 8). These contours were used as initializations for the quadriceps level set segmentations.
Fig 7.
Fiducial points automatically extracted using femur centroid as origin.
Fig 8.
Template contours before (left) and after (right) registration.
Image Pre-processing for Segmentation
The images were pre-processed to improve the segmentation accuracy. However, these pre-processing steps also affected the histogram of the image, which was important for appropriate template selection. Therefore, pre-processing was performed after template selection.
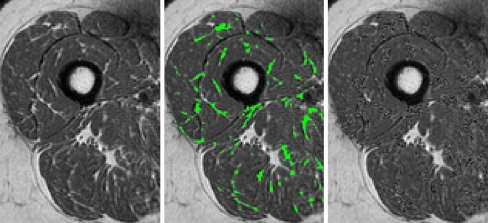
The first step was the reduction of intramuscular fat and connective tissue (Fig. 9). These tissue types appeared as thin, high-intensity lines within the muscle and caused high-gradient regions within the thigh.31 The edge-based level set segmentation was adversely affected by the presence of the strong edges produced by the high-gradient boundaries of the intramuscular fat, creating local optima. Regions of intramuscular fat were located by first thresholding the image using an intensity level of 0.45 (the same as for the muscle/fat ratio calculations) and then performing a morphological skeletonization on the resulting binary image. Regions which retained 40% or more of their area (in pixels) after skeletonization were deemed to correspond to areas of intramuscular fat or connective tissue. The pixels in these areas were replaced with random pixels generated from a normal distribution with the same mean and variance as muscle in the rest of the image. For further analysis of these threshold values, the interested reader is referred to Prescott et al.25
Fig 9.
Example of intramuscular fat extraction and replacement. Original image (left), image with detected intramuscular fat in green (center) and image with intramuscular fat replaced by random pixels of same mean and standard deviation as muscle (right).
An anisotropic diffusion filter was then applied to the image.32 This filter smoothed regions of near-homogeneous intensity while enhancing edges between contrasting regions. The background was then removed by a combination of thresholding and morphological operations. An experimentally determined threshold of 0.15 was employed as an initial estimate for pixels corresponding to background. This value was found to provide good visual separation of the background over the entire training set. However, in some instances the threshold would remove areas corresponding to the RF coil artifact. These areas were retained by performing morphological closing with a 3 × 3 square structuring element and filling in the holes created by this process. Therefore, the final background that was removed from further processing was a combination of a standardized intensity threshold and morphological operations.
The femur was removed using the region previously generated for the extraction of fiducial points for registration. This inhibited the faulty segmentation of the femur cortex as part of the quadriceps muscles due to the high gradient at the boundary of the cortex and medulla. Finally, the normalized images were scaled to a range of [0, 3,000]. This allowed for a more consistent gradient map, which was important for the edge-based evolution of the level set.
Segmentation
The segmentation was performed using a multiphase level set evolution, consisting of a contraction phase followed by an expansion phase. The multiphase method employed the level set without re-initialization approach described in Li et al.,33, with anatomically anchored modifications. The first modification was the use of separate phases in the segmentation—a contour contraction phase followed by an expansion phase. The use of this multiphase level set evolution was important, as the initial template registration may not have aligned the contours to be completely inside or outside the muscle of interest. The second modification consisted of a morphological cleanup between the two phases, which facilitated removal of erroneously segmented regions of subcutaneous fat and connective tissue.
The initial level set, ϕ0, for each muscle was generated from the registered template contour.
 |
3 |
where Ω was the domain of the level set function, Ω0 was the area contained within the contour of the zero level set, and  was the zero level set. The level set evolution equation was
 |
4 |
where μ, λ, and υ were constant weighting coefficients for the terms in the evolution equation, Δ was the Laplacian operator, and δ(ϕ) was the Dirac delta of the level set function. The edge indicator function g used to control the contour evolution was calculated as
 |
5 |
where Gσ was a 3 × 3 Gaussian smoothing kernel with standard deviation σ = 0.5.
Segmentation of the RF produced challenges due to its small size relative to the other quadriceps muscles and its highly variable location with respect to the femur, which was the main anchor point used for the initial registration of the template contours. Therefore, the initial level set for the RF was positioned using a single, user-selected point corresponding to the centroid of the RF. The initial RF contour from the template was centered at the user-defined centroid location. The level set segmentation was then performed using the newly positioned RF as the initial level set function.
The contraction phase was performed by setting the α parameter to a value greater than zero. The value of α was muscle-dependent, and it was experimentally determined to be 0.8 for VI, VL, and VM muscles. It was found that, because of the small size of the RF, a more vigorous contraction (created by a greater magnitude α) could possibly cause the contour to collapse to nothing. Therefore, the value of α was selected to be 0.5 for RF.
Following the contraction phase, the contour was filtered to remove high-intensity pixels along the borders, which corresponded to fat and connective tissue. Morphological erosion was then performed, using a square 3 × 3 structuring element, in order to shrink the contour so as to be contained within the muscle being segmented. The expansion phase was performed by setting the α parameter to a value less than zero. Again, the value was set to be muscle dependent. For the RF and VL, its value was set to −2; for the VI and VM, its value was set to −1.5.
The evolution of the contours was subjected to stopping conditions, which were based on anatomical statistics calculated from the training set (Table 3). The mean areas of each of the four quadriceps muscles were used to define minimum and maximum areas for the evolving contours. The minimum/maximum areas were calculated as mean ± 2 standard deviations for each muscle. In addition to the anatomical stopping conditions, the contraction phase was limited to a maximum of 200 iterations, while the expansion phase was limited to 300 iterations.
Table 3.
Mean and Standard Deviation of the Area of Each Muscle, Stratified by Sex, from the Training Set
| Muscle | Mean area (standard deviation) (pixels) | |
|---|---|---|
| Male | Female | |
| RF | 561 (189) | 470 (221) |
| VI | 2,185 (471) | 1,685 (399) |
| VL | 2,261 (534) | 1,744 (440) |
| VM | 1,958 (433) | 1,124 (379) |
Segmentation Post-processing
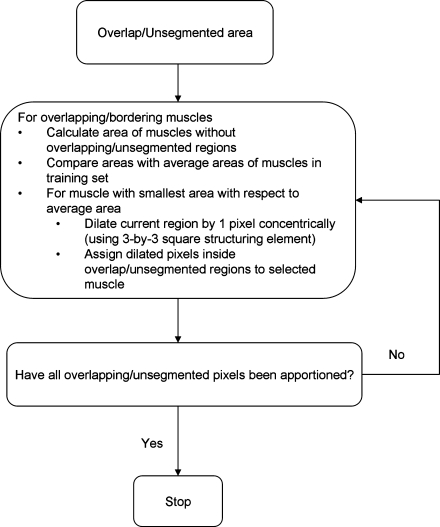
The muscle segmentations were further refined after completion of the level set segmentation (Fig. 10). First, muscle segmentations that overlapped were iteratively split between the overlapping muscles. Pixels were assigned to each muscle depending on which muscle was smallest with respect to its average size in the training set of images. Second, regions of muscle that were not segmented but were most likely part of the quadriceps muscles were assigned to adjacent muscles in the same way that overlap regions were split. These unsegmented regions of quadriceps muscles were detected by their position in the thigh and proximity to the current segmentations of the quadriceps muscles.
Fig 10.
Post-processing algorithm for apportionment of overlapping/unsegmented muscle pixels.
Figure 11 shows a working example of the segmentation procedure from initial template contour alignment on a pre-processed image through the final post-processing step.
Fig 11.
Segmentation example from initial template contour alignment through post-processing.
Results
Two readers performed manual segmentations for the entire dataset of 103 subjects, and the manual segmentations were performed by third year medical students with extensive anatomical knowledge and further training by a sports medicine professor (TMB). These manual segmentations were then compared to the automated segmentations. Overall performance of the segmentation method was evaluated with the Zijdenbos similarity index (ZSI),34 a measure of agreement derived as a special case from the kappa statistic, between automated and manual segmentations of the muscles.
 |
where A and M are the binary masks of the automated and manual segmentations, respectively. It is generally accepted in the medical image analysis community that ZSI values greater than 0.7 represent “excellent” agreement.34,35
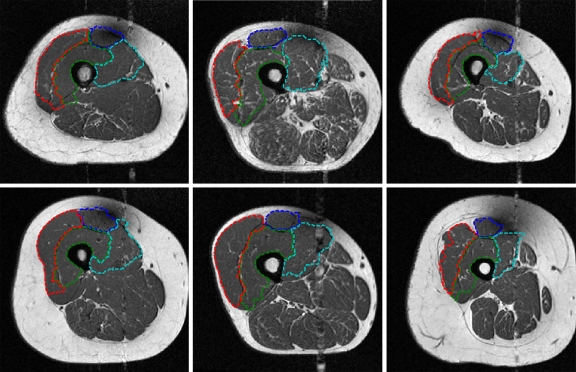
The results for the complete training and testing sets are shown in Table 4. Examples of automated segmentations for six different subjects are shown in Figure 12, along with their corresponding ZSIs in Table 5.
Table 4.
ZSI Means and Standard Deviations of Automatic Segmentation vs. Manual Segmentations for the Training and Testing Datasets
| Muscle | ZSI mean (standard deviation) | |
|---|---|---|
| Reader 1 | Reader 2 | |
| Train | ||
| RF | 0.79 (0.10) | 0.80 (0.10) |
| VI | 0.79 (0.08) | 0.79 (0.08) |
| VL | 0.82 (0.09) | 0.82 (0.09) |
| VM | 0.68 (0.16) | 0.68 (0.14) |
| Test | ||
| RF | 0.78 (0.12) | 0.78 (0.13) |
| VI | 0.79 (0.10) | 0.79 (0.10) |
| VL | 0.82 (0.08) | 0.82 (0.08) |
| VM | 0.69 (0.16) | 0.69 (0.16) |
Fig 12.
Automated segmentation results from six different subjects. Note the ability of the algorithm to capture large variations in positioning and shape of the quadriceps muscles.
Table 5.
ZSIs for Segmentations in Figure 12
| Image | RF | VI | VL | VM |
|---|---|---|---|---|
| (a) | 0.81 | 0.82 | 0.74 | 0.81 |
| (b) | 0.91 | 0.86 | 0.90 | 0.88 |
| (c) | 0.86 | 0.88 | 0.83 | 0.82 |
| (d) | 0.91 | 0.82 | 0.91 | 0.70 |
| (e) | 0.85 | 0.86 | 0.91 | 0.88 |
| (f) | 0.87 | 0.83 | 0.85 | 0.70 |
Additional tests of the algorithm were undertaken to demonstrate the necessity of each step in processing and robustness to differences in parameter values.
The standardization of the image intensities and pre-processing of the image to be segmented in preparation for the level set segmentation were important steps for the effective performance of the algorithm. Table 6 shows results from the algorithm for the training set compared against the manual segmentations of reader 1 if no processing of the images is used. It can be seen that the segmentation of the RF is significantly affected, while that of the VI and VL are also affected, albeit less significantly.
Table 6.
ZSI Means and Standard Deviations of Automatic Segmentation vs. Manual Segmentations of Reader 1 for the Training Dataset When No Bias-Field Correction or Pre-processing of the Images is Performed
| Muscle | ZSI mean (standard deviation) |
|---|---|
| RF | 0.73 (0.13) |
| VI | 0.78 (0.08) |
| VL | 0.81 (0.08) |
| VM | 0.68 (0.16) |
Tests were performed to quantify the effect of a poorly selected initial point for the RF. The user selected points were randomly perturbed by ±2 in both the x and y directions. These newly generated poorly selected points were then used for the initial location of the RF. It was found that the overall performance of the algorithm was unaffected by these perturbations. Therefore, the algorithm is robust to poorly selected initializations for the RF.
Varying the value of α for the contraction and expansion phases demonstrated that the magnitude of alpha did not have as much effect as the sign. The values were varied from 0.01 to 1.3 for the contraction phase and from −1 to −2.5 for the expansion phase, with the final performance of the algorithm being unaffected by the different values. Therefore, the algorithm is robust to variations in the value of α.
Discussion
The automated segmentation algorithm developed in this paper performs well for each of the four quadriceps muscles. The performance of the algorithm for the RF, VI, and VL muscles was within the range of “excellent” agreement for both manual readers, while the performance for VM was just short of excellent agreement.28 These levels of agreement demonstrate the robustness of the algorithm despite the significant anatomical variability (e.g., body type) that was seen among subjects in the OAI study.
Some variation in the algorithm’s performance for the individual muscles was observed. The segmentations of the RF, VI, and VL were generally more accurate than the segmentations of the VM. This may be due to the relative consistency of the shape of the RF, VI, and VL muscles when compared to the VM. In addition, the VI and VL muscles were each bordered on one side by a fairly consistent anatomy: the femur in the case of the VI and the subcutaneous fat for the VL. The subcutaneous fat bordering the VM was not as consistent due to the RF coil artifact, and so this muscle’s segmentation did not benefit from this anatomy.
The performance of the algorithm needs to be further improved for the VM. The lower performance of the automated algorithm on VM may be explained by the difficulties in anatomical delineation from surrounding muscles. On the other hand, differences in shape and surrounding musculature are not adequate to explain the difficulties in automated segmentation of the RF.
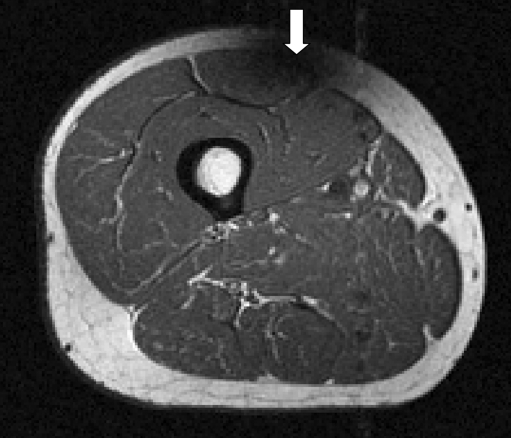
Preprocessing of the images, specifically the N3 correction of the bias field, was not able to adequately remove the RF coil artifact (Fig. 13). In fact, further preprocessing of the image by anisotropic diffusion may have also accentuated the sharp, high-frequency edge of this artifact. Therefore, creation of an incorrect, high gradient edge could have caused the evolution of the level-set contour to be inhibited from the correct edge. An attempt to correct the artifact through a localized multiplicative bias field was unsuccessful. This was mainly due to the complete loss of intensity information due to the artifact such that no appropriate correction field could be found, which would offer consistent results among all subjects. The variability of the RF location coupled with its small size causes a significant challenge in the positioning of the initial contour for the completely automated level set segmentation.
Fig 13.
Example of image with sharp intensity attenuating artifact near RF (white arrow).
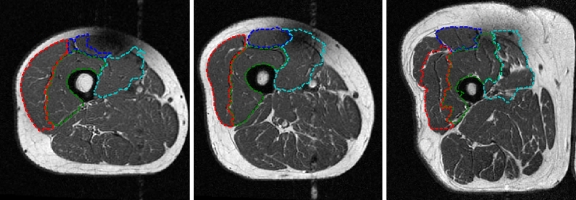
Examples of subjects on whom the algorithm performed poorly are shown in Figure 14. These figures exhibit some of the main problems that can cause inadequate segmentations, such as significant acquisition artifacts and extreme anatomical variation. In Fig. 14a, the poor algorithm performance is due mainly to the extreme acquisition artifact near the RF. The result is an under-segmentation of the RF. The signal information lost in this image could not be retrieved using the N3 algorithm, and development of further bias field correction techniques was outside the scope of this work. In Fig. 14b the acquisition artifact again causes problems, but in this case the effect is more on the VM, causing an inappropriate expansion of the level set contour to include the dark region as muscle. In Fig. 14c, the substantial anatomical variation in this image causes inappropriate segmentations of the VI, VL, and VM.
Fig. 14.
Examples of poor automated segmentations, most likely due to a artifact, causing undersegmentation of RF, b artifact, causing oversegmentation of VM, and c extreme anatomical variation, creating faulty segmentations of VI, VL, and VM.
A long-term goal of our work is a quantitative analysis of the entire knee joint, combining imaging, clinical scores, symptoms, demographics, genetics, etc., into a predictive model of factors related to OA of the knee. The analysis of the quadriceps from MRI was felt to be an important step toward this long-term goal. The (semi)-automated segmentation of the images is important for efficient and accurate analysis of the images obtained from large data sets for current research purposes and also for future dissemination of results for use by researchers and clinicians.
The described general framework for segmentation (population modal analysis and selection of representative templates plus level sets for capturing anatomical variation) will be very useful for other segmentation problems that are currently being addressed (muscle, bone, meniscus, and cartilage). It is true that some of the parameters (e.g., α in the level set procedure) will need to be adjusted for new applications. However, even with the adjustment of parameters, the combination of population-representative templates with individual-specific level sets variation is a powerful method of general medical image segmentation. Future refinement of the segmentation algorithms will consist of temporal analysis of cases, implementation of more refined level set procedures, which incorporate more information than just the image gradients, and improvement of the registration accuracy and the application of active shape models, or comparable methods, for template generation, which will allow for even more robust handling of significant anatomical variations between subjects.
Conclusion
We have presented a semi-automated method of segmenting each of the quadriceps muscles from MR images. The method uses a novel template-based level-set technique. Performance of the developed segmentation algorithm was compared with manual segmentations, and a promising agreement was observed. This work will enable researchers to further explore the relationship between individual muscles of the quadriceps and risk for progression of OA. Moreover, novel treatment and prevention programs may be possible based on a continuation of this work and investigation of a larger number of subjects over a period of time.
Acknowledgments
This project was supported in part by Award Number R01LM010119 from the National Library of Medicine. The content is solely the responsibility of the authors and does not necessarily represent the official views of the National Library of Medicine or the National Institutes of Health. The OAI is a public–private partnership comprised of five contracts (N01-AR-2-2258, N01-AR-2-2259, N01-AR-2-2260, N01-AR-2-2261, and N01-AR-2-2262) funded by the National Institutes of Health, a branch of the Department of Health and Human Services, and conducted by the OAI Study Investigators. Private funding partners include Merck Research Laboratories, Novartis Pharmaceuticals Corporation, GlaxoSmithKline, and Pfizer, Inc. Private sector funding for the OAI is managed by the Foundation for the National Institutes of Health. This manuscript was prepared using an OAI public use data set and does not necessarily reflect the opinions or views of the OAI investigators, the NIH, or the private funding partners.
References
- 1.Felson DT, Lawrence RC, Dieppe PA, et al. Osteoarthritis: new insights. Part 1: the disease and its risk factors. Ann Intern Med. 2000;133:635–646. doi: 10.7326/0003-4819-133-8-200010170-00016. [DOI] [PubMed] [Google Scholar]
- 2.Buckwalter JA, Einhorn TA, Simon SR, American Academy of Orthopaedic Surgeons . Orthopaedic Basic Science Biology and Biomechanics of the Musculoskeletal System. Rosemont: American Academy of Orthopaedic Surgeons; 2000. [Google Scholar]
- 3.Kalunian K: (2007) Diagnosis and classification of osteoarthritis. UpToDate, http://www.uptodate.com/patients/content/topic.do?topicKey=~l4eaQOHX.LOG.a
- 4.Baker KR, Xu L, Zhang Y, Nevitt M, Niu J, Aliabadi P, Yu W, Felson D. Quadriceps weakness and its relationship to tibiofemoral and patellafemoral knee osteoarthritis in Chinese. Arthritis Rheum. 2004;50:1815–1821. doi: 10.1002/art.20261. [DOI] [PubMed] [Google Scholar]
- 5.Slemenda CW, Heilman DK, Brandt KD, Katz BP, Mazzuca SA, Braunstein EM, Byrd D. Reduced quadriceps strength relative to body weight: a risk factor for knee osteoarthritis in women? Arthritis Rheum. 1998;41:1951–1959. doi: 10.1002/1529-0131(199811)41:11<1951::AID-ART9>3.0.CO;2-9. [DOI] [PubMed] [Google Scholar]
- 6.Brandt KD, Heilman DK, Slemenda CW, Katz BP, Mazzuca SA, Braunstein EM, Byrd D. Quadriceps strength in women with radiographically progressive osteoarthritis of the knee and those with stable radiographic changes. J Rheumatol. 1999;26:2431–2437. [PubMed] [Google Scholar]
- 7.Cooper C, Snow S, McAlindon TE, Kellingray S, Stuart B, Coggon D, Dieppe PA. Risk factors for the incidence and progression of radiographic knee osteoarthritis. Arthritis Rheum. 2000;43:995. doi: 10.1002/1529-0131(200005)43:5<995::AID-ANR6>3.0.CO;2-1. [DOI] [PubMed] [Google Scholar]
- 8.Klein CS, Rice CL, Marsh GD. Normalized force, activation, and coactivation in the arm muscles of young and old men. J Appl Physiol. 2001;91(3):1341–1349. doi: 10.1152/jappl.2001.91.3.1341. [DOI] [PubMed] [Google Scholar]
- 9.Morse CI, Thom JM, Reeves ND, Birch KM, Narici MV. In vivo physiological cross-sectional area and specific force are reduced in the gastrocnemius of elderly men. J Appl Physiol. 2005;99(3):1050–1055. doi: 10.1152/japplphysiol.01186.2004. [DOI] [PubMed] [Google Scholar]
- 10.Morse CI, Degens H, Jones DA. The validity of estimating quadriceps volume from single MRI cross-sections of young men. Eur J Appl Physiol. 2007;100:267–274. doi: 10.1007/s00421-007-0429-4. [DOI] [PubMed] [Google Scholar]
- 11.Stammberger T, Eckstein F, Michaelis M, Englmeier KH, Reiser M. Interobserver reproducibility of quantitative cartilage measurements: comparison of B-spline snakes and manual segmentation. Magn Reson Imaging. 1999;17:1033–1042. doi: 10.1016/S0730-725X(99)00040-5. [DOI] [PubMed] [Google Scholar]
- 12.Duryea J, Neumann G, Brem MH, Koh W, Noorbakhsh F, Jackson RD, Yu J, Eaton CB, Lang P. Novel fast semi-automated software to segment cartilage for knee MR acquisitions. Osteoarthr Cartil. 2007;15(5):487–492. doi: 10.1016/j.joca.2006.11.002. [DOI] [PMC free article] [PubMed] [Google Scholar]
- 13.Solloway S, Hutchinson CE, Waterton JC, Taylor CJ. The use of active shape models for making thickness measurements of articular cartilage from MR images. Magn Reson Med. 1997;37:943–952. doi: 10.1002/mrm.1910370620. [DOI] [PubMed] [Google Scholar]
- 14.Lynch JA, Zaim S, Zhao J, Stork A, Peterfy C, Genant HK. Cartilage segmentation of 3D MRO scans of the osteoarthritic knee combining user knowledge and active contours. Proc SPIE. 2000;3979:925–35. doi: 10.1117/12.387758. [DOI] [Google Scholar]
- 15.Gougoutas AJ, Wheaton AJ, Borthakur A, Shapiro EM, Kneeland BJ, Udupa JK, Reddy R. Cartilage volume quantification via Live Wire segmentation. Acad Rad. 2004;11(12):1389–1395. doi: 10.1016/j.acra.2004.09.003. [DOI] [PubMed] [Google Scholar]
- 16.Steines D, Cheng C, Wong J, Tsai S, Napel P, Lang P. Segmentation of osteoarthritic femoral cartilage using live wire. Proc Int Soc Magn Reson Med. 2000;8:220. [Google Scholar]
- 17.Kuk J, Ross R. Measurement of body composition in obesity. In: Kushner R, Bessesen D, editors. Contemporary Endocrinology: Treatment of the Obese Patient. Totowa: Humana Press; 2007. [Google Scholar]
- 18.Mitsiopoulos N, Baumgartner RN, Heymsfield SB, Lyons W, Gallagher D, Ross R. Cadaver validation of skeletal muscle measurement by magnetic resonance imaging and computerized tomography. J Appl Physiol. 1998;85:115–122. doi: 10.1152/jappl.1998.85.1.115. [DOI] [PubMed] [Google Scholar]
- 19.Gargiulo P, Vatnsdal B, Ingvarsson P, Knútsdóttir S, Gudmundsdóttir V, Yngvason S, Helgason T. Restoration of muscle volume and shape induced by electrical stimulation of denervated degenerated muscles: qualitative and quantitative measurement of changes in rectus femoris using computer tomography and image segmentation. Artif Organs. 2008;32(8):609–613. doi: 10.1111/j.1525-1594.2008.00610.x. [DOI] [PubMed] [Google Scholar]
- 20.Nevitt MC, Felson DT, Lester G: The Osteoarthritis Initiative: Protocol for the Cohort Study, v. 1.1. June 21, 2006
- 21.Kellgren J, Lawrence J. Radiological assessment of osteoarthritis. Ann Rheum Dis. 1957;16:494–501. doi: 10.1136/ard.16.4.494. [DOI] [PMC free article] [PubMed] [Google Scholar]
- 22.Haacke EM. Magnetic resonance imaging: Physical principles and sequence design. New York: Wiley; 1999. [Google Scholar]
- 23.Sled JG, Zijdenbos AP, Evans AC. A nonparametric method for automatic correction of intensity nonuniformity in MRI data. IEEE Trans Med Imag. 1998;17(1):87–97. doi: 10.1109/42.668698. [DOI] [PubMed] [Google Scholar]
- 24.Madabhushi A, Udupa JK. Interplay between intensity standardization and inhomogeneity correction in mr image processing. IEEE Trans Med Img. 2005;24(5):561–576. doi: 10.1109/TMI.2004.843256. [DOI] [PubMed] [Google Scholar]
- 25.Prescott JW, Priddy M, Swanson MS, Haq F, Best TM, Powell K, Jackson R, Gurcan MN: An Automated Method for Intramuscular Fat Detection in Quadriceps Muscles for Osteoarthritis Diagnosis. EMBC 2009, Minneapolis, MN, Sept. 2–6, 2009
- 26.Parzen E. On estimation of a probability density function and mode. Ann Math Stat. 1962;33(3):1065–1076. doi: 10.1214/aoms/1177704472. [DOI] [Google Scholar]
- 27.Duda RO, Hart PE. Pattern Classification. New York: Wiley; 2001. [Google Scholar]
- 28.Cover TM, Thomas JA. Elements of Information Theory. New York: Wiley; 1991. [Google Scholar]
- 29.Gonzalez RC, Woods RE. Digital Image Processing. Upper Saddle River: Prentice Hall; 2002. [Google Scholar]
- 30.Prescott JW, Swanson MS, Haq F, Best TM, Powell K, Jackson R, Gurcan MN: An Automated Method for Femur Segmentation for Osteoarthritis Research,” EMBC 2009, Minneapolis, MN, Sept. 2–6, 2009
- 31.Mitsiopoulos N, Baumgartner RN, Hemsfield SB, Lyons W, Gallagher D, Ross R. Cadaver validation of skeletal muscle measurement by magnetic resonance imaging and computerized tomography. J Appl Physiol. 1998;85:115–122. doi: 10.1152/jappl.1998.85.1.115. [DOI] [PubMed] [Google Scholar]
- 32.Perona P, Malik J. Scale-space and edge detection using anisotropic diffusion. IEEE Trans Patt Anal Mach Intell. 1990;12(7):629–639. doi: 10.1109/34.56205. [DOI] [Google Scholar]
- 33.Li C, Xu C, Gui C, Fox MD: Level set evolution without re-initialization: a new variational formulation. IEEE Conf Comp Vis Patt Recog 1:430–436, 2005
- 34.Zijdenbos AP, Dawant BM, Margolin RA, Palmer AC. Morphometric analysis of white matter lesions in MR images: Method and validation. IEEE Trans Med Imag. 1994;13:716–724. doi: 10.1109/42.363096. [DOI] [PubMed] [Google Scholar]
- 35.Landis JR, Koch GG. The measurement of observer agreement for categorical data. Biometrics. 1977;33(1):159–174. doi: 10.2307/2529310. [DOI] [PubMed] [Google Scholar]


