Abstract
MRI of bone marrow edema (BME) has been found to be helpful in the diagnosis of back pain attributed to degenerative disk disease (DDD) and spondyloarthropathy (SA), but its interpretation is limited by a lack of knowledge of its nature and natural history. To address this, we assessed effects of compressive forces to mouse tail segments of WT and TNF-Tg mice with SA, via contrast enhanced MRI and histology. Normalized marrow contrast enhancement (NMCE) of uninstrumented WT vertebrae significantly decrease 3-fold (p<0.01) from 8 to 12 weeks of age, consistent with red to yellow marrow conversion, while the NMCE of TNF-Tg vertebrae remained elevated. Chronic compressive loading 6X body weight to WT tails increased NMCE 2-fold (p<0.02) within 2-weeks, which was equal to 6X loaded TNF-Tg tails within 4-weeks. Histology confirmed degenerative changes and that load-induced NMCE corresponded to increased vascular sinus tissue (35± 3% vs. 19± 3%; p<0.01) and cellularity (4,235± 886 vs.1,468± 320 cells/mm2; p<0.01) for the loaded vs. unloaded WT respectively. However, micro-CT analyses failed to detect significant load-induced changes to bone. While the bone marrow of loaded WT and TNF-Tg vertebrae were similar, histology demonstrated mild cellular infiltrate and increased osteoclastic resorption in the WT tails versus severe inflammatory-erosive arthritis in TNF-Tg joints. Significant (p<0.05) decreases in cortical and trabecular bone volume in uninstrumented TNF-Tg vs. WT vertebrae were confirmed by micro-CT. Thus, chronic load-induced DDD causes BME signals in vertebrae similar to those observed from Ankylosing Spondylitis (AS), and both DDD and AS signals correlate with a conversion from yellow to red marrow, with increased vascularity.
Keywords: Modic Changes, CE-MRI, Bone Marrow Edema, Vertebral Degeneration
Introduction
Low back pain (LBP) which may be associated with degenerative disk disease (DDD) remains a major public health problem, and has an annual incidence in the adult population of 10–15%, and a point prevalence of 15–30%.1 Of those patients suffering from back pain 70% will seek medical care, making it the second most common reason for visiting a physician’s office.2,3 Individuals with LBP have per capita healthcare expenditures about 60% larger than individuals who do not suffer from LBP.4 However, despite its great prevalence, there is no clinical consensus on the treatment for this condition. 5 Thus, there is a need for basic research to elucidate the molecular mechanisms responsible for LBP, and to develop objective translational outcome measures that can quantify painful pathology.
Recently there have been attempts at classifying LBP into treatment response categories, however, these categories have yet to be definitively validated.6,7 One outcome measure that is widely utilized for these clinical decisions is the presence of inflammation, or bone marrow edema (BME) observed on MRI,8 commonly referred to as “Modic Type 1 (MT1) and Type 2 (MT2) changes.”9,10 MT1 changes appear as decreased signal intensity on T1-weighted spin-echo images and increased signal intensity on T2-weighted images, while MT2 changes are defined as increased signal intensity on T1-weighted images and isointense or slightly increased signal intensity on T2-weighted images.9,10 Although there are exceptions to the rules,11 the consensus has been that there is some relationship between MT1 and discogenic pain.12,13 At the molecular level, other studies have demonstrated that vertebral endplates from DDD patients with MT1 changes have significantly more tumor necrosis factor (TNF) immunoreactive cells versus controls,14 and phase I clinical trials investigating anti-TNF agents as a treatment for severe sciatica15 and lumbosacral radiculopathy16 have shown promising results. Interestingly, patients with painful spondyloarthropathies (SA) like ankylosing spondylitis (AS), also present with BME signal on MRI.17 Moreover, efficacy of FDA approved anti-TNF therapy in these patients has been correlated with amelioration of BME,17 and significant improvements in productivity and workday loss.18 While these remarkable clinical findings support the theory that TNF-induced BME is the long-sought-after objective biomarker of LBP, a cost-effective animal model is still needed to: 1) formally characterize the natural history of BME in the DDD and SA, 2) determine the cellular and biochemical nature of BME, and 3) test hypotheses regarding the cause-effect relationship between DDD, BME and LBP.19 Thus, to the end of understanding the direct relationship between vertebral compression and the genesis of BME via conversion of fatty “yellow” to haematopoietic “red” bone marrow, here we test the hypothesis that chronic axial compression of the mouse tail segment induces BME signal changes seen on CE-MRI that correlate with increased marrow vasculature and cellularity. This small animal model combines high resolution contrast enhanced (CE) MRI of BME,20–22 with chronic compression developed in other animal models of DDD.23–25 As a positive control, we used TNF-Tg mice,26 which over produce TNF and develop a systemic autoimmune response phenotype typically seen in SA27 primarily affecting the axial skeleton and joints. Thus, significant similarities and difference observed between WT and TNF-Tg mice in our model provide insights as to whether or not DDD and SA share a common mechanism in the genesis of endplate BME in affected vertebrae.
Materials and Methods
Animals and Instrumentation
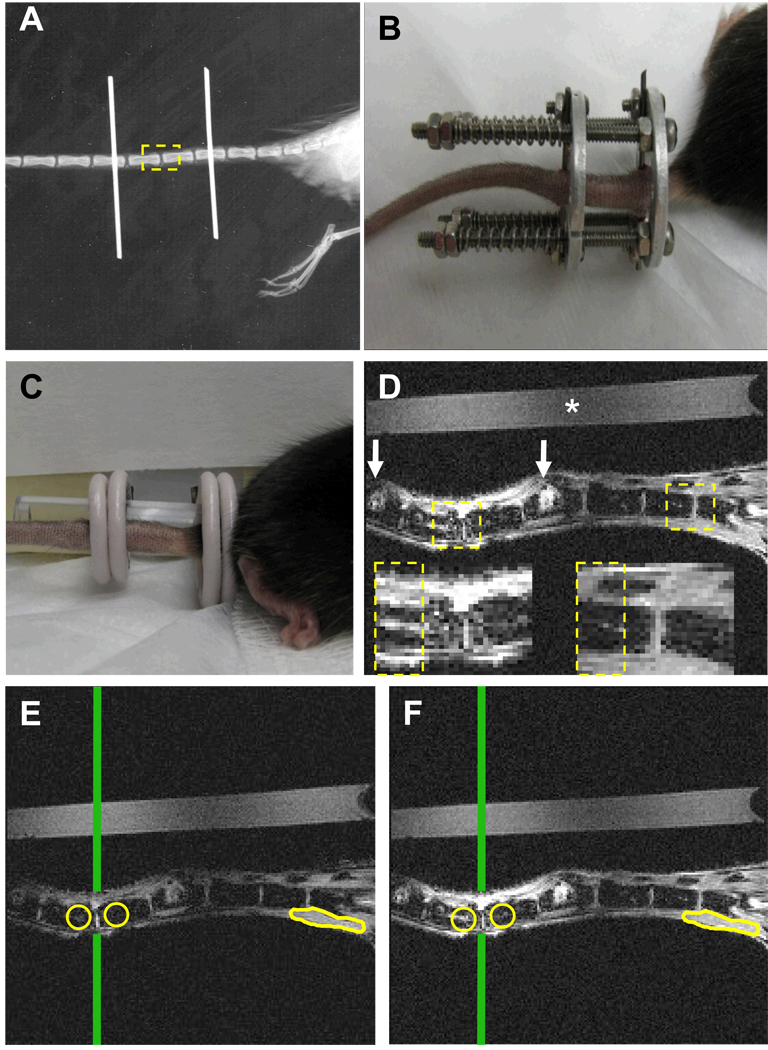
Experiments were performed on 2-month-old, heterozygous TNF-Tg mice obtained from Dr. G. Kollias,26 and their sex matched wild type C57B/6 (WT) littermate controls under IACUC approved protocols as we have previously described.21 In compressive load studies mice were anesthetized with a mixture of ketamine 60mg/kg and xylazine 4mg/kg injected I.P., and fitted with two .028” diameter titanium pins implanted transcutaneously in the center of the 7th and 10th caudal vertebrae. Specified vertebrae were palpated, metallic markers placed, and pre-operative radiographs were obtained to ensure proper placement of each pin. This process of implantation allowed us to produce consistent placement of the pins in the intended caudal vertebrae (Figure 1A). Next, compression rings were attached to the implanted pins, which allowed for chronic loading via manual tightening of four screws around which calibrated springs (2.55 N/mm) were placed (Figure 1B). This device was monitored to ensure maintained loading throughout the trial minimizing the effect stress relaxation due to soft tissue deformation or osteolysis.
Figure 1. Quantification of chronic load-induced bone marrow edema in vertebral endplates of the mouse tail.
(A) Plain x-ray of a mouse tail that has been instrumented with Ti pins transcutaneously in the center of the 7th and 10th caudal vertebrae. The 8th and 9th caudal vertebrae are highlighted as the ROI (dashed box), as they bear the chronic load in this model, but are not affected by instrumentation. (B) A photograph of a fully instrumented and loaded mouse tail is presented to illustrate the positioning of the external fixator device and calibrated springs. (C) This device is removed prior to MRI scanning, and photograph of the uninstrumented tail is presented to illustrate the placement of the saline phantom and the 2 surface coils for CE-MRI. (D) A representative CE-MRI image taken 3 minutes after injection of the Gd-DTPA contrast agent is shown to illustrate the resolution of this system (* indicates the saline phantom; white arrows indicate the pin insertion sites). Boxes indicate the ROIs used to quantify BME, and are also shown at greater magnification. Note the increase in signal intensity that can be seen in marrow cavity indicating BME formation. Representative pre-contrast (E) and post-contrast (F) MR images obtained after 8 weeks of compression are presented to illustrate how NBMI and NMCE are calculated. Circles indicate regions of interest chosen in the marrow space beneath the endplate of each vertebra. Vertical line indicates the center of the RF coil, determined by the highest signal intensity in the saline phantom, used to normalize day to day variations in coil placement. Muscle tissue outlined at the base of the tail is used to normalize contrast enhancement calculations.
Magnetic Resonance Imaging
MRI scans were performed on anesthetized mice. Due to unacceptable metal artifacts, implants were removed from instrumented mice prior to, and replaced after, each MRI scan. Mice were placed on the imaging stage with the tail mounted next to a saline phantom in the custom dual RF surface coil (Figure 1C), which had previously been developed to image the mouse ankle and knee joints simultaneously.28 The coils were integrated into a clinical 3 Tesla Siemens Trio MRI (Siemens Medical Solutions, Erlangen, Germany). Pre-contrast MRI, and CE-MRI following retroorbital injection of Gd-DTPA contrast agent (Omniscan, Amersham Health, Oslo, Norway) was performed using the pulse sequences and Osirix DICOM viewer analysis methods described previously.21 The resulting CE-MRI post contrast image allows for the quantification of signal intensities (Figure 1D). The normalized bone marrow intensity (NBMI), was calculated by dividing the intensity of a 2D region of interest (ROI) circle (≈ .65µm2) in the bone marrow by the intensity of a control ROI of saline phantom that is of the same size and distance from the center of the surface coil. This was done for 4 consecutive image slices for a total volume of approximately 416 µm3. The normalized marrow contrast enhancement (NMCE) was calculated by subtracting the signal intensity of the pre-contrast ROI (Figure 1E) from the same ROI post-contrast (Figure 1F), and then normalized for Gd-DTPA dosage variations by dividing this value by the contrast enhancement of a large section of muscle (>3mm3) as previously described.21
Micro Computed Tomography
The 6th through 11th caudal vertebra were harvested and directly placed into 10% neutral buffered formalin for 36 to 48 hours for fixation. Specimens were then placed in 70% ETOH until micro-CT imaging 3–5 days later. Specimens were scanned in a VivaCT 40 (Scanco Medical, Brüttisellen, Switzerland) at an isotropic resolution of 17.5µm in a custom sample holder at 55 kEv, as we have previously described for lumbar vertebrae.29 The data were reconstructed via Scanco software into DICOM files and cortical and trabecular bone volumes were quantified using the standard Scanco software.
Histology
After micro-CT acquisition, the specimens were decalcified in 14% EDTA at room temperature (pH adjusted to 7.2) for 28 days. Specimens were then embedded in paraffin and 3µm sections were stained with alcian blue/Orange G (AB/OG) or for tartrate-resistant acid phosphatase as previously described.30 Histomorphometry to quantify the vascular sinus tissue area of the bone marrow (% sinus), the cellularity of the bone marrow (mononuclear cells/mm2), and osteoclasts (multinucleated TRAP+ cells) was performed as previously described.31
Statistical Analysis
Two sided t-tests assuming unequal variances were used to make between group comparisons of CE-MRI, micro-CT, or histomorphometry data at each time point or age. All underlying assumptions of parametric methods were checked and no serious violations were detected. P-values less than 0.05 were considered significant.
Results
Induction of vertebral bone marrow edema: chronic load vs. spondyloarthropathy
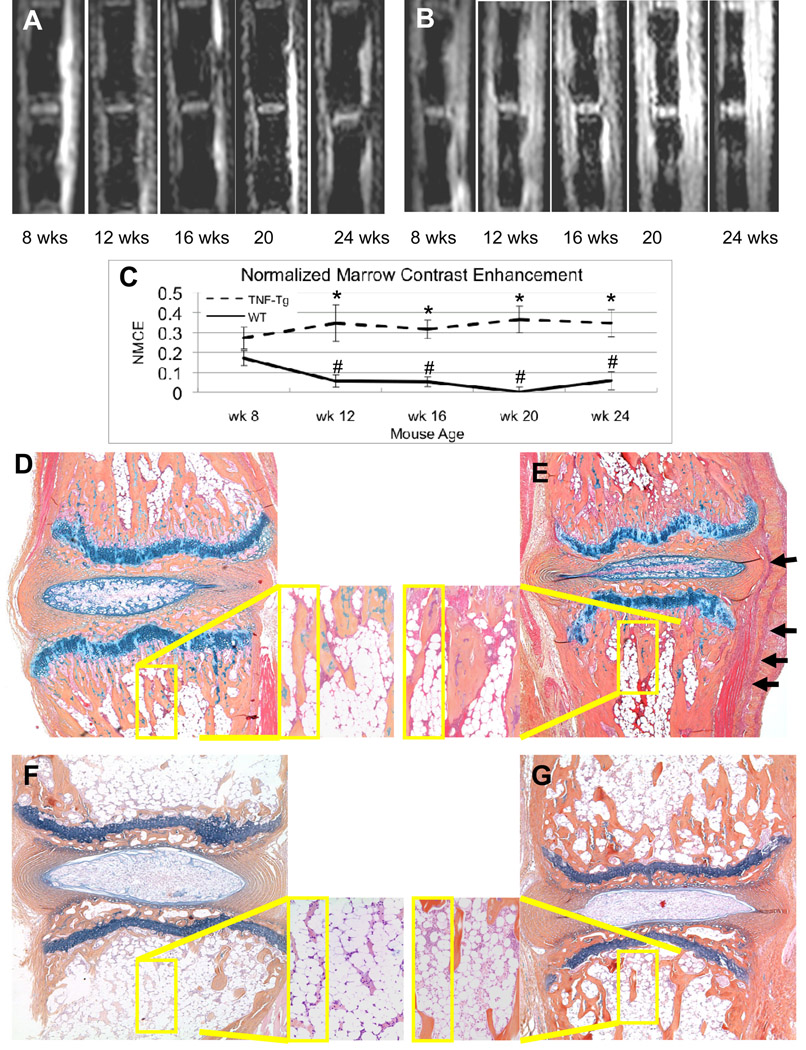
Previously, we used longitudinal CE-MRI to characterize the natural history of age related haematopoietic (red) to adipose (yellow) marrow conversion in the lower limb of WT mice, resulting in a decrease in NMCE over time, which does not occur in TNF-Tg mice.21 As a prelude to our chronic load studies, we first performed longitudinal CE-MRI and histology studies on 8-week old uninstrumented WT and TNF-Tg caudal vertebrae (Figure 2A, B) to assess age related marrow conversion in the tail. Consistent with our findings in the tibiae,21 WT caudal vertebrae also displayed a significant decrease in NMCE from 8 to 12-weeks of age, which was sustained thereafter (Figure 2C). In contrast, TNF-Tg caudal vertebrae have increased NMCE after 8-weeks, which remained at an elevated level that was significantly greater than that of WT at 12, 16, 20 and 24 weeks. AB /OG stained histology of caudal vertebrae from 8-week old controls, and 24-week old mice from this study, confirmed the red to yellow marrow conversion in WT, but not TNF-Tg marrow (Figure 2D–G). Also of note is the inflammatory-synovitis of the TNF-Tg joint that is indicative of the SA observed in these animals, and is consistent with the high CE-MRI signal of the surrounding soft tissue.
Figure 2. Age related marrow changes in WT and TNF-Tg caudal vertebrae assessed by CE-MRI and histology.
Representative post-contrast images of a uninstrumented WT (A) and TNF-Tg mouse (B) at the indicated age are shown to illustrate the baseline signal intensities of the WT mice versus the increased signal intensities in the bone marrow and surrounding soft tissues seen in the TNF-Tg mice. (C) The NMCE values from the mice at indicated age were quantified, and the data are presented as the mean +/− SD for each group (n=3 tails; 6 vertebrae) (*p<0.05 vs. WT at same time point; # p<0.05 vs. WT at 8-weeks) mice were 8weeks old at week 0 and sacrificed at 16 weeks of age. AB/OG stained histology of caudal vertebrae from a representative 8-week old WT (D) and TNF-Tg (E) mouse are shown at 10X magnification with (40X inset) to illustrate the similar amount of red marrow in both strains at this age (Note inflammatory infiltrate in TNF-Tg, shown by arrows). Histology from 24-week old mice confirms the red to yellow marrow conversion in WT (F), which corresponds to the significant decrease in NMCE, while the persistent red marrow and synovitis observed in the TNF-Tg (G), corresponds to the increased NMCE in the bone and surrounding soft tissue.
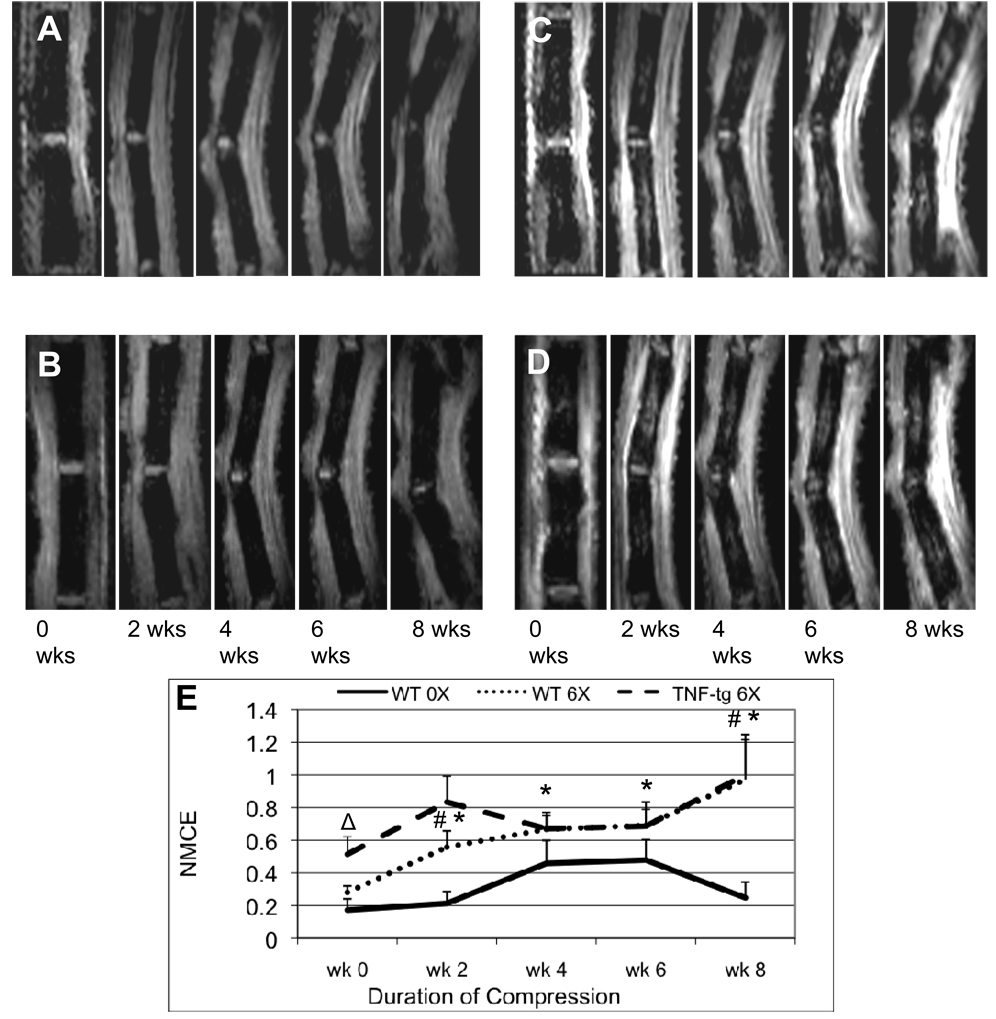
In order to design a study to assess the effects of chronic compressive loads on BME in caudal vertebrae using our model, we first performed pilot studies with various loads (1X, 6X, 12X body weight) to identify the maximum compressive force that did not cause significant tissue damage (i.e. vertebral fracture and soft tissue necrosis). This study indicated that 6X body weight was ideal for our model (data not shown). Thus, we assessed the effects of 6X load on BME in WT and TNF-Tg mice, and compared the results to 0X loaded WT controls (Figure 3). The results demonstrated that the load significantly increased NMCE in WT vertebrae at 2-weeks, and remained significantly elevated from baseline throughout the study. Interestingly, the NMCE in 6X WT vertebrae achieved an equivalent signal to that of 6X TNF-Tg after 4 weeks of chronic load, and remained at this significantly elevated level thereafter. Remarkably, in contrast to WT, the 6X chronic load failed to increase BME in TNF-Tg vertebrae above that observed from the SA at baseline.
Figure 3. Chronic compression induces BME in WT but does not significantly increase BME in TNF-Tg caudal vertebrae.
Pre-contrast (A, B) and post-contrast (C, D) CE-MRI of the 8th and 9th caudal vertebrae of representative 2-month-old WT (A, C) and TNF-Tg (B, D) mice were obtained at the indicated time following instrumentation with the customized external fixation device loaded to 6X body weight. (C) The NMCE values from the loaded tails (6X) and instrumented unloaded controls (0X) at each time point were quantified, and the data are presented as the mean +/− SD for each group (n=5) (# p<0.05 vs. WT 0X at each time point; *p<0.05 vs. WT 6X week 0); Δ p< 0.05 vs. WT 6X week 0. Mice were 8 weeks old at week 0 and sacrificed at 16 weeks of age. Note that the values from TNF-Tg mice were not significantly different from baseline at any time point.
Effects of chronic load vs. SA on vertebral bone, marrow elements and osteoclasts
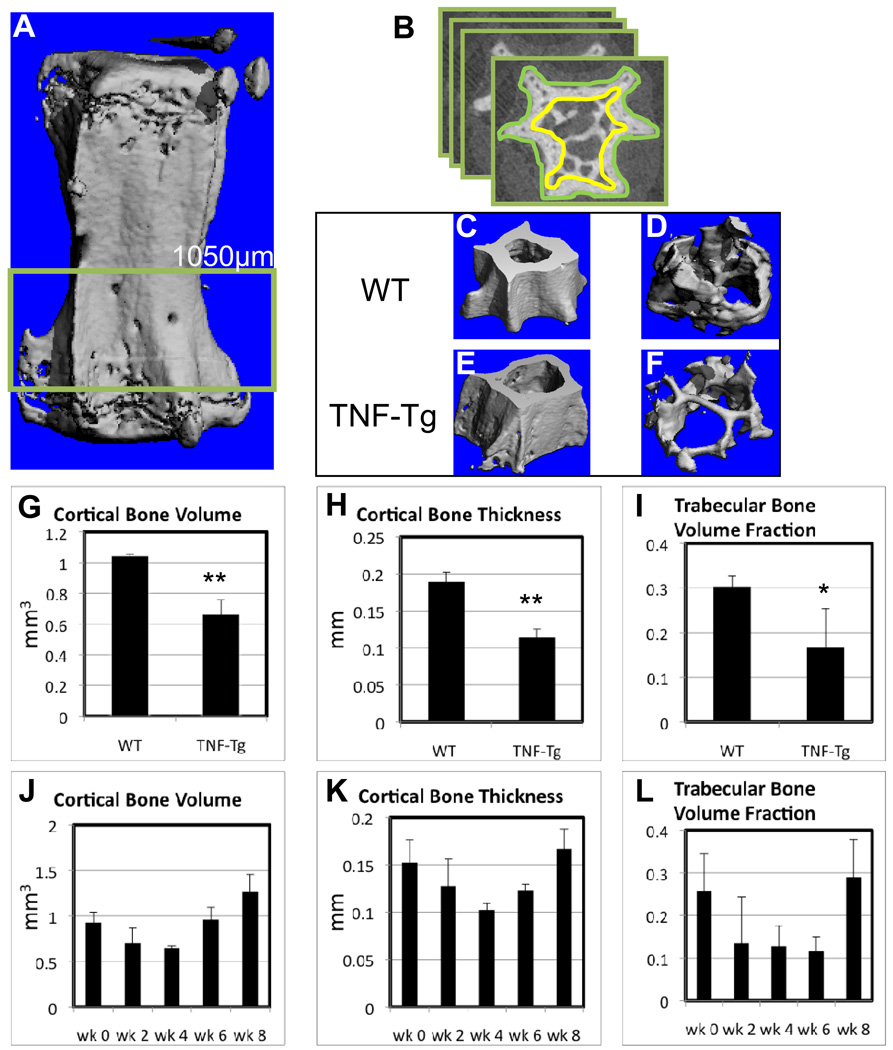
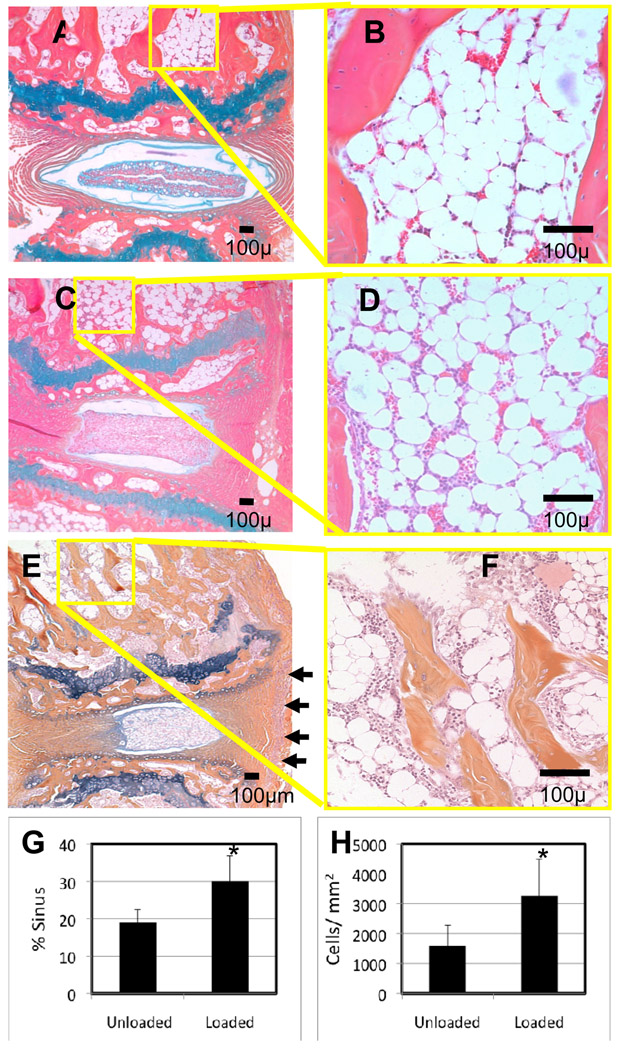
As bone is responsive to mechanical load, and these changes could have been directly or indirectly responsible for the BME signal we observed by MRI, we evaluated the properties of the cortical and trabecular bone from the experimental vertebrae of the WT and TNF-Tg mice (Figure 4). Consistent with previous reports of SA-induced osteopenia in TNF-Tg sacral27 and lumbar29 vertebrae, we found that TNF-Tg caudal vertebrae had significantly less cortical bone volume, cortical bone thickness, and trabecular bone volume fraction vs. WT (Figure 4G–I). Interestingly, analyses of 6X loaded WT vertebra harvested over time demonstrated a biphasic pattern of bone loss followed by an increase bone, found in all three measurements (Figure 4J–L). While these are not longitudinal experiments the results suggest that the chronic load induced a compensatory bone remodeling. To investigate this we analyzed histology of the experimental vertebrae (Figure 5). Assessment of the AB/OG stained 0X vs. 6X WT histology revealed several remarkable differences. The unloaded intervertebral discs had fully expanded and seemingly well hydrated nucleus pulposus, the annulus organization was well separated and with distinct layers, and the separation between the two regions was well defined with high proteoglycan content (Figure 5A). In contrast, the loaded vertebrae displayed compressed nucleus pulposus, the annulus appeared ruptured, compressed, and asymmetric, and the distinction between the two regions along the lateral periphery was poorly defined (Figure 5C). Although synovitis was present in the 6X WT vertebrae, it was much less severe versus the AS in the TNF-Tg, and not dramatically different from that observed in the unloaded WT. Thus, these soft tissue changes are consistent with other models of DDD.
Figure 4. Spondyloarthropathy, but not chronic compression induces cortical and trabecular bone loss.
The 8th and 9th caudal vertebrae from the 6X loaded WT and TNF-Tg mice described in Figure 3 were harvested at 8 weeks for micro-CT analyses. (A) Three dimensional reconstruction of a caudal vertebra is show with the highlighted ROI. (B) Illustration of the manual contouring performed to quantify the cortical and trabecular bone in the vertebrae. Thresholds of 275 and 220 HU were used for cortical (C & E) and trabecular (D & F) bone reconstructions respectively. The apparent bone loss observed in the 3D images of TNF-Tg vs. WT vertebrae was confirmed by histomorphometry of the bone volume and thickness (G-I). The data are presented as mean +/− SD (*p<0.05; **p<0.01 vs. WT). WT tails were instrumented with a 6X load and vertebrae (n=4) were harvested for micro-CT at 2 week intervals over an 8-week period (J–L). Although the amount of bone appeared to decreased and then increase following application of the chronic load, no significant differences were observed at 8 weeks.
Figure 5. Chronic compression induces increase in vascular sinus and cellularity in subchondral bone marrow.
Representative AB/OG histological sections (A–F) of the 8th and 9th caudal vertebrae from the 0X loaded (A,B) and 6X loaded (C–F) WT (A–D), and 6X loaded TNF-Tg (E,F) mice 8 weeks after implantation are shown at 10 X and 40 X magnifications. Of note is the ruptured annulus and hypertrophic nucleus pulposus of the herniated intervertebral disk in the 6X (C) vs. 0X (A) loaded WT, which occurs in the absence of detectable synovitis vs. TNF-Tg (E), synovitis indicated by arrows. Histomorphometry demonstrated that the 6X load significantly increased the vascular sinus space (G), and the cellularity (H), of WT marrow (*p<0.01).
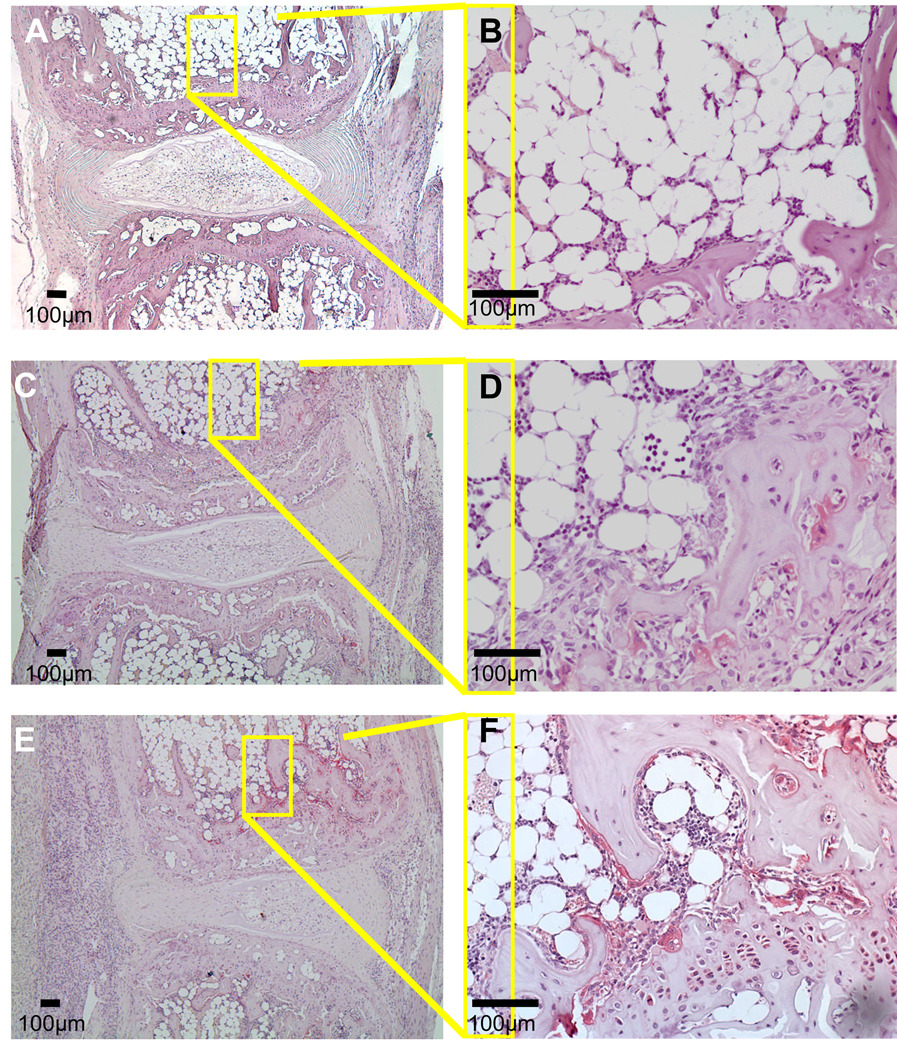
As the primary objective of this study was to investigate the nature of load-induced BME, we performed histomorphometry to quantify the cellular and vascular compartments of the marrow. Consistent with our prior observations of arthritis-induced NMCE in the mouse knee, the increased BME signal in the 6X WT vertebrae corresponded to red marrow (monocytes and vascular sinuses), which was scant in other regions of the bone and absent in the adipocyte filled 0X WT vertebrae. Histomorphometry confirmed the significant load-induced increases in marrow cellularity and vascular tissue (Figure 5G,H). While these marrow changes were similar to that observed in 6X TNF-Tg vertebrae, explaining the similar NMCE values, we also noticed that the 6X WT vertebrae lacked the focal erosions that were apparent in TNF-Tg endplates. To further evaluate this difference, we used TRAP stained histology to investigate osteoclast formation (Figure 6A–F). We observed a modest increase in TRAP positive stained osteoclasts in 6X WT vertebral sections as compared to 0X WT controls, suggestive of increased remodeling. However, these osteoclast levels were still less than that observed in 6X TNF-Tg, which was consistent with the AS-induced focal erosions and osteopenia observed by micro-CT.
Figure 6. Chronic compression induces a modest increase in osteoclast formation compared to spondyloarthropathy.
Representative TRAP stained histological sections of the 8th and 9th caudal vertebrae from the 0X loaded (A,B) and 6X loaded (C–F) WT (A–D), and 6X loaded TNF-Tg (E,F) mice 8 weeks after implantation are shown at 10 X and 40 X magnifications. The loaded vertebrae show a modest increase in the osteoclast numbers on the subchondral bone (C,D), which were markedly lower than that observed in loaded TNF-Tg vertebrae.
Discussion
One of the greatest difficulties in the clinical management of LBP is identifying quantitative technologies which demonstrate a high degree of correlation with the patient’s clinical condition. There is a critical need for imaging tests that can discriminate between pathologies whose symptoms are addressable by current interventions (e.g. spinal fusion surgery), versus more complicated conditions that are less likely to benefit from high-risk and costly procedures. While assessment of MT1 vs. MT2 changes had been utilized for this purpose, it is done without a formal understating of the corresponding histological and biochemical milieu. Although several groups have published studies attempting to correlate BME signals with patient retrieval tissue obtained during surgery,32,33 the interpretation of these findings is limited by the end-stage tissue that can be analyzed. Thus, in order to elucidate the nature of BME and the cellular and molecular underpinnings of DDD, we have developed this small animal model that allows for longitudinal assessment of chronic load induced changes by CE-MRI, micro-CT and histology. This model has several major shortcomings. First, there is no evidence from this work that the observed changes were in any way painful or symptomatic. It is a well recognized clinical fact that there are many patients with Modic changes in vertebral segments who are clinically asymptomatic. Thus while our model can be used to better understand some of the molecular and histochemical responses to chronic loading of a disc, it does not, at this point, serve to better explain the clinical problem of LBP. Second, the mouse is a quadruped and the tail segment is a less complex articulation than the human functional spinal unit. There are no facet joints in the mouse tail, it is not normally subject to axial loading, and motion in the segment is less constrained than in the human disc. It is not clear whether these anatomic and functional differences result in differences at the molecular level which might compromise our results. Certainly, the differing role of the tail versus the human spine needs to be borne in mind while considering our results. The authors considered these differences in planning this work; however, the actual mouse intervertebral segment is too small to serve as a practical experimental model, and larger animals are not conducive to transgenic experiments. Although this model has weaknesses, it has several advantages that are noteworthy. First, by using mice, this model facilitates the use of transgenic mice to isolate the roles of specific inflammatory mediators in the degenerative process. The value of this facet of the model cannot be overstated, as transgenic experiments are one of the most efficient and specific tools in unraveling complex biologic systems. Moreover, future improvements, such as incorporating outcome measures of painful behavior in mice,34 could enable this model to directly test hypotheses of the cause-effect relationship between BME signals and LBP (e.g. MT1 vs. MT2 changes), and to longitudinally assess experimental therapeutics.
Although an etiological role of TNF has been firmly established in SA,17,18 and has been implicated in the pathogenesis of DDD,14–16 the similarities and differences between BME induced by chronic inflammation and compressive load have yet to be described. To address this, we utilized NBMI and NMCE as separate indicators of BME. In contrast to their comparable utility to quantify TNF-induced BME in inflammatory-erosive arthritis,21 here we have found that the NBMI values, which we believe are a function of tissue permeability, are inconsistent and do not progress with incidence of BME induced by chronic compression (data not shown). However, NMCE values, which we believe are a function of tissue vascularity, proved to be a faithful assessment of the chronic load-induced bone marrow cellularity and vascularity (Figure 3 & Figure 5). Thus, while both chronic joint inflammation and compression induce cellular and vascular changes in the bone marrow, which produce equivalent NMCE values, biomechanical load does not appear to increase marrow permeability the way inflammatory arthritis does.
Another remarkable difference that we observed between our models of DDD and SA is their effects on osteoclast numbers and bone (Figure 4 & Figure 5). As predicted from studies of the TNF-Tg spine, chronic inflammation in caudal vertebrae leads to erosions and generalized osteopenia. The absence of inflammatory tissue, lower numbers of osteoclasts and absence of erosions observed in 6X WT mice highlights the contrasting role that TNF plays in SA and its potential role in the generation of BME and LBP in DDD. Future studies to determine if TNF is required for BME using genetically deficient mice, and the effects of anti-TNF therapy in our model are warranted.
Acknowledgments
The authors would like to thank Ryan Tierney and Michael Thullen for technical assistance with the histology and micro-CT analyses respectively. This work was supported by research grants from Centocor Inc., and the National Institutes of Health PHS awards AR54041, AR/AG48697, AR46545, and AR56702.
References
- 1.Andersson GB. Epidemiological features of chronic low-back pain. Lancet. 1999;354(9178):581–585. doi: 10.1016/S0140-6736(99)01312-4. [DOI] [PubMed] [Google Scholar]
- 2.Deyo RA, Phillips WR. Low back pain. A primary care challenge. Spine. 1996;21(24):2826–2832. doi: 10.1097/00007632-199612150-00003. [DOI] [PubMed] [Google Scholar]
- 3.Deyo RA, Tsui-Wu YJ. Descriptive epidemiology of low-back pain and its related medical care in the United States. Spine. 1987;12(3):264–268. doi: 10.1097/00007632-198704000-00013. [DOI] [PubMed] [Google Scholar]
- 4.Luo X, Pietrobon R, Sun SX, Liu GG, Hey L. Estimates and patterns of direct health care expenditures among individuals with back pain in the United States. Spine. 2004;29(1):79–86. doi: 10.1097/01.BRS.0000105527.13866.0F. [DOI] [PubMed] [Google Scholar]
- 5.Carey TS, Garrett JM, Jackman AM. Beyond the good prognosis. Examination of an inception cohort of patients with chronic low back pain. Spine. 2000;25(1):115–120. doi: 10.1097/00007632-200001010-00019. [DOI] [PubMed] [Google Scholar]
- 6.Junge A, Frohlich M, Ahrens S, Hasenbring M, Sandler A, Grob D, Dvorak J. Predictors of bad and good outcome of lumbar spine surgery. A prospective clinical study with 2 years' follow up. Spine. 1996;21(9):1056–1064. doi: 10.1097/00007632-199605010-00013. discussion 64–5. [DOI] [PubMed] [Google Scholar]
- 7.Childs JD, Fritz JM, Flynn TW, Irrgang JJ, Johnson KK, Majkowski GR, Delitto AA. clinical prediction rule to identify patients with low back pain most likely to benefit from spinal manipulation: a validation study. Ann Intern Med. 2004;141(12):920–928. doi: 10.7326/0003-4819-141-12-200412210-00008. [DOI] [PubMed] [Google Scholar]
- 8.Starr AM, Wessely MA, Albastaki U, Pierre-Jerome C, Kettner NW. Bone marrow edema: pathophysiology, differential diagnosis, and imaging. Acta Radiol. 2008;49(7):771–786. doi: 10.1080/02841850802161023. [DOI] [PubMed] [Google Scholar]
- 9.Modic MT, Masaryk TJ, Ross JS, Carter JR. Imaging of degenerative disk disease. Radiology. 1988;168(1):177–186. doi: 10.1148/radiology.168.1.3289089. [DOI] [PubMed] [Google Scholar]
- 10.Modic MT, Steinberg PM, Ross JS, Masaryk TJ, Carter JR. Degenerative disk disease: assessment of changes in vertebral body marrow with MR imaging. Radiology. 1988;166-1(Pt 1):193–199. doi: 10.1148/radiology.166.1.3336678. [DOI] [PubMed] [Google Scholar]
- 11.Marshman LA, Trewhella M, Friesem T, Bhatia CK, Krishna M. Reverse transformation of Modic type 2 changes to Modic type 1 changes during sustained chronic low-back pain severity. Report of two cases and review of the literature. J Neurosurg Spine. 2007;6(2):152–155. doi: 10.3171/spi.2007.6.2.152. [DOI] [PubMed] [Google Scholar]
- 12.Braithwaite I, White J, Saifuddin A, Renton P, Taylor BA. Vertebral end-plate (Modic) changes on lumbar spine MRI: correlation with pain reproduction at lumbar discography. Eur Spine J. 1998;7(5):363–368. doi: 10.1007/s005860050091. [DOI] [PMC free article] [PubMed] [Google Scholar]
- 13.Sandhu HS, Sanchez-Caso LP, Parvataneni HK, Cammisa FP, Jr, Girardi FP, Ghelman B. Association between findings of provocative discography and vertebral endplate signal changes as seen on MRI. J Spinal Disord. 2000;13(5):438–443. doi: 10.1097/00002517-200010000-00012. [DOI] [PubMed] [Google Scholar]
- 14.Ohtori S, Inoue G, Ito T, Koshi T, Ozawa T, Doya H, Saito T, Moriya H, Takahashi K. Tumor necrosis factor-immunoreactive cells and PGP 9.5-immunoreactive nerve fibers in vertebral endplates of patients with discogenic low back Pain and Modic Type 1 or Type 2 changes on MRI. Spine. 2006;31(9):1026–1031. doi: 10.1097/01.brs.0000215027.87102.7c. [DOI] [PubMed] [Google Scholar]
- 15.Karppinen J, Korhonen T, Malmivaara A, Paimela L, Kyllonen E, Lindgren KA, Rantanen P, Tervonen O, Niinimaki J, Seitsalo S, Hurri H. Tumor necrosis factor-alpha monoclonal antibody, infliximab, used to manage severe sciatica. Spine. 2003;28(8):750–753. discussion 3–4. [PubMed] [Google Scholar]
- 16.Cohen SP, Bogduk N, Dragovich A, Buckenmaier CC, 3rd, Griffith S, Kurihara C, Raymond J, Richter PJ, Williams N, Yaksh TL. Randomized, double-blind, placebo-controlled, dose-response, and preclinical safety study of transforaminal epidural etanercept for the treatment of sciatica. Anesthesiology. 2009;110(5):1116–1126. doi: 10.1097/ALN.0b013e3181a05aa0. [DOI] [PubMed] [Google Scholar]
- 17.Braun J, Landewe R, Hermann KG, Han J, Yan S, Williamson P, van der Heijde D. Major reduction in spinal inflammation in patients with ankylosing spondylitis after treatment with infliximab: results of a multicenter, randomized, double-blind, placebo-controlled magnetic resonance imaging study. Arthritis Rheum. 2006;54(5):1646–1652. doi: 10.1002/art.21790. [DOI] [PubMed] [Google Scholar]
- 18.van der Heijde D, Han C, DeVlam K, Burmester G, van den Bosch F, Williamson P, Bala M, Han J, Braun J. Infliximab improves productivity and reduces workday loss in patients with ankylosing spondylitis: results from a randomized, placebo-controlled trial. Arthritis Rheum. 2006;55(4):569–574. doi: 10.1002/art.22097. [DOI] [PubMed] [Google Scholar]
- 19.Modic MT. Modic type 1 and type 2 changes. J Neurosurg Spine. 2007;6(2):150–151. doi: 10.3171/spi.2007.6.2.150. discussion 1. [DOI] [PubMed] [Google Scholar]
- 20.Proulx ST, Kwok E, You Z, Beck CA, Shealy DJ, Ritchlin CT, Boyce BF, Xing L, Schwarz EM. MRI and quantification of draining lymph node function in inflammatory arthritis. Ann N Y Acad Sci. 2007;1117:106–123. doi: 10.1196/annals.1402.016. [DOI] [PubMed] [Google Scholar]
- 21.Proulx ST, Kwok E, You Z, Papuga MO, Beck CA, Shealy DJ, Calvi LM, Ritchlin CT, Awad HA, Boyce BF, Xing L, Schwarz EM. Elucidating bone marrow edema and myelopoiesis in murine arthritis using contrast-enhanced magnetic resonance imaging. Arthritis Rheum. 2008;58(7):2019–2029. doi: 10.1002/art.23546. [DOI] [PMC free article] [PubMed] [Google Scholar]
- 22.Proulx ST, Kwok E, You Z, Papuga MO, Beck CA, Shealy DJ, Ritchlin CT, Awad HA, Boyce BF, Xing L, Schwarz EM. Longitudinal assessment of synovial, lymph node, and bone volumes in inflammatory arthritis in mice by in vivo magnetic resonance imaging and microfocal computed tomography. Arthritis Rheum. 2007;56(12):4024–4037. doi: 10.1002/art.23128. [DOI] [PMC free article] [PubMed] [Google Scholar]
- 23.Stokes IA, Aronsson DD, Spence H, Iatridis JC. Mechanical modulation of intervertebral disc thickness in growing rat tails. J Spinal Disord. 1998;11(3):261–265. [PubMed] [Google Scholar]
- 24.Stokes IA, Spence H, Aronsson DD, Kilmer N. Mechanical modulation of vertebral body growth. Implications for scoliosis progression. Spine. 1996;21(10):1162–1167. doi: 10.1097/00007632-199605150-00007. [DOI] [PubMed] [Google Scholar]
- 25.Lotz JC, Ulrich JA. Innervation, inflammation, and hypermobility may characterize pathologic disc degeneration: review of animal model data. J Bone Joint Surg Am. 2006;88 Suppl 2:76–82. doi: 10.2106/JBJS.E.01448. [DOI] [PubMed] [Google Scholar]
- 26.Keffer J, Probert L, Cazlaris H, Georgopoulos S, Kaslaris E, Kioussis D, Kollias G. Transgenic mice expressing human tumour necrosis factor: a predictive genetic model of arthritis. Embo J. 1991;10(13):4025–4031. doi: 10.1002/j.1460-2075.1991.tb04978.x. [DOI] [PMC free article] [PubMed] [Google Scholar]
- 27.Redlich K, Gortz B, Hayer S, Zwerina J, Kollias G, Steiner G, Smolen JS, Schett G. Overexpression of tumor necrosis factor causes bilateral sacroiliitis. Arthritis Rheum. 2004;50(3):1001–1005. doi: 10.1002/art.20194. [DOI] [PubMed] [Google Scholar]
- 28.Guo R, Zhou Q, Proulx ST, Wood R, Ji RC, Ritchlin CT, Pytowski B, Zhu Z, Wang YJ, Schwarz EM, Xing L. Inhibition of lymphangiogenesis and lymphatic drainage via vascular endothelial growth factor receptor 3 blockade increases the severity of inflammation in a mouse model of chronic inflammatory arthritis. Arthritis Rheum. 2009;60(9):2666–2676. doi: 10.1002/art.24764. [DOI] [PMC free article] [PubMed] [Google Scholar]
- 29.Guo R, Yamashita M, Zhang Q, Zhou Q, Chen D, Reynolds DG, Awad HA, Yanoso L, Zhao L, Schwarz EM, Zhang YE, Boyce BF, Xing L. Ubiquitin Ligase Smurf1 Mediates Tumor Necrosis Factor-induced Systemic Bone Loss by Promoting Proteasomal Degradation of Bone Morphogenetic Signaling Proteins. J Biol Chem. 2008;283(34):23084–23092. doi: 10.1074/jbc.M709848200. [DOI] [PMC free article] [PubMed] [Google Scholar]
- 30.Tsutsumi R, Hock C, Bechtold CD, Proulx ST, Bukata SV, Ito H, Awad HA, Nakamura T, O'Keefe RJ, Schwarz EM. Differential effects of biologic versus bisphosphonate inhibition of wear debris-induced osteolysis assessed by longitudinal micro-CT. J Orthop Res. 2008;26(10):1340–1346. doi: 10.1002/jor.20620. [DOI] [PMC free article] [PubMed] [Google Scholar]
- 31.Tiyapatanaputi P, Rubery PT, Carmouche J, Schwarz EM, O'Keefe RJ, Zhang XA. novel murine segmental femoral graft model. J Orthop Res. 2004;22(6):1254–1260. doi: 10.1016/j.orthres.2004.03.017. [DOI] [PubMed] [Google Scholar]
- 32.Jimenez-Boj E, Nobauer-Huhmann I, Hanslik-Schnabel B, Dorotka R, Wanivenhaus AH, Kainberger F, Trattnig S, Axmann R, Tsuji W, Hermann S, Smolen J, Schett G. Bone erosions and bone marrow edema as defined by magnetic resonance imaging reflect true bone marrow inflammation in rheumatoid arthritis. Arthritis Rheum. 2007;56(4):1118–1124. doi: 10.1002/art.22496. [DOI] [PubMed] [Google Scholar]
- 33.Appel H, Loddenkemper C, Grozdanovic Z, Ebhardt H, Dreimann M, Hempfing A, Stein H, Metz-Stavenhagen P, Rudwaleit M, Sieper J. Correlation of histopathological findings and magnetic resonance imaging in the spine of patients with ankylosing spondylitis. Arthritis Res Ther. 2006;8(5):R143. doi: 10.1186/ar2035. [DOI] [PMC free article] [PubMed] [Google Scholar]
- 34.Walker K, Fox AJ, Urban LA. Animal models for pain research. Mol Med Today. 1999;5(7):319–321. doi: 10.1016/s1357-4310(99)01493-8. [DOI] [PubMed] [Google Scholar]


