Abstract
We have modified the biotin switch assay for protein S-nitrosothiols (SNOs), using resin-assisted capture (SNO-RAC). Compared with existing methodologies, SNO-RAC requires fewer steps, detects high-mass S-nitrosylated proteins more efficiently, and facilitates identification and quantification of S-nitrosylated sites by mass spectrometry. When combined with iTRAQ labeling, SNO-RAC revealed that intracellular proteins may undergo rapid denitrosylation on a global scale. This methodology is readily adapted to analyzing diverse cysteine-based protein modifications, including S-acylation.
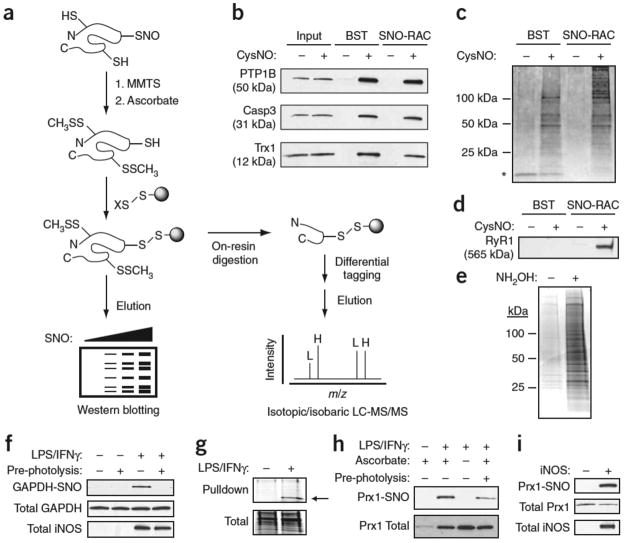
Nitric oxide exerts a ubiquitous influence on cellular signaling, in large part by means of S-nitrosylation/denitrosylation of protein cysteine residues1. It is also increasingly apparent that dysregulated S-nitrosylation may play a causal role in a spectrum of human diseases2, 3, 4. The biotin switch technique (BST)5 is the most commonly used method to detect cellular S-nitrosylation and has greatly advanced the field5, 6, 7, 8. It comprises three principal steps: blocking free thiols on cysteines by S-methylthiolation with a reactive thiosulfonate, converting SNOs to thiols with ascorbate, and labeling nascent thiols with biotin-HPDP (N-(6-(Biotinamido)hexyl)-3′-(2′-pyridyldithio)-propionamide). The degree of biotinylation (and hence S-nitrosylation) is determined by either anti-biotin immunoblotting or streptavidin pulldown followed by immunoblotting for the protein(s) of interest. The BST is, however, labor intensive and has relatively low throughput. Our simpler assay, SNO-RAC (Fig. 1a and Supplementary Methods online) uses a thiol-reactive resin instead of thiol-reactive biotin, thus combining the obligatory ‘labeling’ and ‘pulldown’ steps in the BST. As SNO-RAC results in a covalent disulfide linkage between the SNO site and resin, it is amenable to ‘on-resin’ trypsinization and peptide labeling, which subserve mass spectrometric methodologies.
Figure 1. Analysis of protein S-nitrosylation by SNO-RAC.
(a) Protein thiols are blocked with S-methylmethanethiosulfonate (MMTS); ascorbate converts SNOs to free thiols; nascent thiols are covalently trapped with a resin-bound 2- or 4-pyridyl disulfide (denoted X); and proteins are eluted with reductant and analyzed by SDS-PAGE. Alternatively, proteins can be trypsinized on-resin to obtain peptides containing SNO sites, which may be differentially ‘tagged’ with isotopic or isobaric mass labels (L, light; H, heavy), and analyzed by MS. (b,c) HEK293 cells were incubated in the presence or absence of 0.5 mM CysNO for 10 min and subjected to a side-by-side comparison of the BST and SNO-RAC approaches (1 mg protein per sample). Proteins were separated by SDS-PAGE and visualized by western blotting (b) or silver staining (c) (see Supplementary Tables 1 and 6 online). Adventitiously eluted streptavidin is indicated by an asterisk. (d) Isolated rabbit sarcoplasmic reticulum (1 mg) was treated ±0.1 mM CysNO for 10 min, subjected to either the BST or SNO-RAC; western blotting was carried out to detect the 565 kDa ryanodine receptor 1 (RyR1). (e) Acyl-RAC was performed on HEK293-derived membranes (1 mg protein per sample). Proteins were visualized by SDS-PAGE and Coomassie staining. (f) RAW264.7 murine macrophages were treated ±0.5 μg/ml LPS and 100 U/ml IFNγ to induce inducible nitric oxide synthase, subjected to SNO-RAC (1 mg protein per sample) and analyzed as in c for S-nitrosylated GAPDH. Where indicated, extracts were photolyzed to verify assay specificity. (g–i) Macrophages were subjected to SNO-RAC (8 mg protein per sample) and eluants visualized by SDS-PAGE and Coomassie staining. The prominent band at ~22 kDa was excised and identified by MALDI-MS as peroxiredoxin-1 (indicated by arrow) (g). Lysates (1 mg protein per sample) from stimulated macrophages (h) and inducible nitric oxide synthase–transfected HEK293 cells (i) were subjected to SNO-RAC and analyzed for S-nitrosylated Prx1. For all experiments, n=3. Full-length scans are available in Supplementary Figure 7 online.
Side-by-side comparison of the BST and SNO-RAC approaches using human embryonic kidney (HEK293) cells treated with S-nitrosocysteine (CysNO) and performed on individual (Fig. 1b) and total (Fig. 1c) SNO-proteins suggests superior sensitivity of SNO-RAC relative to the BST for proteins larger than ~100 kDa (Fig. 1c), perhaps due to the fewer precipitation steps required by SNO-RAC versus the BST. Proteins uniquely detected by SNO-RAC and identified by mass spectrometry (MS) are listed in Supplementary Table 1 online. Improved sensitivity for high-mass proteins (and at least some lower mass species) was also evident in THP-1 monocytes (Supplementary Fig. 1 online) and with the S-nitrosylated ryanodine receptor, which has a mass of 565 kDa (Fig. 1d). The BST methodology has been recently adapted to assay S-acylated proteins (ascorbate is substituted with hydroxylamine9), and an analogous RAC-based strategy (Acyl-RAC) showed robust results (Fig. 1e). Thus, overall, SNO-RAC appears to be more sensitive than the BST for high mass proteins, and at least as sensitive as the BST for proteins smaller than 100 kDa. Moreover, it shows general applicability in analyses of post-translational modifications of cysteines.
To further gauge the suitability of SNO-RAC for detecting endogenous SNO-proteins, we assayed S-nitrosylation of glyceraldehyde 3-phosphate dehydrogenase (GAPDH), a SNO-based cell-death effector10, in RAW264.7 macrophages after stimulation of inducible nitric oxide synthase with cytokines (Fig. 1f). Assay specificity was confirmed by ultraviolet ‘pre-photolysis’ (Fig. 1f), which eliminates SNO but not other cysteine-based redox modifications11. SNO-RAC analysis of cytokine-stimulated macrophages suggested the presence of multiple S-nitrosylated proteins, including a novel SNO-protein at 22 kDa, which was identified by mass spectrometry (MS) as peroxiredoxin-1 (Prx1) (Fig. 1g and Supplementary Fig. 2 online). S-nitrosylation of Prx1 by inducible nitric oxide synthase in RAW264.7 and HEK293 cells was confirmed by SNO-RAC with western blotting (Fig. 1h–i).
To assess the ability of SNO-RAC to identify SNO sites, purified GAPDH treated with CysNO was compared with untreated protein after SNO-RAC, on-resin digestion with trypsin and analysis by matrix-assisted laser desorption ionization-(MALDI)-MS (Supplementary Fig. 3 online). Four cysteine-containing peptides corresponding to GAPDH SNO-sites were identified. An analogous experiment was performed on CysNO-treated macrophages (Supplementary Fig. 4 and Supplementary Table 2 online), with confirmation obtained by western blotting (Supplementary Fig. 5 online). We next attempted to characterize the full complement of S-nitrosylated proteins in CysNO-treated Escherichia coli by isotopically encoded SNO-RAC; after on-resin proteolysis, the samples were acetylated with either H6- (control) or D6- (CysNO-treated) acetic anhydride, which resulted in a mass shift of 3.03 Da per primary amine. This approach revealed 44 novel SNO sites in E. coli (Supplementary Fig. 6 and Supplementary Tables 3 and 4 online). Importantly, all novel identifications contained the D3-acetylated mass, whereas an H3-acetylated peptide was not found.
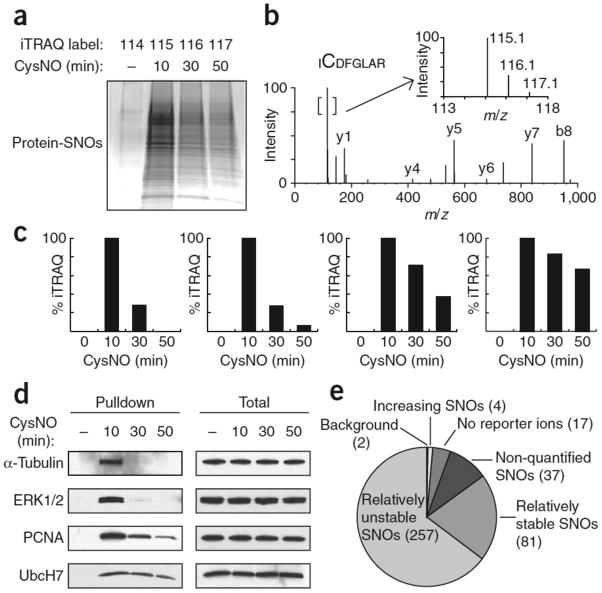
Enzymatic pathways for protein denitrosylation have been recently identified12, 13, but the extent to which they influence SNO-based signaling or stress is unknown. SNO-RAC was used to examine the dynamics of S-nitrosylation/denitrosylation in intact cells. Most SNO proteins underwent rapid denitrosylation after CysNO treatment (Fig. 2a). To quantify relative rates of SNO-site denitrosylation, SNO peptides derived from untreated cells or those harvested 10, 30 and 50 min after CysNO exposure, were labeled on-resin with isobaric tags for relative and absolute quantification (iTRAQ; with 114, 115, 116 and 117 amu ‘reporter ions’, respectively)14, allowing for facile multiplexing with liquid chromatography–tandem MS. Kinetic analysis revealed varying rates of SNO turnover among individual sites of protein S-nitrosylation. A typical iTRAQ pattern is exemplified by the Cys166-containing ERK2 peptide, which exhibited fairly rapid denitrosylation, as revealed by decreasing reporter ion intensities (Fig. 2b). The kinetics of S-nitrosylation/denitrosylation of four representative SNO sites—two relatively unstable (Cys347 of -tubulin and Cys166 of ERK2) and two relatively stable (Cys162 of PCNA and Cys86 of UbcH7) (Fig. 2c)—were verified at the protein level (Fig. 2d). Interestingly, S-nitrosylated -tubulin and ERK2 have been shown to be resistant to denitrosylation by glutathione in vitro7, suggesting that multiple denitrosylases may be operative in cells7, 12, 13.
Figure 2. iTRAQ-coupled SNO-RAC demonstrates proteome-wide (global) denitrosylation.
HEK293 cells were treated ±0.5 mM CysNO for 10, 30 or 50 min and subjected to SNO-RAC. (a) Samples were analyzed by SDS-PAGE with Coomassie staining or (b–e) subjected to on-resin trypsinization and labeling with iTRAQ reagents, yielding peptides with reporter ions at 114, 115, 116 and 117 amu for untreated samples (0 min) and 10, 30 and 50 min post-CysNO treatment, respectively. (b) A representative MS/MS spectrum containing SNO-Cys166 in Erk2. The inset shows an expanded view of the reporter ion region. (c) SNO sites corresponding to α-tubulin Cys347 and Erk2 Cys166, with a 115/116 ratio > 1.5 (‘unstable’), and PCNA Cys162 and UbcH7 Cys86, which possess a 115/116 ratio between 0.6 and 1.5 (‘stable’). (d) Verification of the iTRAQ data in c by western blotting for intact SNO proteins. (e) A global kinetic analysis of SNO stability via iTRAQ ratios identified 398 unique peptides, 396 of which contained a cysteine residue. The vast majority of peptides were relatively “unstable” (257 exhibited 115/116 > 1.5). Additional SNO peptides included: 81 with 115/116 between 0.6 and 1.5 (relatively ‘stable’); 2 possessed barely appreciable reporter ion at 114 (115/114 ratio < 2.5) (‘background’); 17 were without detectable reporter ion; 37 possessed reporter ion at 115 amu only. Four SNO sites appeared to increase over time (115/116 < 0.6). Full-length scans are available in Supplementary Figure 7.
Proteome-wide analysis by iTRAQ-coupled SNO-RAC confirms the global occurrence of denitrosylation (Fig. 2e and Supplementary Table 5 online): nearly all SNO sites showed intense reporter ions at 115 amu, followed by progressive decay over time. Collectively, these results support the notion that denitrosylation is a major determinant of steady-state SNO levels. SNO-RAC and its modifications represent a highly versatile methodology that should facilitate the study of the diverse post-translational modifications of cysteine residues that may be designated the cysteome.
Supplementary Material
Acknowledgments
We thank S. Nimkar (Applied Biosystems) for providing iTRAQ reagents, and Q. Sun, K. Ozawa, A. Hausladen and D. Hess for expert advice. This work was supported by National Institutes of Health grants U19-ES012496, P01-HL075443, HL075443 and HL059130.
Footnotes
Accession numbers
PRIDE database: MS data have been deposited with accession codes 9735–9737, 9748.
References
- 1.Hess DT, et al. Nat Rev Mol Cell Biol. 2005;6:150–166. doi: 10.1038/nrm1569. [DOI] [PubMed] [Google Scholar]
- 2.Cho DH, et al. Science. 2009;324:102–105. doi: 10.1126/science.1171091. [DOI] [PMC free article] [PubMed] [Google Scholar]
- 3.Lim KH, et al. Nature. 2008;452:646–649. doi: 10.1038/nature06778. [DOI] [PMC free article] [PubMed] [Google Scholar]
- 4.Foster MW, et al. Trends Mol Med. 2003;9:160–168. doi: 10.1016/s1471-4914(03)00028-5. [DOI] [PubMed] [Google Scholar]
- 5.Jaffrey SR, et al. Nat Cell Biol. 2001;3:193–197. doi: 10.1038/35055104. [DOI] [PubMed] [Google Scholar]
- 6.Greco TM, et al. Proc Natl Acad Sci USA. 2006;103:7420–7425. doi: 10.1073/pnas.0600729103. [DOI] [PMC free article] [PubMed] [Google Scholar]
- 7.Paige JS, et al. Chem Biol. 2008;15:1307–1316. doi: 10.1016/j.chembiol.2008.10.013. [DOI] [PMC free article] [PubMed] [Google Scholar]
- 8.Hao G, et al. Proc Natl Acad Sci USA. 2006;103:1012–1017. doi: 10.1073/pnas.0508412103. [DOI] [PMC free article] [PubMed] [Google Scholar]
- 9.Roth AF, et al. Cell. 2006;125:1003–1013. doi: 10.1016/j.cell.2006.03.042. [DOI] [PMC free article] [PubMed] [Google Scholar]
- 10.Hara MR, et al. Nat Cell Biol. 2005;7:665–674. doi: 10.1038/ncb1268. [DOI] [PubMed] [Google Scholar]
- 11.Forrester MT, et al. J Biol Chem. 2007;282:13977–13983. doi: 10.1074/jbc.M609684200. [DOI] [PubMed] [Google Scholar]
- 12.Benhar M, et al. Science. 2008;320:1050–1054. doi: 10.1126/science.1158265. [DOI] [PMC free article] [PubMed] [Google Scholar]
- 13.Liu L, et al. Cell. 2004;116:617–628. doi: 10.1016/s0092-8674(04)00131-x. [DOI] [PubMed] [Google Scholar]; Ross PL, et al. Mol Cell Proteomics. 2004;3:1154–1169. doi: 10.1074/mcp.M400129-MCP200. [DOI] [PubMed] [Google Scholar]
Associated Data
This section collects any data citations, data availability statements, or supplementary materials included in this article.


