Abstract
Alteration in regional cerebral blood flow (CBF) is the direct result of changes in neuronal activity. It is crucial to monitor the spatio-temporal characteristics of cerebro-vascular blood perfusion in the studies of cerebral diseases. Optical micro-angiography (OMAG) is a recently developed imaging technique capable of resolving 3D distribution of dynamic blood perfusion at a capillary level resolution within microcirculatory beds in vivo. Here we report the applications of OMAG in mouse ischemic stroke model. This study demonstrates that OMAG is a useful method capable of providing in vivo serial assessment of 3D cerebro-vascular pathophysiology with high sensitivity, and therefore, has the potential for use in the study of brain disorders and repairs.
Keywords: Optical micro-angiography (OMAG), cerebro-vascular blood perfusion, ischemic stroke
1. Introduction
It has been known for years that neurological activities correlate strongly with the changes of regional cerebral blood flow (CBF) and volume. This view has served as the base for interpretation of imaging results purporting to elucidate and establish this relationship, because if established, such relationship will in turn facilitate our fundamental understanding of cerebral diseases and therapeutic interventions. Although a number of imaging techniques have made significant contributions in this regard through imaging the CBF and its volume changes in animal models, important limitations on required spatial and temporal resolutions still remain. X-ray angiography, the currently preferred imaging tool in clinical practice, is invasive, and unlikely that it can provide the sufficient imaging resolution for small animal studies. Autoradiographic method is able to identify the endpoint CBF information, but is of limited use in delineating the dynamic cerebro-vascular evolution [1]. Newer imaging modalities, such as magnetic resonance imaging [2] and positron emission tomography [3] provide more than simple angiographic data and have certain advantages over conventional invasive techniques; however they are currently not able to image the microcirculations. In order to obtain desired spatial and temporal resolution, attention has been paid to some optical methods, such as optical intrinsic signal imaging [4], laser speckle imaging [5] and laser-Doppler flowmetry [6] techniques. However, these optical imaging techniques do not have the depth-resolved capability to image 3D microvasculature. Photoacoustic imaging [7], by measuring the ultrasound produced by local light absorption by the blood, has recently been reported to map vascular structure deep within the brain of small animals, but with limited spatial resolution. Confocal microscopy [8], a well-developed technique to overcome the poor imaging contrast, is able to produce in-focus cerebro-vasculature, but its limited imaging depth and requirement of the use of exogenous tracers are currently at least not suitable for non-invasive in vivo studies. An ideal modality to image and quantify cerebral microvascular perfusion in 3D should have sufficient sensitivity and specificity to detect the moving red blood cells (RBC), and be able to detect RBCs in microcirculatory tissue beds with high target-to-background ratio. For long-term characterization of the dynamic CBF, it is imperative that the system is non-invasive and reproducible, and capable of detecting blood flow changes sensitively and rapidly.
In this paper, we report the use of optical microangiography (OMAG) [9] to assess cerebral blood perfusion through the intact cranium in small rodent animal models. OMAG is a novel imaging technology developed by our group that is based on endogenous light scattering from biological tissue to obtain the microstructural and functional vascular images at capillary level resolution. To evaluate the potential of OMAG in imaging the dynamic CBF under pathological conditions, we used the well established ischemic stroke model to manipulate cerebral blood flow in mice. The results demonstrate that OMAG is a useful imaging method that can provide in vivo serial assessment of 3D cerebro-vascular patho-physiology with high sensitivity, and therefore, has the potential for use in the studies of brain disorders and repairs.
2. Materials and Methods
The OMAG system used in this study is shown schematically in Fig. 1A. It was based on the Michelson optical interferometer and similar to an optical fiber based frequency domain optical coherence tomography (FDOCT) system recently developed [10]. The light source was a broadband infrared superluminescent diode (SLD) with full-width-half-maximum (FWHM) of 68 nm centered at 1.3 μm. The light emerging at the output of interferometer was sent to a home built high-speed spectrometer that employed a line scan infrared InGaAs detector to capture the backscattering light emerged from the illuminated tissue surface. The system had an imaging resolution of 16 × 16 × 8 μm3 at x-y-z imaging direction; and optical ranging was 5.8 mm in air where 2.9 mm in positive space is used for structural imaging and 2.9 mm in negative space for blood perfusion imaging. The imaging rate was 10,000 axial scans (A scan) per second in this study, imaging speed was 10 frames/s and data acquisition time was 50 seconds for volumetric imaging under Labview environment. The 3D imaging of tissue sample in vivo was performed by an X-Y galvanometer scanner with a scanning priority in X direction (B scan). The X-scanner was driven by 10 Hz saw tooth waveform to provide B scan over ~2.5 mm at the sample, while the Y-scanner was driven by ~0.02Hz saw tooth waveform that provided the beam scanning in the elevational direction of also ~2.5 mm.
Figure 1.
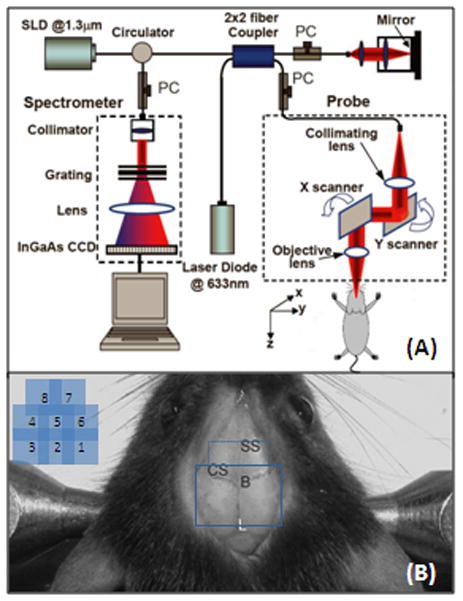
(A) Schematic of OMAG system used in this study, in which SLD represents the superluminescent diode and PC the polarization controller. Diagram (B) shows typical OMAG imaging area (in solid line) between bregma, B, and Lambda, L, by stitching six images together and whole-head image (in both solid and dash line). SS, sagittal suture; CS, coronal suture.
Different from FDOCT, the OMAG imaging was originally enabled by modulating the spectral interferogram with a constant frequency to separate the moving and static scattering particles within sample. This was previously achieved by mounting the reference mirror onto a linear piezo-translation stage that moved the mirror at a constant velocity across B scan [9]. Then the constant modulation frequency was introduced by offsetting the beam at the X-scanner in the sample arm [11], while the reference mirror was kept stationary during imaging. Because the light backscattered from moving particle carries a beating frequency, this beating frequency was used to distinguish scattering signals by the moving elements from those by the static elements. In a nutshell, OMAG mathematically maps the backscattered optical signals from the moving particles into one image – that is the blood flow image – while it simultaneously maps the backscattered optical signals from the static particles into a second image, which is the microstructural image. Currently this approach gave OMAG to resolve the minimal flow velocity of ~160μm/s.
Three-month-old C57/616 mice (20–30g) were used in the study to show the potential of OMAG monitoring of changes of dynamic CBF in vivo. The experimental protocol was in compliance with the federal guidelines for care and handling of small rodents and approved by the Institutional Animal Care and Use Committee. Prior to OMAG imaging, the mouse head was shaved and depilated. During the imaging, the animal was immobilized in a custom made stereotaxic stage and was lightly anesthetized with isoflurane (0.2 L/min O2, 0.8 L/min air). The body temperature was kept between 35.5–36.5 °C by use of a warming blanket, and monitored by a rectal thermal probe throughout the experiment. An incision of ~1 cm was made along the sagittal suture and the frontal parietal and interparietal bones were exposed by pulling the skin to the sides. The animal was then positioned under the OMAG scanning probe. In order to acquire the CBF images over a large area of the cortex, the scan was performed clockwise that resulted in six OMAG images covering areas between anterior coronal suture (Bregma) and posterior coronal suture (Lambda) as shown by solid line in Fig. 1B. For the whole-head scan, we can add two more scans as indicated by dash line in Fig. 1B. The total imaging time is less than ten minutes. A volume segmentation algorithm [12] was then applied to each OMAG images to isolate the blood flow signals within the cortex. The final OMAG image, representing the CBF over the mouse cortex, was obtained by stitching six (or eight if necessary) resulted images together and cropping. Before inducing brain injuries, a control OMAG image was acquired as the baseline for later comparison. After imaging, the animal was sutured, disinfected and injected with antibiotics, and then returned to the cage for rehabilitation. During this period, the animal received 1.5 mL volume resuscitation (SC saline + dextrose). A series of OMAG imaging were taken on the same animal at different time points as necessary.
Ischemic stroke was induced in adult male mice using the intraluminal middle cerebral artery occlusion (MCAO) technique, as previously described [13]. Briefly, anesthesia used 1.5-1% isoflurane depending on breathing rate. Rectal temperature was controlled at 37°C by use of water pad. A small laser-Doppler probe was affixed to the right parietal/temporal side of the skull to monitor blood flow and verify vascular occlusion and reperfusion. When the baseline blood flow was steady, a silicone-coated 6–0 nylon monofilament was inserted into the right internal carotid artery (ICA) via the external carotid artery (ECA) until laser-Doppler signal dropped to < 30% of baseline read by laser-Doppler flowmetry (LDF). After securing the filament in place, the surgical site was closed. In this study, after 30 minutes onset of occlusion, OMAG images were captured. Then the animal was awakened and assessed at 1 hour of occlusion for neurological deficit using a simple neurological scoring system as follows: 0=no deficit, 1=failure to extend forelimb, 2=circling, 3=unilateral weakness, 4=no spontaneous motor activity. Mice with neurological deficit score between 1 and 3 were re-anesthetized, laser-Doppler probe repositioned over same site on the skull, and the occluding filament was withdrawn to allow for reperfusion. Mice were then allowed to recover and were observed for 30 minutes. Then, the next OMAG imaging was taken at 30 minutes after reperfusion.
3. Results and Discussion
To access the performance afforded by OMAG, we used the OMAG system described in Fig. 1A to image micro-vascular blood perfusion over the brain cortex in the normal mouse with the cranium left intact. Figures 2A and 2B shows one representative image (B scan) obtained from raw spectral interferograms captured by the detecting spectrometer system. Figure 2A is the flow map showing all moving components, such as the moving red blood cells in all blood vessels, including capillaries. Figure 2B is the structure map containing the normal OCT/OMAG cross-sectional image within which the anatomically important layers such as cranium and cortex can be clearly demonstrated, but it is almost impossible to identify the blood vessels. Because the flow and structure images are co-registered in OMAG, they can be combined into a single image. This combined image can be used to precisely localize the blood vessels within the brain tissue (Fig. 2C), which can be compared with the corresponding histological section (H&E) (Fig. 2D). Similar to conventional OCT, OMAG is able to resolve the cortical structures and blood perfusion at depths of ~ 1.5 mm through the skull, a penetration depth that cannot be achieved by confocal microscopy. The axial resolution was ~ 8 μm within the biological tissue, which is determined by the bandwidth of the light source used and is capable of resolving the capillaries with an average size of ~10μm. The lateral imaging resolution was approximately 16 μm as determined by the objective lens that focused the sample light onto tissue. Compared with confocal microcopy and laser speckle imaging, OMAG does not need to prepare “cranial window” for imaging, and thus it potentially avoids any complications involved during the procedure, such as the changes in temperature and cranial pressure that may affect the alterations in CBF.
Figure 2.
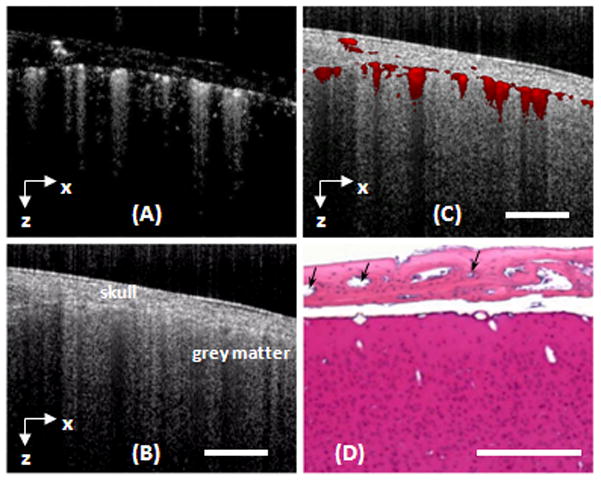
A cross-section of a mouse brain with the skull intact was imaged with OMAG in vivo. (A) and (B) are the flow and structural images obtained by OMAG. (C) The fused OMAG image showing the blood vessel locations in the cortex and skull bone. (D) The corresponding histological section by H&E staining where the blood vessels in the skull bone are denoted by black arrows. White bar represents 500 μm.
By scanning the probe beam progressively in x-y direction and then processing the raw spectrograms slice by slice, we can reconstruct a 3D OMAG image, from which the detailed information regarding micro-vascular blood perfusion can be obtained. Figure 3 is an example obtained from a tissue volume of 2.5 × 2.5 × 1.7(x-y-z) mm3 of an adult mouse brain with the cranium intact. With this 3D volume data set, the orientation and location of blood vessels can be identified (Figs. 3A, 3D–3F). Using suitable software, the 3D view can be rotated, cut from any angle to examine the blood flows at different depths within tissue in detail. Additionally, with the application of volume segmentation algorithm, the blood perfusion in the skull bone and meninges are able to be separated from those within brain cortex, shown in Figs. 3B and 3C, respectively. This transcranial blood perfusion with high imaging resolution and sufficient imaging depth would provide us a good opportunity to capture the perfusion information of specific areas where other imaging methods are difficult to reach. By stitching eight images together as shown in Fig. 1B, Fig. 4A shows a mosaicing OMAG image that provide us an ability to examine micro-vascular morphology in a whole brain tissue, compared with the photography taken with and without skull. Imaging acquisition time is another critical factor to investigate the response of cerebrovascular perfusion under a variety of pathological and therapeutic conditions. Our current preliminary system can provide the temporal resolutions of 0.1 s and 50 s to obtain 2D and 3D OMAG images, respectively. As we are aware, currently no other imaging tools can non-invasively delineate such detailed cerebral vasculature within one minute.
Figure 3.
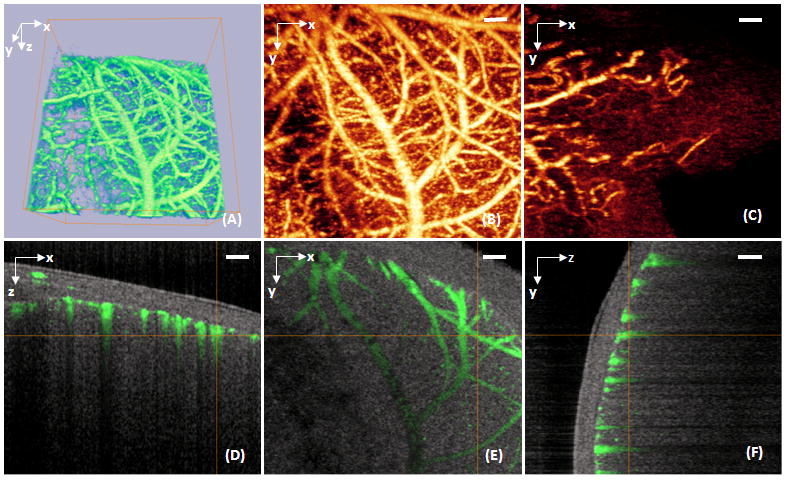
A volume of 2.2×2.2×1.7 (x-y-z) mm3 of an adult mouse brain with the skull intact was imaged with OMAG in vivo. (A) 3D volumetric rendering of the blood perfusion within the scanned tissue volume. (B) 2D x–y projection view of cerebro-vascular flow that maps the detailed blood vessel network. (C) 2D x–y projection map showing the blood flow within the skull bone. (D), (E) and (F) are, respectively, the coronal, transverse and sagittal views of the blood flows fused with the depth-resolved micro-structures. White bar represents 200 μm.
Figure 4.
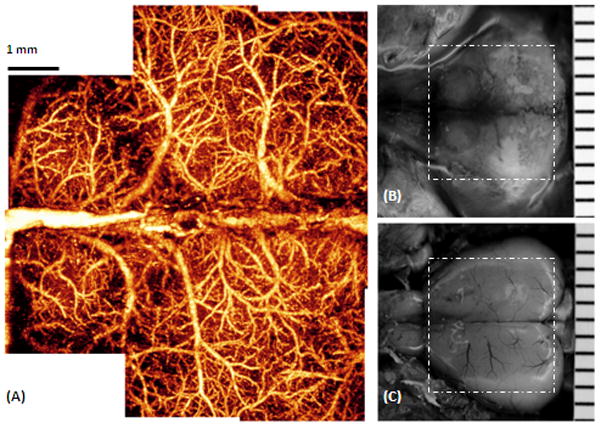
The entire cerebro-vascular flow over the cortex of an adult mouse with the skull intact was imaged with OMAG in vivo. (A) is the projection view of blood perfusion that reveals the detailed blood perfusion network over the cortex at capillary level resolution. (B) Photography of the skull with the skin folded aside, taken right after the OMAG imaging where viewing the vasculature through the skull is not possible. (C) Photography of blood vessels over the cortex, after the skull and the meninges of the same mouse were carefully removed. The superficial major blood vessels are in agreement with those in OMAG image in (A). The area marked with the dashed white box represents 7.5×7.5 mm2.
In our preliminary experiments, OMAG was performed in a typical ischemic stroke model to show its potential on monitoring structural and functional cerebral blood perfusion in the study of cerebro-vascular disease in mice. Figure 5A is the OMAG flow image from baseline, i.e. the control, where it shows the capability of OMAG to delineate the cerebral perfusion over the cortex while the skull was left intact. The result at 30 minutes after the beginning of MCAO shows that OMAG is able to indicate the alterations in blood perfusion within cortex (Fig. 5B). Compared to baseline, the ischemic status caused by progressive focal occlusion was apparent in the ipsilateral region at this time point. At the ipsilateral side where ischemia was induced, the vessel constriction can be seen, which is supposed to be the direct result of brain autoregulation that the animal has to prevent it from the further hypoxia and ischemia. After 30 minutes onset of reperfusion, the blood perfusion in ipsilateral side restored in some region, while the residual occlusion was still apparent (Fig. 5C). This suggested that some occlusions were temporary, while others persisted even the filament was removed from MCA. Therefore, our OMAG results showed us the occlusive components of ischemic stroke model independent of whether the foreign body existed in MCA. These data paved a way for evaluating the potential use of this novel imaging technology in the aid of understanding the pathophysiology of cerebro-vascular diseases or brain disorder and the potential benefits of pharmacological interventions.
Figure 5.
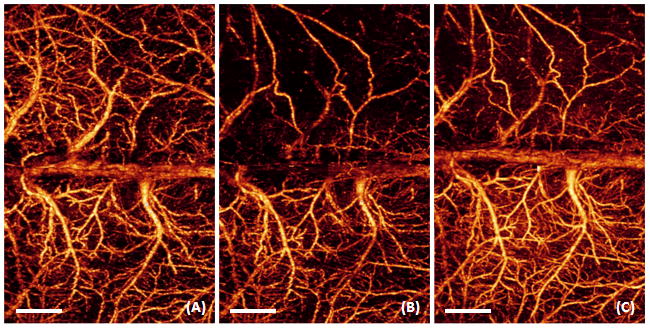
3D OMAG imaging of the cortex in ischemic stroke. Compared to baseline (A), progressive focal ischemia (B) developed during MCAO; (B) was taken at 30 min during MCAO. After 30 minutes onset of reperfusion (C), the blood perfusion in ipsilateral side restored in some region, while the residual occlusion was still apparent. White bar represents 1000 μm.
4. Conclusion
We have shown that OMAG is capable of delivering superior imaging performance in mapping the dynamic cerebro-vascular perfusion with high resolution. The imaging of CBF can be achieved transcranially without the need for creating a “cranial window”. This way would prevent the resulting blood perfusion data from possible complications caused by such factors as brain temperature and pressure, and allow for the long-term monitoring of CBF over days or weeks on the same animals. We have demonstrated the potential of OMAG imaging in ischemic stroke model and studied the hemodynamics of microvascular perfusion in this type of cerebro-vascular disease. The results indicate that OMAG may provide a useful imaging tool to image the structural and functional microcirculations, which may aid our fundamental understanding of human cerebral diseases and pharmacological interventions.
Acknowledgments
The work was supported in part by research grants from the National Heart, Lung, and Blood Institute (R01 HL093140) and the American Heart Association (0855733G). The content is solely the responsibility of the authors and does not necessarily represent the official views of grant giving bodies.
References
- 1.Sakurada O, Kennedy C, Jehle J, Brown JD, Carbin GL, Sokoloff L. Measurement of local cerebral blood flow with iodo [14C] antipyrine. Am J Physiol. 1978;234:H59–66. doi: 10.1152/ajpheart.1978.234.1.H59. [DOI] [PubMed] [Google Scholar]
- 2.Calamante F, Thomas DL, Pell GS, Wiersma J, Turner R. Measuring cerebral blood flow using magnetic resonance imaging techniques. J Cereb Blood Flow Metab. 1999;19:701–735. doi: 10.1097/00004647-199907000-00001. [DOI] [PubMed] [Google Scholar]
- 3.Heiss WD, Graf R, Wienhard K, Lottgen J, Saito R, Fujita T, Rosner G, Wagner R. Dynamic penumbra demonstrated by sequential multitracer PET after middle cerebral artery occlusion in cats. J Cereb Blood Flow Metab. 1994;14:892–902. doi: 10.1038/jcbfm.1994.120. [DOI] [PubMed] [Google Scholar]
- 4.Grinvald A, Lieke E, Frostig RD, Gilbert CD, Wiesel TN. Functional architecture of cortex revealed by optical imaging of intrinsic signals. Nature. 1986;324:361–364. doi: 10.1038/324361a0. [DOI] [PubMed] [Google Scholar]
- 5.Dunn AK, Bolay H, Moskowitz MA, Boas DA. Dynamic imaging of cerebral blood flow using Laser Speckle. J Cereb Blood Flow Metab. 2001;21:195–201. doi: 10.1097/00004647-200103000-00002. [DOI] [PubMed] [Google Scholar]
- 6.Nielsen AN, Fabricius M, Lauritzen M. Scanning laser-Doppler flowmetry of rat cerebral circulation during cortical spreading depression. J Vasc Res. 2000;37:513–522. doi: 10.1159/000054084. [DOI] [PubMed] [Google Scholar]
- 7.Wang XD, Pang Y, Ku G, Xie X, Stoica G, Wang LH. Non-invasive laser-induced photoacoustic tomography for structural and functional imaging of the brain in vivo. Nat Biotechnol. 2003;21:803–806. doi: 10.1038/nbt839. [DOI] [PubMed] [Google Scholar]
- 8.Misgeld T, Kerschensteiner M. In vivo imaging of the diseased nervous system. Nat Rev Neurosci. 2006;7:449–463. doi: 10.1038/nrn1905. [DOI] [PubMed] [Google Scholar]
- 9.Wang RK, Jacques SL, Ma Z, Hurst S, Hanson S, Gruber A. Three dimensional optical angiography. Opt Express. 2007;15:4083–4097. doi: 10.1364/oe.15.004083. [DOI] [PubMed] [Google Scholar]
- 10.Wang RK. In vivo full range complex Fourier Domain optical coherence tomography. Appl Phys Lett. 2007;90:054103. [Google Scholar]
- 11.An L, Wang RK. Use of scanner to modulate spatial interferogram for in vivo full range Fourier domain optical coherence tomography. Optics Letters. 2007;32:3423–3425. doi: 10.1364/ol.32.003423. [DOI] [PubMed] [Google Scholar]
- 12.Wang RK, Hurst S. Mapping of cerebrovascular blood perfusion in mice with skin and cranium intact by Optical Micro-AngioGraphy at 1300nm wavelength. Optics Express. 2007;15:11402–11412. doi: 10.1364/oe.15.011402. [DOI] [PubMed] [Google Scholar]
- 13.Alkayed NJ, Goto S, Sugo N, Joh HD, Klaus J, Crain BJ, Bernard O, Traystman RJ, Hurn PD. Estrogen and Bcl–2: gene induction and effect of transgene in experimental stroke. J Neurosci. 2001;21:7543–7550. doi: 10.1523/JNEUROSCI.21-19-07543.2001. [DOI] [PMC free article] [PubMed] [Google Scholar]


