

Abstract
Mantle cell lymphoma (MCL) is an aggressive form of B cell lymphoma with a poor disease- free survival rate. The proteasome inhibitor, Bortezomib, is approved for treatment of relapsed and refractory MCL and has efficacy in about 30% of patients. However, the precise mechanism of action of Bortezomib is not well understood. This report establishes a requirement for the transcription repressor, PR Domain Zinc Finger Protein 1 (PRDM1, Blimp1) in the response to Bortezomib. Bortezomib rapidly induces transcription of PRDM1 as part of the apoptotic response in both cell lines and primary MCL tumor cells. Knockdown of PRDM1 blocks activation of NOXA and inhibits apoptosis, while ectopic expression of PRDM1 alone leads to apoptosis in MCL. Two novel direct targets of PRDM1 were identified, MKI67 (Ki-67) and PCNA in MCL cells. Both MKI67 and PCNA are required for proliferation and survival. Chromatin immunoprecipitation and knockdown studies reveal specific repression of MKI67 and PCNA is mediated by PRDM1 in response to Bortezomib. Furthermore promoter studies and mutation/deletion analysis demonstrate that PRDM1 functions through specific sites in the PCNA proximal promoter and an MKI67 distal upstream repression domain. Together these findings establish PRDM1 as a key mediator of Bortezomib activity in MCL.
Keywords: Non-Hodgkin’s B Cell Lymphoma, Proteasome, apoptosis, PCNA, Ki-67
INTRODUCTION
Mantle Cell lymphoma (MCL) is an aggressive form of B cell non-Hodgkin lymphoma which makes up 5%–10% of all human non-Hodgkins lymphomas.(1) It involves pre-germinal center B cells present in the mantle zone. MCL is generally characterized by the chromosomal translocation t(11;14)(q13;q32) leading to over-expression of cyclin D1.(2) In addition to cyclin D1 deregulation, MCL is one of the lymphoid malignancies associated with high chromosomal aberrations likely to play an important role in progression of the disease. TP53 mutations(3, 4) and INK4a/ARF deletion are some of the secondary genetic lesions associated with MCL that lead to high proliferation. The majority of MCL patients show a complete or partial clinical response to first line chemotherapeutic agents mainly based on the CHOP combination or hyperCVAD(2), but relapse is almost certain resulting in a median disease free survival of 3–4 years.(1)
In 2006 the FDA approved the proteasome inhibitor Bortezomib (PS-341, Velcade) for treatment of relapsed and refractory MCL.(3) Bortezomib has also been approved for treatment of refractory multiple myeloma.(4) Bortezomib is a boronic acid dipeptide that binds reversibly to the chymotrypsin–like site in the 20S core of the 26S proteasome.(5) Inhibition of the cellular proteasome activity by Bortezomib can alter multiple signaling pathways and bring about cytotoxicity. Bortezomib has been shown to inactivate the NFκB pathway in MCL as well as in multiple myeloma.(6) However, recent findings have shown that Bortezomib is active in MCL with proteasome-insensitive activation of NFκB.(7, 8) This indicates Bortezomib must also target other pathways. Bortezomib has been shown to induce apoptosis through the generation of reactive oxygen species (ROS) and activation of the NOXA pathway in MCL.(9) NOXA is a pro-apoptotic Bcl2 protein that can bind to anti-apoptotic Mcl-1 protein, thus releasing Bak from the Mcl-1 complex and promoting apoptosis of the cell. Besides involvement of these pathways, studies in multiple myeloma and some solid tumors such as head and neck cancers have revealed that Bortezomib can induce apoptosis by inducing ER stress due to the accumulation of misfolded proteins(10, 11) Improperly folded proteins can build up in the ER leading to activation of the stress signaling pathway known as the unfolded protein response (UPR). UPR is a three-pronged pathway comprising IRE1, pancreatic ER kinase (PERK) and activating transcription factor 6 (ATF6).(12) If ER stress is prolonged or severe UPR activation leads to cell cycle arrest and induction of apoptosis(13, 14).
PR Domain Zinc Finger Protein 1 (also known as PRDM1, Blimp-1, and PRDI-BF1) is a transcriptional repressor, required for terminal differentiation of B cells into antibody secreting plasma cells. During differentiation of mature B cells to plasma cells, PRDM1 represses several key target genes required for maintaining the B cell phenotype and in maintaining cellular proliferation such as CIITA, PAX5, Spi-B, Id3 and c-myc (15–19). PRDM1 functions as a repressor by recruiting to the DNA multiple co-repressor proteins including the histone H3 methyltransferase, G9a,(20) the histone deacetylase HDAC2, (21) and the arginine methyltransferase PRMT5(22). In addition PRDM1 may displace IRF transcriptional activators through DNA binding site competition at some promoters.(23) PRDM1 exists in two isoforms, the full length PRDM1α and a truncated form, PRDM1β. The truncated PRDM1β which is abundantly expressed in proliferating myeloma cells and myeloma cell lines is functionally impaired.(24) Recently, PRDM1 expression has been detected in a subset of diffuse large B cell lymphomas (DLBCL).(25–27) However, inactivating mutations were observed in each case, indicating a tumor suppressor role for PRDM1.(25, 26) Additionally, ectopic expression of PRDM1 in lymphoma cells can induce apoptosis.(28) Moreover, induction of PRDM1 transcription in lymphoma cells by anti-IgM treatment induces apoptosis in these cells.(29–31) PRDM1 also has been linked to cellular stress and the unfolded protein response.(32) Together this suggests that PRDM1 is capable of inducing apoptosis in B cells when expressed outside of the plasma cell transition stage.
PRDM1 has not previously been investigated in the context of Bortezomib treatment of lymphoma. This report demonstrates that in MCL PRDM1 is required for the apoptotic effect of Bortezomib. Bortezomib induced PRDM1 functions at least in part through direct repression of MKI67 and PCNA and inhibits NOXA activity. These findings reveal that PRDM1 is an essential component of the apoptotic response in MCL and a potential important marker for the effectiveness of Bortezomib therapy.
MATERIALS AND METHODS
Cell lines, primary cells and reagents
The Mino and Jeko-1 Mantle cell lymphoma cell lines were established and obtained from Dr. R. Lai (33, 34) and maintained in RPMI medium (Invitrogen) supplemented with 10% fetal bovine serum (HyClone), and 1% penicillin/streptomycin (Invitrogen). Bortezomib (LC Laboratories) was resuspended in mannitol to make a 10mM stock solution. Primary MCL samples were maintained in 50% RPMI supplemented with 10% fetal bovine serum and 50% stromal conditioned medium. Stromal conditioned medium was collected from HS5 bone marrow stromal cells cultured in RPMI for 3 days.
Apoptosis assay
Cells were treated with 5nM Bortezomib or as control an equal volume of mannitol, continuously for 20 hours followed by Annexin V-PE staining per manufacturer’s protocol (BD Pharmingen). Flow cytometry acquisition was done on a FACSCalibur and analyzed with CellQuest software (Becton Dickinson, Carpinteria, CA).
Immunoblotting
Whole cell lysates were prepared using modified RIPA buffer. Lysate from 5×10⁵ cells were resolved on 8% SDS-polyacrylamide gels and transferred to PVDF membranes (Millipore). The primary antibodies used were anti-PRDM1 (Cell Signaling), anti-Beta-actin (Sigma), anti-PARP (Cell Signaling). Secondary antibodies were obtained from Amersham Biosciences.
siRNA knockdown
All siRNAs were purchased from Dharmacon in the Accell modified formulation. Two PRDM1 siRNAs were confirmed to be active and selective and in most experiments were used in an equal mixture of 500nM each. Delivery of the siRNAs was carried out per manufacturer’s protocol. MCL cell line was incubated with the siRNAs in the Accell siRNA delivery medium for 24 hours followed by addition of 5nM of Bortezomib for 20 hours in presence of 2% FBS. A non-targeting siRNA (Dharmacon) was used as a control in all experiments.
Quantitative mRNA analysis
RNA was isolated from cells using TriZol reagent (Invitrogen) and the manufacturer’s protocol. One μg RNA was DNase-treated using RQ1 DNase (Promega), followed by first-strand cDNA synthesis using the iScript cDNA synthesis kit (Bio-Rad). 1/20th of the final cDNA reaction volume was used in each PCR reaction. All primers used are shown in Supplemental Table 1 and were confirmed to produce a single product by melting analysis with an efficiency of 90%–110% calculated from standard curves. Quantitiative PCR reactions were performed in a volume of 25 μl, which included 200 nM of each forward and reverse primer and PerfeCTa SYBR Green Supermix for iQ (Quanta). Reactions were run in duplicate using an iCycler and iQ software Version 1.0 (Bio-Rad) and duplicates were averaged. Threshold cycle (Ct) for the genes of interest were normalized to the Ct value of a control gene (GAPDH, Beta-actin, or GUSB) in each cDNA sample and relative levels of the genes of interest were calculated by the ΔΔCt method (35). Control genes for normalization were selected to have less than 10% variance between experimental conditions.
Isolation of nascent RNA
Nascent RNA was isolated as previously described (36). Briefly, nuclei from Mino cells infected with GFP or PRDM1α adenovirus, were isolated in a RNase-free buffer comprised of 140 mM NaCl, 1.5 mM MgCl2, 0.5% NP-40, 1000 U/ml RNaseOUT (Invitrogen), 1 mM DTT, and 50 mM Tris, pH 8. Extracted nuclei were washed in this buffer three times to remove cytoplasmic RNA, followed by lysis in a RNase-free buffer containing 300 mM NaCl, 1 M urea, 1% NP-40, 7.5 mM MgCl2, 0.5 mM EDTA, 1 mM DTT, and 20 mM HEPES, pH 7.6, to isolate histone-bound chromatin. RNA isolation was done as described above. Nascent RNA levels were measured by quantitative RT-PCR.
DNA constructs
Expression constructs for PRDM1α have been described previously by Ghosh et. al.(17) A human MKI67 promoter-luciferase construct consisting of 2709 base pairs upstream of the transcription start site and 74 base pairs downstream was cloned by PCR into the vector PCR2.1 (InVitrogen) using the MKI67 promoter primer set (Supplemental Table 2). The promoter was sub-cloned into the vector pGL3-basic (Promega) using XhoI and HindIII restriction sites to generate the proximal promoter construct, 2709-MKI67-Luc. A larger MKI67 promoter construct containing the distal PRDM1 site was generated by PCR and subcloning a 720 base pair distal enhancer region spanning −4099 to −3379 into the SmaI site of 2709-MKI67-Luc to create 720/2709-MKI67-Luc. A human PCNA promoter-luciferase construct consisting of 576 base pairs upstream of the transcription start site and 152 base pairs downstream was cloned by PCR into the vector PCR2.1 using the PCNA promoter primer set (Supplemental Table 2). The promoter was sub-cloned into the vector pGL3-basic using SmaI and KpnI restriction sites to generate the wild type PCNA promoter construct, 576-PCNA-Luc. The 576-PCNA-mutPRD-Luc construct was created by site directed mutagenesis of 576-PCNA-Luc converting 5′-TTTCACTTTCACTTT-3′ to 5′-TTTCtCTagaACTTT-3′ and was confirmed by sequencing (Mutagenex, Inc. Piscataway, NJ).
Transfections and luciferase assays
U2OS cells were transfected using FuGENE transfection reagent (Roche). Transfections for luciferase assays were done with 200ng of luciferase reporter, 200ng of PRDM1α plasmid or control pCDNA and 10 ng of the internal control plasmid pRL-TK. Cells were placed in complete medium for 42–48 hours and harvested for luciferase activity per the Dual-Luciferase Reporter Assay System protocol (Promega). Luciferase readings were done using the 20/20n luminometer (Turner Biosystems). Firefly luciferase activity was normalized to Renilla luciferase activity in all experiments
Chromatin Immunoprecipitation (ChIP)
Chromatin immunoprecipitation was carried out as described previously.(31) After 20 hours treatment with 5nM Bortezomib or control (mannitol) cells were harvested. Chromatin immunoprecipitation was carried out using 6×10⁶ cells and 1μg of specific antibody per immunoprecipitation. The antibodies used are PRDM1 (Cell Signaling), acetylated-H3K9 (Diagenode), dimethyl-H3K9 (Diagenode), and non-specific rabbit IgG (Upstate). The immunoprecipitated DNA was treated with RNase (Ambion) at 37 °C and proteinase K (Roche) for 1 hour at 45 °C. The DNA was purified with Qiagen PCR spin columns. Purified DNA was analyzed by quantitative PCR using specific primers described in Supplemental Table 3.
Immunoflourescence staining
1×10⁵ Mino cells treated with either 5nM Bortezomib for 20 hours or mannitol were spun down onto Shandon Cytoslides (Thermo Scientific). The cells were fixed by treating with 4% formaldehyde for 15 minutes at room temperature. Fixation for PCNA staining also included fixing with 100% methanol for 5 minutes at −20°C. This was followed by two washes in PBS. The cells were then permeabilized with 0.1% Triton X-100 for 7 minutes at room temperature. The cells were incubated with primary antibodies Ki67 (1:200) (Abcam) or PCNA (1:100) (Cell Signaling) for 1 hour at room temperature in a humid chamber. This is followed by 1 hour of incubation at room temperature with secondary antibodies conjugated to fluorochrome. The nuclei were stained with DAPI (Sigma). Anti- Rabbit conjugated to Alexa594 (Invitrogen) was used for Ki67 and Anti- Mouse conjugated to FITC was used for PCNA. Six images per slide were collected using the Zeiss Axiovert Upright Fluorescent microscope and fluorescent intensity was quantitated using Definiens image analysis software.
RESULTS
Bortezomib induces expression of PRDM1 along with induction of apoptosis in Mantle Cell Lymphoma
Bortezomib is an FDA-approved drug for treatment of refractory and relapsed MCL. In order to better understand the mechanism of action of Bortezomib in MCL we treated the MCL cell lines with a low dose of 5nM Bortezomib for 20 hours. Incubation with 5nM of Bortezomib induced apoptosis as indicated by PARP cleavage (Figure 1A) as well as a two fold increase in mRNA levels of the pro-apoptotic protein NOXA (Figure 1B). This apoptotic effect is consistent with previous observations of other MCL cell lines treated with Bortezomib.(9) We also observed that the induction of apoptosis is accompanied by a large increase in expression of PRDM1α protein (Figure 1A). Similarly, analysis of PRDM1 mRNA levels revealed a significant elevation of PRDM1α mRNA while PRDM1β mRNA was not affected (Figure 1C). To determine if the PRDM1 present is functionally active we analyzed the mRNA levels of PRDM1 target genes CIITA and PAX5 (Figure 1D). Expression of both CIITA and PAX5 were repressed in Bortezomib treated MCL cells consistent with PRDM1-mediated repression. We next sought to establish if a similar response is present in primary MCL cells freshly isolated from lymph nodes of MCL patients. Primary MCL cells incubated with increasing doses of Bortezomib revealed a consistent induction of PRDM1 protein expression (Figure 2A). The optimal dose varied between 5 and 10 nM in the patient samples indicating some heterogeneity in Bortezomib sensitivity. PRDM1 expression was paralleled by PARP cleavage indicating the cells were beginning to undergo apoptosis. PRDM1 mRNA levels also increased with Bortezomib treatment (Figure 2B). Consistent with the results in the Mino and Jeko-1 MCL cell lines only PRDM1α and not PRDM1β, was detected in all the primary MCL cells.
Figure 1. Bortezomib treatment induces PRDM1 and apoptosis in MCL cell line.
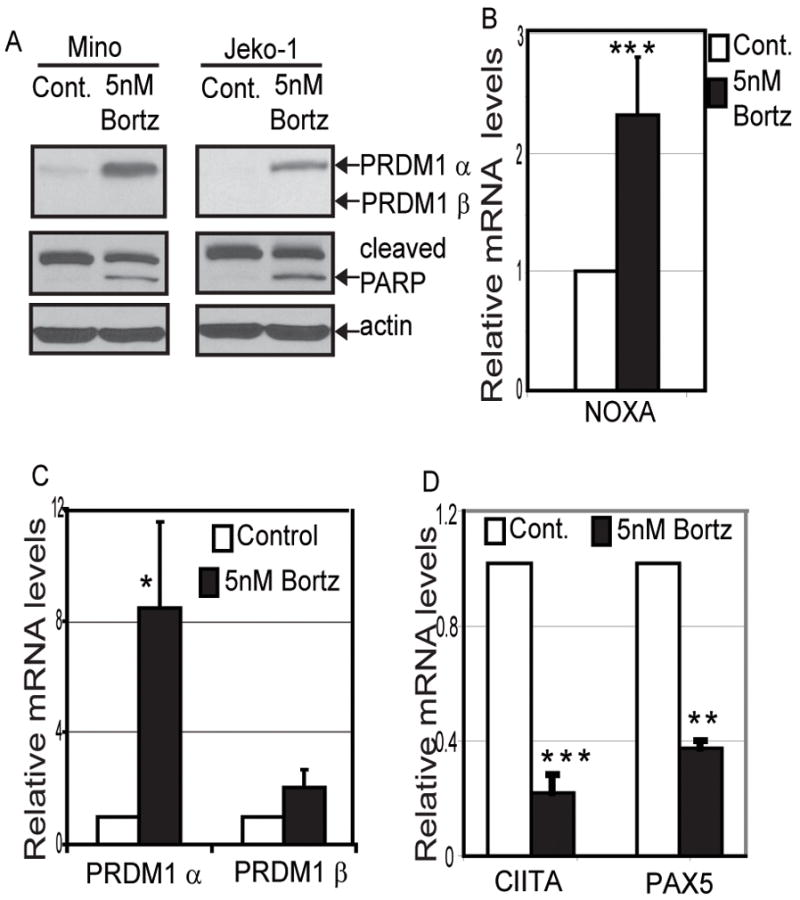
A) Immunoblot analysis for expression of PRDM1 and PARP cleavage in MCL cell lines Mino and Jeko-1 after treatment with 5nM Bortezomib for 20 hours. Beta-actin is the loading control. Treatment with 5nM Bortezomib for 20 hours induces B) mRNA expression of NOXA as well as C) PRDM1α mRNA levels but not PRDM1β. D) PRDM1 target genes CIITA and PAX5 mRNA levels are repressed by Bortezomib treatment. All mRNA levels were assessed by quantitative RT-PCR (RT-qPCR). The data is presented relative to the control cells after normalization to GAPDH and represents the mean of 3 independent experiments with the SEM (*** indicates p<0.002 * indicates p<0.05). Relative levels of PRDM1α and β mRNA in the control cells were 0.5 and 0.014 respectively.
Figure 2. Bortezomib treatment induces PRDM1 and apoptosis in primary MCL samples.
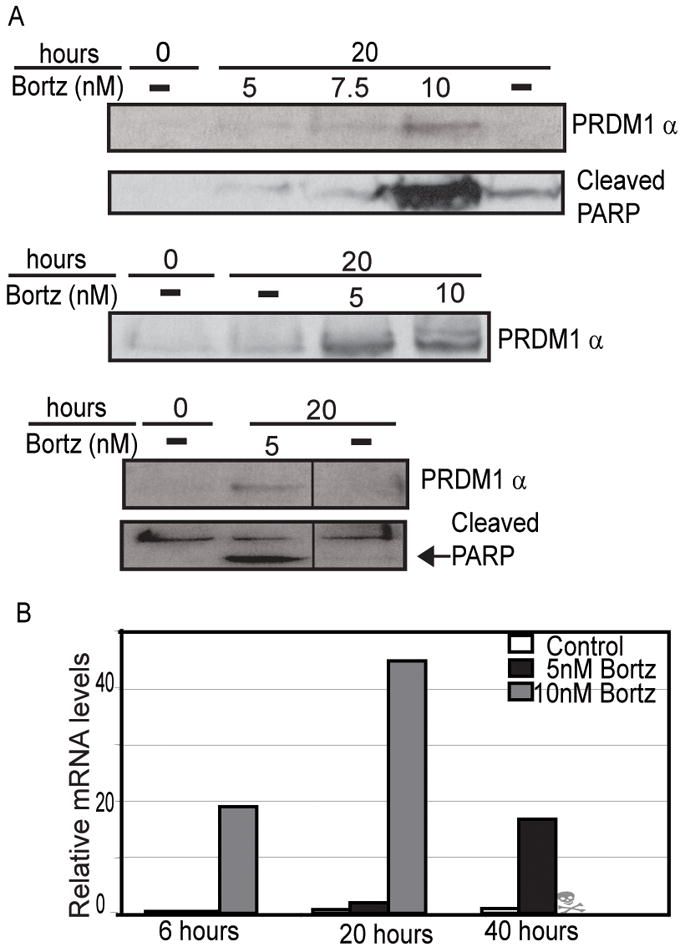
A) Immunoblot analysis of PRDM1α expression and PARP cleavage in three representative MCL patient samples treated with Bortezomib. The Bortezomib dose and duration of treatment is indicated above each lane. The dash indicates cells treated with an equal concentration of mannitol only. Only a single molecular weight size was detected for PRDM1 and it migrated at the position of PRDM1α. Each lane contains lysate from 5×10⁵ cells and loading was confirmed by beta-actin immunoblot (data not shown). B) RT-qPCR analysis of PRDM1α mRNA levels in MCL primary cells treated with 5nM and 10nM Bortezomib over a 40 hour time course. The data is normalized to the housekeeping gene, GUS-B. Data is representative of 5 MCL patient samples.
PRDM1 is required for the apoptotic effect of Bortezomib
Induction of PRDM1 by Bortezomib could be a required event for apoptosis to occur or alternatively could be a downstream result of apoptosis. In order to directly test these two alternatives, PRDM1 expression was blocked during Bortezomib exposure and the impact on apoptosis was examined. Mino MCL cells were incubated with two PRDM1 specific siRNA for 24 hours followed by a 20 hour treatment with 5nM of Bortezomib. Apoptosis was analyzed by Annexin V staining and PARP cleavage. As shown in Figure 3A, the PRDM1 specific siRNA was able to reduce expression of PRDM1α to near basal levels while the non-targeting control siRNA did not block expression. This reduction in PRDM1α was accompanied by reduction in PARP cleavage (Figure 3A). Knockdown of PRDM1 also significantly prevented the increase in Annexin V staining associated with Bortezomib induced apoptosis (Figure 3B). To further establish the role of PRDM1 in Bortezomib induced apoptosis we analyzed pro-apoptotic genes involved in the Bortezomib response. Bortezomib has been shown to up-regulate expression of NOXA in MCL and activate Caspase-8 and Caspase-9 in Multiple Myeloma.(37) Knockdown of PRDM1 in presence of Bortezomib led to approximately 60% reduction in NOXA expression (Figure 3C) and approximately 30% reduction in expression of Caspase-8 (Figure 3D) and Caspase-9 (Figure 3E). Thus the absence of PRDM1 significantly impairs the apoptotic outcome of Bortezomib treatment in MCL.
Figure 3. Knockdown of PRDM1 inhibits apoptotic effect of Bortezomib.
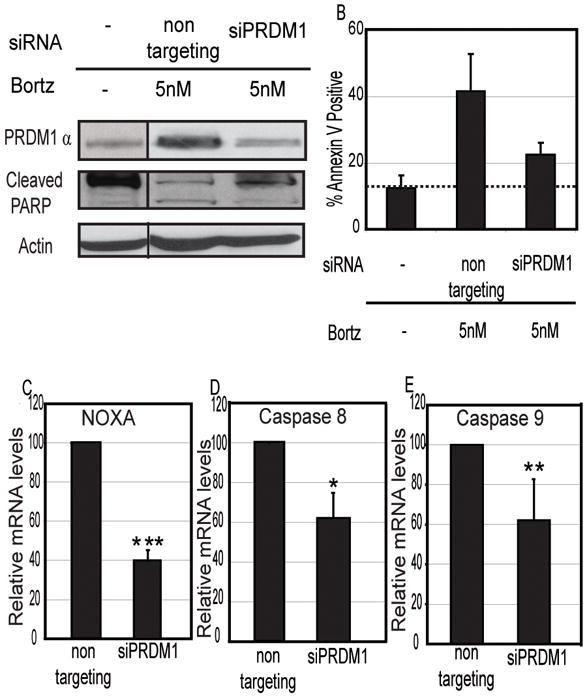
A) Immunoblot analysis of knockdown of PRDM1α expression in presence of Bortezomib and detection of apoptosis by PARP cleavage in MCL Mino cells. Non-targeting siRNA indicates siRNA specifically designed not to inhibit any known genes. siPRDM1 indicates the PRDM1 specific siRNA. B) Flow cytometric analysis of Annexin V staining. Bar graph represents percent Annexin V positive Mino MCL cells treated with Bortezomib in absence or presence of PRDM1 specific siRNA. Data shown are mean of 3 independent experiments with SEM. The dashed line marks the background level of Annexin V staining detected in untreated Mino cells. Knockdown of PRDM1 also leads to significant reduction in mRNA expression of pro-apoptotic genes C) NOXA, D) CASP8 (caspase 8) and E) CASP9 (caspase 9). mRNA levels were assessed by RT-qPCR. The data is normalized to Beta-actin and represents the mean of 3 independent experiments with the SEM (*** indicates p<0.002, ** indicates p<0.03, * indicates p<0.05).
Bortezomib treatment in Multiple Myeloma induces a stress response because of accumulation of unfolded or misfolded proteins.(10) To determine if a similar stress response occurs in MCL cells and if it is dependant on PRDM1 we analyzed the stress response protein XBP1. XBP1 mRNA undergoes unique cytoplasmic splicing in response to ER stress to switch from encoding a negative regulator of UPR to a potent transcriptional activator of UPR.(38) Analysis of both splicing isoforms of XBP1 revealed that Bortezomib does induce XBP1 splicing but that splicing does not diminish upon PRDM1 knockdown (Figure S1). This indicates that Bortezomib-mediated ER stress induction alone is not sufficient to induce apoptosis. Together these data reveal that PRDM1 expression is required for MCL cells to respond to Bortezomib.
We next wanted to determine if PRDM1 expression alone is sufficient to promote apoptosis in MCL cells or if additional events induced by Bortezomib are required. Since we observed that Bortezomib treatment induced only expression of PRDM1α and not the truncated PRDM1β, we over-expressed only the full length PRDM1α form. Mino MCL cells were transduced with a recombinant adenovirus expressing PRDM1α in the absence of Bortezomib treatment. Apoptosis was measured by Annexin V staining as well as PARP cleavage after 48 hours of infection. There was an approximate 50% increase in Annexin V staining in cells over-expressing PRDM1α when compared to control cells transduced with an adenovirus expressing only green fluorescent protein (Figure 4A). To confirm a specific apoptosis effect we examined PARP cleavage which is down stream of caspase activation. PARP cleavage is observed only in cells over-expressing PRDM1α (Figure 4B). This indicates that ectopic expression of PRDM1α in absence of Bortezomib leads to MCL apoptosis. Together these findings establish a central role for PRDM1 in the effect of Bortezomib and demonstrate that PRDM1 is both sufficient and required for the response.
Figure 4. Ectopic expression of PRDM1α leads to apoptosis of MCL cells in the absence of Bortezomib.
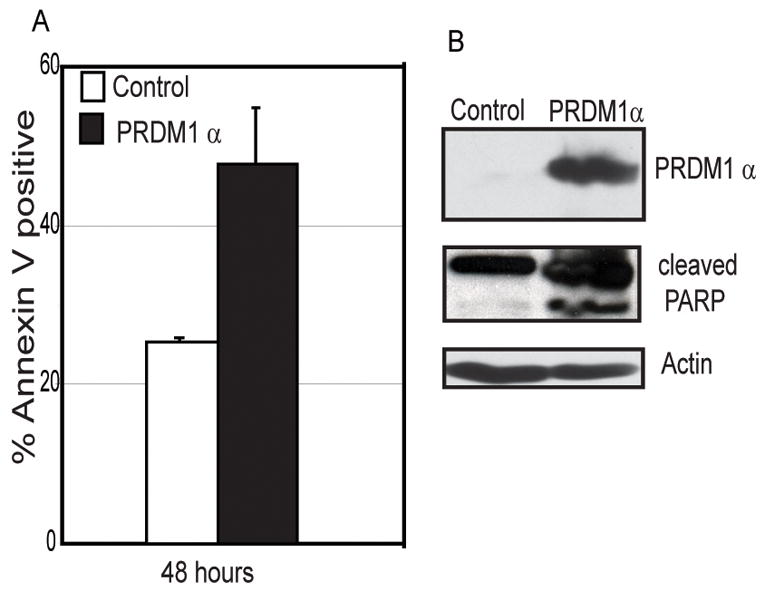
A) Flow cytometric analysis of Annexin V positive Mino MCL cells transduced with adenovirus expressing PRDM1α or GFP (control) for 48 hours. The data is mean of 3 independent experiments with SEM shown. B) Immunoblot analysis of PRDM1α expression and PARP cleavage indicating apoptosis in the adenoviral transduced Mino cells. Beta-actin is shown as the loading control.
Identification of direct PRDM1 targets in MCL
A limited number of direct PRDM1 targets have been identified during B cell differentiation into plasma cells including PAX5, CIITA, Myc, ID3 and Spi-B. In particular, down-regulation of Myc by PRDM1 upon anti-IgM treatment has been shown to induce apoptosis in Burkitt’s lymphoma cells.(30, 31) To determine if Bortezomib induced apoptosis in MCL also involves Myc down-regulation, we assessed Myc mRNA changes. Treatment with Bortezomib did not affect the mRNA levels of Myc (Figure S2) indicating that other PRDM1 targets must be involved in the Bortezomib response.
In order to identify novel PRDM1 direct targets in B cells we have used chromatin immunoprecipitation combined with hybridization to human promoter tiling arrays (ChIP-on-chip) [M. Maurin, manuscript in preparation]. This approach identified multiple targets involved in cell cycle regulation and proliferation, including MKI67 and PCNA. MKI67 codes for the antigen Ki67 which is a proliferative marker and is used as a predictor of survival in MCL. Increased levels of Ki67 in MCL have been associated with de-regulation of various cell cycle regulatory components such as over-expression of cyclin D1, HEC and BUB1B which are important for mitotic machinery and down-regulation of Protein Phosphate 2C, which can regulate growth by promoting expression of p53.(39) Furthermore, studies have shown that knockdown of Ki67 leads to cell death in human renal carcinoma cells.(40) PCNA codes for proliferating cell nuclear antigen which is found in the nucleus. PCNA is a multifunctional protein that plays a role in both DNA replication and DNA repair.(41) It is a subunit of DNA polymerase delta and can interact with p21 to pause replication while allowing DNA repair to occur. In addition loss of PCNA can lead to a p21 mediated growth arrest in lung epithelial cells exposed to hyperoxia.(42) Moreover, cells that lack PCNA expression undergo apoptosis. Studies have shown that in the WST knockout mouse model PCNA is absent from the thymus and spleen leading to reduced size of the tissues and expression of apoptotic markers in these tissues.(43) Together these observations suggested that PCNA and Ki-67 may be functionally important targets of PRDM1.
Sequence analysis of the MKI67 and PCNA promoter regions suggested potential binding sites for PRDM1 at a distal enhancer region of MKI67 (−4290 to −3594 bp) and the proximal promoter of PCNA (−818 to −235 bp, relative to the transcription start site). Binding of PRDM1 at these sites was determined by chromatin immunoprecipitation (ChIP) and quantitative PCR (Figure 5A). Mino MCL cells treated with 5nM Bortezomib show a significant binding of PRDM1 at both MKI67 and PCNA. The known PRDM1 targets, PAX5 and CIITA also demonstrated similar levels PRDM1 binding as expected. This binding is specific as no signal was detected at the HLA-DRA promoter. PRDM1 is known to repress its targets in part by recruiting the histone deacetylase, HDAC2, and the histone methyltransferase, G9a.(20, 21) This results in a loss of acetylation of the histones and specific di-methylation of histone H3 at the lysine 9 position both of which are associated with gene silencing. As shown in Figure 5B Bortezomib treatment leads to a decrease in histone H3 acetylation on the MKI67 and PCNA promoters. A similar decrease in acetylation is observed for PAX5 and CIITA while the control promoter HLA-DRA is not changed. The change in acetylation was accompanied by increases in di-methylation of histone H3 lysine 9 residues consistent with PRDM1-mediated silencing (Figure 5C).
Figure 5. Chromatin immunoprecipitation (ChIP) of PRDM1 and associated epigenetic marks at the MKI67 and PCNA promoter regions.

A) ChIP using the PRDM1 antibody in Mino MCL cells treated with 5nM Bortezomib for 20 hours. PRDM1 binding at MKI67 and PCNA promoters was significantly higher in Bortezomib treated cells compared to control cells (untreated). PAX5 and CIITA are positive controls for PRDM1 binding and HLA-DRA (DRα) is a negative control. Binding was quantified by qPCR and is presented as relative occupancy (antibody specific signal over signal obtained with non-specific IgG antibodies). The data is the mean of 3 independent experiements with the SEM shown (*** indicates p<0.002, ** indicates p<0.03, * indicates p<0.05). B) ChIP analysis of acetylation on histone H3 lysine 9. The conditions are as described for panel A except an antibody specific to H3 acetylated lysine was used and shows that acetylation is significantly decreased concordant with PRDM1 binding. C) ChIP analysis of histone H3 lysine 9 dimethylation levels. The conditions are as described for panel A except an antibody specific to dimethylated H3 lysine 9 was used and shows that dimethylation is significantly increased concordant with PRDM1 binding
PRDM1 regulates promoter activity of PCNA and MKI67
Since PRDM1 regulates its targets at the level of transcription, we cloned the human MKI67 and PCNA promoters to assess if PRDM1 can repress the promoter activity. A PCNA promoter spanning 576 base pairs upstream of the transcription start site and 152 base pairs downstream was cloned into a luciferase reporter plasmid. A potential PRDM1 binding site was identified by sequence homology at position −296 and was selectively mutated to create a PCNA mutant promoter construct. Luciferase activity of the wild type PCNA promoter was reduced by 60% in presence of PRDM1α (Figure 6A). In contrast, PRDM1α failed to repress the mutant PCNA promoter construct. This indicates that PRDM1 functions specifically though this DNA element to suppress PCNA.
Figure 6. PRDM1 represses PCNA and MKI67 luciferase promoter activity.

A) Cells were transfected with luciferase constructs containing either the PCNA wild type promoter (576-PCNA-Luc) or the promoter with a point mutation in the PRDM1 binding site (576-PCNA-mutPRD-Luc). Cells were co-transfected with a PRDM1α expression plasmid or an empty plasmid (−) as indicated in a 1:1 ratio (reporter to expression plasmid). Results are normalized to a co-transfected Renilla control vector and shown as the mean of three independent experiments with the SEM. B) Cells were transfected with either MKI67 proximal luciferase construct (2709-MKI67-Luc) which does not contain the PRDM1 binding site or the MKI67 promoter also containing the distal PRDM1 binding domain (720/2709-MKI67-Luc). The experiment was done and analyzed as described in panel A.
A similar study was carried out on the human MKI67 promoter. The PRDM1 binding site is located about 3.5kb upstream of the transcription start site. A basal promoter construct was created spanning 2709 base pairs upstream of the transcription start site and 74 base pairs downstream. In addition a 720 base pair fragment containing the distal PRDM1 binding site was cloned upstream of the proximal promoter. Analysis reveals that the proximal promoter construct was active but not altered by the presence of PRDM1α (Figure 6B). In contrast when the distal region containing the PRDM1 binding site is present the MKI67 promoter activity is repressed approximately 40%. This indicates that PRDM1 functions though specific DNA elements present in both the PCNA and MKI67 promoters.
PRDM1 directly represses endogenous target genes at level of transcription
The ChIP assay revealed that PRDM1 can directly bind to the novel target genes MKI67 and PCNA in MCL cells. Moreover, luciferase promoter activity for these promoters is repressed in presence of PRDM1. Thus, to validate the endogenous repressive activity of the PRDM1 induced by Bortezomib treatment, the RNA levels for MKI67 and PCNA were analyzed. Treatment of Mino and Jeko-1 MCL cells with 5nM of Bortezomib for 20 hours induces PRDM1 (Figure 1A) along with approximately 50%–80% repression of both MKI67 and PCNA at the mRNA level (Figure 7A). Knockdown of PRDM1 expression leads to a de-repression of MKI67 and PCNA mRNA (Figure 7B). This provides strong evidence that PRDM1 expression is required for the repression of MKI67 and PCNA in response to Bortezomib.
Figure 7. PRDM1α regulates endogenous MKI67 and PCNA at the level of transcription.

A) MKI67 and PCNA mRNA levels are repressed by Bortezomib treatment. RT-qPCR analysis of mRNA isolated from Mino and Jeko-1 cells treated with Bortezomib or vehicle only (control) for 20 hours. B) Knockdown of PRDM1 rescues expression of MKI67 and PCNA. RT-qPCR analysis of mRNA isolated from Mino and Jeko-1 cells treated with Bortezomib in presence or absence of siRNA knockdown of PRDM1. Non-target indicates the control siRNA designed to not target any known genes. The data in A and B is presented relative to the control cells after normalization to GAPDH and beta actin and represents the mean of 3 independent experiments with the SEM (*** indicates p<0.002, ** indicates p<0.03, * indicates p<0.05). C) Nascent RNA levels of MKI67 and PCNA are suppressed in Mino MCL cells ectopically expressing PRDM1α. PRDM1α indicates cells transduced with an adenovirus expressing PRDM1α while the control cells were transduced with adenovirus only expressing GFP. The data presented is relative to control cells after normalization to GAPDH and represents mean of 3 independent experiments with the SEM.(*** indicates p<0.002)
To further confirm that PRDM1 represses MKI67 and PCNA at the transcriptional level, we analyzed the nascent RNA levels for these genes after PRDM1α over-expression. Nascent RNAs are those RNAs that are still in the process of being transcribed and are an accurate measure of endogenous transcriptional activity.(36) The nascent RNA was purified from nuclei after extensive washing to remove the released transcripts and were quantified by quantitative RT-PCR. The nascent RNA levels for MKI67 in MCL cell line expressing PRDM1α showed a 70–80% repression (Figure 7C) when compared to control cells transduced with a control GFP expressing adenovirus. A similar extent of repression was observed for PCNA at the nascent RNA level (Figure 7C). Over-expression of PRDM1 did not repress the nascent RNA levels of PU.1, which is not a PRDM1 target. These data confirm that PRDM1 can specifically repress endogenous MKI67 and PCNA at the level of transcription in MCL.
To further assess that repression of MKI67 and PCNA by PRDM1 is functionally relevant, we analyzed the protein levels of these genes. Immunofluorescence staining reveals that Bortezomib treatment dramatically reduces both PCNA and Ki-67 levels. However, siRNA knockdown of PRDM1 expression prevents the loss of endogenous PCNA and Ki-67 protein levels in response to Bortezomib (Figure 8).
Figure 8. PRDM1 is required for the Bortezomib mediated suppression of PCNA and Ki-67.

A) Immunofluorescence staining of Mino and Jeko-1 MCL cells treated with Bortezomib in the presence or absence of siRNA mediated knockdown of PRDM1. PCNA protein detected by FITC (green), Ki-67 protein detected by Alexa594 (red), and DAPI nuclear staining (blue) is shown from a representative panel. Images shown at 63× magnification of original. B) Quantitative analysis of the immunofluorescence for Mino. Data was collected from 2 independent experiments with duplicate slides and at least 5 individual images per slide were analyzed for each condition by automated Difiniens software. (* indicate p<0.05)
DISCUSSION
Mantle cell lymphoma continues to have a poor prognosis and a low disease free survival rate. The proteasome inhibitor Bortezomib was approved for treatment of relapsed and refractory MCL in 2006(3) and shows promise with an overall response rate of 32%.(44) However, the specific mechanisms by which Bortezomib is cytotoxic to MCL remains unclear and presents a significant barrier to understanding how to improve or tailor Bortezomib therapy.(6, 8–11) The findings presented in this report now demonstrate that Bortezomib induction of apoptosis in MCL is accompanied by and requires induction of the transcriptional repressor protein, PRDM1. Induction of PRDM1 occurs at the level of transcriptional activation. Proteasome-mediated regulation of transcription has been reported in several systems and shown to impact activation, elongation as well as chromatin structure.(45, 46) In addition, PRDM1 has a PEST domain homology region which could target it for proteasomal degradation. While our studies have not excluded an additive effect of protein stabilization, clearly activation of PRDM1 transcription is required for MCL cells to respond to Bortezomib.
NOXA is a key pro-apoptotic sensor protein that leads to an increased activity of mitochondrial apoptotic pathway by activating BAK. Several recent studies have clearly linked NOXA to the Bortezomib response in both sensitive and intrinsically resistant MCL cells.(8, 9) Bortezomib selectively induced expression of NOXA but not other BH3-only proteins. Importantly, siRNA knockdown of NOXA resulted in an approximately 70% reduction of apoptosis indicating that NOXA is a key step in the Bortezomib response. Our findings indicate that induction of NOXA is dependent on induction of PRDM1. siRNA knockdown of PRDM1 not only inhibited apoptosis approximately 70% but also significantly blocked NOXA expression. This is consistent with a central role for NOXA but now also places PRDM1 activation upstream of NOXA induction in the response to Bortezomib. The mechanism of NOXA induction is not understood however it is unlikely that PRDM1, a repressor protein, directly activates the NOXA promoter. There is no evidence for PRDM1 binding to the NOXA promoter, rather PRDM1 is more likely to suppress additional gene(s) whose absence permits NOXA activations although this remains to be resolved.
Recent studies in DLBCL have identified inactivating mutations in the PRDM1 gene, indicating a tumor suppressor role for PRDM1.(25, 26) The PRDM1 protein has two isoforms, PRDM1α and the truncated PRDM1β which are transcribed from alternative promoters. PRDM1β has been shown to be highly expressed in myeloma cells and is associated with impairment of PRDM1 repressive activity. (24, 47) Additionally, expression of PRDM1β in DLBCL has been associated in one study with chemoresistance and poor disease outcome(48) indicating an impaired tumor suppressor activity of the β isoform. Related observations have been made in human myeloid leukemia cell lines in which cellular stress led to expression of PRDM1α but not PRDM1β.(32) Similarly, our findings demonstrate that Bortezomib exposure leads to selective expression of the PRDM1α isoform in MCL and support the idea that the PRDM1α isoform is the functionally active form and that the PRDM1β isoform arises to potentially squelch the activity.
To date mutations of PRDM1 have not been reported in MCL. MCL arises from pre-germinal center B cells, a stage preceding normal PRDM1 expression which first occurs in late germinal center B cells. Thus the abundant PRDM1 expression in MCL induced by Bortezomib is out of its normal physiological context which may facilitate the apoptotic outcome. This is consistent with our observation that ectopic expression of PRDM1α alone in MCL promotes apoptosis. Interestingly, a recent report has suggested that long term exposure of MCL cell lines to low doses of Bortezomib to induce drug resistance is accompanied by a plasmacytic like gene expression pattern, including PRDM1 expression.(49) This supports our findings that Bortezomib induces PRDM1 but suggests that suboptimal exposure to Bortezomib can induce a partial differentiation program. It will be interesting to determine if these resistant lines acquire expression of the PRDM1β isoform, similar to myeloma cells or if they acquire PRDM1 mutations similar to DLBCL in order to abrogate normal PRDM1 activity.
A very limited number of genes have been identified to be directly regulated by PRDM1. The majority of these genes are transcription factors related to B cell development and differentiation. Our discovery that PRDM1 directly represses two genes required for proliferation establishes a novel role for PRDM1 in regulating cell growth and viability. Furthermore, down-regulation or knockdown of either PCNA or MKI67 in tumor cells can induce apoptosis.(40, 42) Thus, PCNA and MKI67 may be highly potent targets of Bortezomib-induced PRDM1 by inhibiting proliferation as well as inducing apoptosis in MCL. Little information is available concerning the transcriptional regulation of MKI67 and this is the first report that PRDM1 directly suppresses MKI67. However, a recent finding in sebaceous glands has shown that cells expressing PRDM1 are devoid of Ki67 expression.(50) Similarly, microarray studies in B cells have shown an inverse correlation between PRDM1 expression and PCNA.(16) Moreover, the significance of our data may not be limited to the response of MCL to chemotherapeutic agents but may also have significance in T cell homeostasis. PRDM1 has been shown to play a role in maintaining T cell homeostasis by increasing apoptosis of effector and memory T cells.(51) In these studies there were no substantial changes observed in the key survival regulatory proteins such as myc, Bcl-2, Bcl-xL and CTLA4. It will be important to determine if PRDM1 can directly suppress MKI67 and PCNA in these T cells and induce apoptosis. It may also be possible that MCL tumor cells may have a unique response to PRDM1 when exposed to Bortezomib compared to normal cells. Further defining the global network of PRDM1 regulated genes in multiple cell types will be important to shed light on this question.
In conclusion, this is the first study identifying an important role for PRDM1 in Bortezomib induced apoptosis of MCL. We propose a mechanism of action in which PRDM1 induced by Bortezomib leads to direct repression of the proliferation markers MKI67 and PCNA inducing apoptosis in these cells. Finally, our data supports that approaches to directly target induction of PRDM1 may be an attractive means to enhance current therapies of MCL patients.
Supplementary Material
Acknowledgments
We thank the H. Lee Moffitt Cancer Center Flow Cytometry, Analytical Microscopy Core and Microarray core Facilities. This study was supported in part by research funding from NIH to KLW (NCI, CA080990).
Footnotes
Authorship and conflict of interest statements
Contributions: S.D. designed, performed research and wrote the manuscript, M.M, S.C.E.B performed research, M.A.S, S.D, J.T, and E.S. analyzed and interpreted data, K.L.W. provided experimental design, funding and helped write the manuscript. Conflict of interest disclosure: The authors declare no competing financial interest.
References
- 1.Jares P, Colomer D, Campo E. Genetic and molecular pathogenesis of mantle cell lymphoma: perspectives for new targeted therapeutics. Nat Rev Cancer. 2007;7(10):750–62. doi: 10.1038/nrc2230. [DOI] [PubMed] [Google Scholar]
- 2.Brody J, Advani R. Treatment of mantle cell lymphoma: current approach and future directions. Crit Rev Oncol Hematol. 2006;58(3):257–65. doi: 10.1016/j.critrevonc.2005.10.001. [DOI] [PubMed] [Google Scholar]
- 3.Kane RC, Dagher R, Farrell A, et al. Bortezomib for the treatment of mantle cell lymphoma. Clin Cancer Res. 2007;13(18 Pt 1):5291–4. doi: 10.1158/1078-0432.CCR-07-0871. [DOI] [PubMed] [Google Scholar]
- 4.Kane RC, Bross PF, Farrell AT, Pazdur R. Velcade: U.S. FDA approval for the treatment of multiple myeloma progressing on prior therapy. Oncologist. 2003;8(6):508–13. doi: 10.1634/theoncologist.8-6-508. [DOI] [PubMed] [Google Scholar]
- 5.Adams J, Kauffman M. Development of the proteasome inhibitor Velcade (Bortezomib) Cancer Invest. 2004;22(2):304–11. doi: 10.1081/cnv-120030218. [DOI] [PubMed] [Google Scholar]
- 6.Pham LV, Tamayo AT, Yoshimura LC, Lo P, Ford RJ. Inhibition of constitutive NF-kappa B activation in mantle cell lymphoma B cells leads to induction of cell cycle arrest and apoptosis. J Immunol. 2003;171(1):88–95. doi: 10.4049/jimmunol.171.1.88. [DOI] [PubMed] [Google Scholar]
- 7.Yang DT, Young KH, Kahl BS, Markovina S, Miyamoto S. Prevalence of bortezomib-resistant constitutive NF-kappaB activity in mantle cell lymphoma. Mol Cancer. 2008;7:40–54. doi: 10.1186/1476-4598-7-40. [DOI] [PMC free article] [PubMed] [Google Scholar]
- 8.Rizzatti EG, Mora-Jensen H, Weniger MA, et al. Noxa mediates bortezomib induced apoptosis in both sensitive and intrinsically resistant mantle cell lymphoma cells and this effect is independent of constitutive activity of the AKT and NF-kappaB pathways. Leuk Lymphoma. 2008;49(4):798–808. doi: 10.1080/10428190801910912. [DOI] [PubMed] [Google Scholar]
- 9.Perez-Galan P, Roue G, Villamor N, Montserrat E, Campo E, Colomer D. The proteasome inhibitor bortezomib induces apoptosis in mantle-cell lymphoma through generation of ROS and Noxa activation independent of p53 status. Blood. 2006;107(1):257–64. doi: 10.1182/blood-2005-05-2091. [DOI] [PubMed] [Google Scholar]
- 10.Obeng EA, Carlson LM, Gutman DM, Harrington WJ, Jr, Lee KP, Boise LH. Proteasome inhibitors induce a terminal unfolded protein response in multiple myeloma cells. Blood. 2006;107(12):4907–16. doi: 10.1182/blood-2005-08-3531. [DOI] [PMC free article] [PubMed] [Google Scholar]
- 11.Fribley A, Zeng Q, Wang CY. Proteasome inhibitor PS-341 induces apoptosis through induction of endoplasmic reticulum stress-reactive oxygen species in head and neck squamous cell carcinoma cells. Mol Cell Biol. 2004;24(22):9695–704. doi: 10.1128/MCB.24.22.9695-9704.2004. [DOI] [PMC free article] [PubMed] [Google Scholar]
- 12.Todd DJ, Lee AH, Glimcher LH. The endoplasmic reticulum stress response in immunity and autoimmunity. Nat Rev Immunol. 2008;8(9):663–74. doi: 10.1038/nri2359. [DOI] [PubMed] [Google Scholar]
- 13.Yamaguchi H, Wang HG. CHOP is involved in endoplasmic reticulum stress-induced apoptosis by enhancing DR5 expression in human carcinoma cells. J Biol Chem. 2004;279(44):45495–502. doi: 10.1074/jbc.M406933200. [DOI] [PubMed] [Google Scholar]
- 14.Brewer JW, Hendershot LM, Sherr CJ, Diehl JA. Mammalian unfolded protein response inhibits cyclin D1 translation and cell-cycle progression. Proc Natl Acad Sci U S A. 1999;96(15):8505–10. doi: 10.1073/pnas.96.15.8505. [DOI] [PMC free article] [PubMed] [Google Scholar]
- 15.Piskurich JF, Lin KI, Lin Y, Wang Y, Ting JP, Calame K. BLIMP-I mediates extinction of major histocompatibility class II transactivator expression in plasma cells. Nat Immunol. 2000;1(6):526–32. doi: 10.1038/82788. [DOI] [PubMed] [Google Scholar]
- 16.Shaffer AL, Lin KI, Kuo TC, et al. Blimp-1 orchestrates plasma cell differentiation by extinguishing the mature B cell gene expression program. Immunity. 2002;17(1):51–62. doi: 10.1016/s1074-7613(02)00335-7. [DOI] [PubMed] [Google Scholar]
- 17.Ghosh N, Gyory I, Wright G, Wood J, Wright KL. Positive regulatory domain I binding factor 1 silences class II transactivator expression in multiple myeloma cells. J Biol Chem. 2001;276(18):15264–8. doi: 10.1074/jbc.M100862200. [DOI] [PubMed] [Google Scholar]
- 18.Lin KI, Angelin-Duclos C, Kuo TC, Calame K. Blimp-1-dependent repression of Pax-5 is required for differentiation of B cells to immunoglobulin M-secreting plasma cells. Mol Cell Biol. 2002;22(13):4771–80. doi: 10.1128/MCB.22.13.4771-4780.2002. [DOI] [PMC free article] [PubMed] [Google Scholar]
- 19.Lin Y, Wong K, Calame K. Repression of c-myc transcription by Blimp-1, an inducer of terminal B cell differentiation. Science. 1997;276(5312):596–9. doi: 10.1126/science.276.5312.596. [DOI] [PubMed] [Google Scholar]
- 20.Gyory I, Wu J, Fejer G, Seto E, Wright KL. PRDI-BF1 recruits the histone H3 methyltransferase G9a in transcriptional silencing. Nat Immunol. 2004;5(3):299–308. doi: 10.1038/ni1046. [DOI] [PubMed] [Google Scholar]
- 21.Yu J, Angelin-Duclos C, Greenwood J, Liao J, Calame K. Transcriptional repression by blimp-1 (PRDI-BF1) involves recruitment of histone deacetylase. Mol Cell Biol. 2000;20(7):2592–603. doi: 10.1128/mcb.20.7.2592-2603.2000. [DOI] [PMC free article] [PubMed] [Google Scholar]
- 22.Ancelin K, Lange UC, Hajkova P, et al. Blimp1 associates with Prmt5 and directs histone arginine methylation in mouse germ cells. Nat Cell Biol. 2006;8(6):623–30. doi: 10.1038/ncb1413. [DOI] [PubMed] [Google Scholar]
- 23.Kuo TC, Calame KL. B lymphocyte-induced maturation protein (Blimp)-1, IFN regulatory factor (IRF)-1, and IRF-2 can bind to the same regulatory sites. J Immunol. 2004;173(9):5556–63. doi: 10.4049/jimmunol.173.9.5556. [DOI] [PubMed] [Google Scholar]
- 24.Gyory I, Fejer G, Ghosh N, Seto E, Wright KL. Identification of a functionally impaired positive regulatory domain I binding factor 1 transcription repressor in myeloma cell lines. J Immunol. 2003;170(6):3125–33. doi: 10.4049/jimmunol.170.6.3125. [DOI] [PubMed] [Google Scholar]
- 25.Pasqualucci L, Compagno M, Houldsworth J, et al. Inactivation of the PRDM1/BLIMP1 gene in diffuse large B cell lymphoma. J Exp Med. 2006;203(2):311–7. doi: 10.1084/jem.20052204. [DOI] [PMC free article] [PubMed] [Google Scholar]
- 26.Tam W, Gomez M, Chadburn A, Lee JW, Chan WC, Knowles DM. Mutational analysis of PRDM1 indicates a tumor-suppressor role in diffuse large B-cell lymphomas. Blood. 2006;107(10):4090–100. doi: 10.1182/blood-2005-09-3778. [DOI] [PubMed] [Google Scholar]
- 27.Garcia JF, Roncador G, Sanz AI, et al. PRDM1/BLIMP-1 expression in multiple B and T-cell lymphoma. Haematologica. 2006;91(4):467–74. [PubMed] [Google Scholar]
- 28.Messika EJ, Lu PS, Sung YJ, et al. Differential effect of B lymphocyte-induced maturation protein (Blimp-1) expression on cell fate during B cell development. J Exp Med. 1998;188(3):515–25. doi: 10.1084/jem.188.3.515. [DOI] [PMC free article] [PubMed] [Google Scholar]
- 29.Hasbold J, Klaus GG. Anti-immunoglobulin antibodies induce apoptosis in immature B cell lymphomas. Eur J Immunol. 1990;20(8):1685–90. doi: 10.1002/eji.1830200810. [DOI] [PubMed] [Google Scholar]
- 30.Kaptein JS, Lin CK, Wang CL, et al. Anti-IgM-mediated regulation of c-myc and its possible relationship to apoptosis. J Biol Chem. 1996;271(31):18875–84. doi: 10.1074/jbc.271.31.18875. [DOI] [PubMed] [Google Scholar]
- 31.Desai S, Bolick SC, Maurin M, Wright KL. PU.1 regulates positive regulatory domain I-binding factor 1/Blimp-1 transcription in lymphoma cells. J Immunol. 2009;183(9):5778–87. doi: 10.4049/jimmunol.0901120. [DOI] [PMC free article] [PubMed] [Google Scholar]
- 32.Doody GM, Stephenson S, Tooze RM. BLIMP-1 is a target of cellular stress and downstream of the unfolded protein response. Eur J Immunol. 2006;36(6):1572–82. doi: 10.1002/eji.200535646. [DOI] [PubMed] [Google Scholar]
- 33.Amin HM, McDonnell TJ, Medeiros LJ, et al. Characterization of 4 mantle cell lymphoma cell lines. Arch Pathol Lab Med. 2003;127(4):424–31. doi: 10.5858/2003-127-0424-COMCLC. [DOI] [PubMed] [Google Scholar]
- 34.Lai R, McDonnell TJ, O’Connor SL, et al. Establishment and characterization of a new mantle cell lymphoma cell line, Mino. Leuk Res. 2002;26(9):849–55. doi: 10.1016/s0145-2126(02)00013-9. [DOI] [PubMed] [Google Scholar]
- 35.Livak KJ, Schmittgen TD. Analysis of relative gene expression data using real-time quantitative PCR and the 2(-Delta Delta C(T)) Method. Methods. 2001;25(4):402–8. doi: 10.1006/meth.2001.1262. [DOI] [PubMed] [Google Scholar]
- 36.Wuarin J, Schibler U. Physical isolation of nascent RNA chains transcribed by RNA polymerase II: evidence for cotranscriptional splicing. Mol Cell Biol. 1994;14(11):7219–25. doi: 10.1128/mcb.14.11.7219. [DOI] [PMC free article] [PubMed] [Google Scholar]
- 37.Gomez-Bougie P, Wuilleme-Toumi S, Menoret E, et al. Noxa up-regulation and Mcl-1 cleavage are associated to apoptosis induction by bortezomib in multiple myeloma. Cancer Res. 2007;67(11):5418–24. doi: 10.1158/0008-5472.CAN-06-4322. [DOI] [PubMed] [Google Scholar]
- 38.Yoshida H, Oku M, Suzuki M, Mori K. pXBP1(U) encoded in XBP1 pre-mRNA negatively regulates unfolded protein response activator pXBP1(S) in mammalian ER stress response. J Cell Biol. 2006;172(4):565–75. doi: 10.1083/jcb.200508145. [DOI] [PMC free article] [PubMed] [Google Scholar]
- 39.Ek S, Bjorck E, Porwit-MacDonald A, Nordenskjold M, Borrebaeck CA. Increased expression of Ki-67 in mantle cell lymphoma is associated with de-regulation of several cell cycle regulatory components, as identified by global gene expression analysis. Haematologica. 2004;89(6):686–95. [PubMed] [Google Scholar]
- 40.Zheng JN, Ma TX, Cao JY, et al. Knockdown of Ki-67 by small interfering RNA leads to inhibition of proliferation and induction of apoptosis in human renal carcinoma cells. Life Sci. 2006;78(7):724–9. doi: 10.1016/j.lfs.2005.05.064. [DOI] [PubMed] [Google Scholar]
- 41.Paunesku T, Mittal S, Protic M, et al. Proliferating cell nuclear antigen (PCNA): ringmaster of the genome. Int J Radiat Biol. 2001;77(10):1007–21. doi: 10.1080/09553000110069335. [DOI] [PubMed] [Google Scholar]
- 42.Gehen SC, Vitiello PF, Bambara RA, Keng PC, O’Reilly MA. Downregulation of PCNA potentiates p21-mediated growth inhibition in response to hyperoxia. Am J Physiol Lung Cell Mol Physiol. 2007;292(3):L716–24. doi: 10.1152/ajplung.00135.2006. [DOI] [PubMed] [Google Scholar]
- 43.Woloschak GE, Chang-Liu CM, Chung J, Libertin CR. Expression of enhanced spontaneous and gamma-ray-induced apoptosis by lymphocytes of the wasted mouse. Int J Radiat Biol. 1996;69(1):47–55. doi: 10.1080/095530096146174. [DOI] [PubMed] [Google Scholar]
- 44.Goy A, Bernstein SH, Kahl BS, et al. Bortezomib in patients with relapsed or refractory mantle cell lymphoma: updated time-to-event analyses of the multicenter phase 2 PINNACLE study. Ann Oncol. 2009;20(3):520–5. doi: 10.1093/annonc/mdn656. [DOI] [PMC free article] [PubMed] [Google Scholar]
- 45.Lee D, Ezhkova E, Li B, Pattenden SG, Tansey WP, Workman JL. The proteasome regulatory particle alters the SAGA coactivator to enhance its interactions with transcriptional activators. Cell. 2005;123(3):423–36. doi: 10.1016/j.cell.2005.08.015. [DOI] [PubMed] [Google Scholar]
- 46.Kinyamu HK, Archer TK. Proteasome activity modulates chromatin modifications and RNA polymerase II phosphorylation to enhance glucocorticoid receptor-mediated transcription. Mol Cell Biol. 2007;27(13):4891–904. doi: 10.1128/MCB.02162-06. [DOI] [PMC free article] [PubMed] [Google Scholar]
- 47.Ocana E, Gonzalez-Garcia I, Gutierrez NC, Mora-Lopez F, Brieva JA, Campos-Caro A. The expression of PRDI-BF1 beta isoform in multiple myeloma plasma cells. Haematologica. 2006;91(11):1579–80. [PubMed] [Google Scholar]
- 48.Liu YY, Leboeuf C, Shi JY, et al. Rituximab plus CHOP (R-CHOP) overcomes PRDM1-associated resistance to chemotherapy in patients with diffuse large B-cell lymphoma. Blood. 2007;110(1):339–44. doi: 10.1182/blood-2006-09-049189. [DOI] [PubMed] [Google Scholar]
- 49.Perez Galan P, Jensen Helena Mora, Weniger Marc A, Chapman Colby M, Liu Poching, Raghavachari Nalini, Shaffer Arthur L, III, Staudt Louis M, Wiestner Adrian. Bortezomib resistance in Mantle Cell Lymphoma is associated with expression of a plasmacytoid differentiation program. Blood. 2009;114 (Abstract 287) [Google Scholar]
- 50.Horsley V, O’Carroll D, Tooze R, et al. Blimp1 defines a progenitor population that governs cellular input to the sebaceous gland. Cell. 2006;126(3):597–609. doi: 10.1016/j.cell.2006.06.048. [DOI] [PMC free article] [PubMed] [Google Scholar]
- 51.Kallies A, Hawkins ED, Belz GT, et al. Transcriptional repressor Blimp-1 is essential for T cell homeostasis and self-tolerance. Nat Immunol. 2006;7(5):466–74. doi: 10.1038/ni1321. [DOI] [PubMed] [Google Scholar]
Associated Data
This section collects any data citations, data availability statements, or supplementary materials included in this article.