

Abstract
Estimation of human exposures to polycyclic aromatic hydrocarbons (PAHs) is often desired for the epidemiological studies of cancer. One way to obtain information about indoor levels of PAHs is to measure these chemicals in house dust. In this study, we evaluated the predictive value of self-reported and geographic data for estimating measured levels of nine PAHs in house dust from 583 households in the Northern California Childhood Leukemia Study (NCCLS). Using multivariable linear regression models, we evaluated the effects on house-dust PAH concentrations from the following covariates: residential heating sources, smoking habits, house characteristics, and outdoor emission sources. House dust was collected from 2001 to 2007, usingboth high-volume surface samplers and household vacuum cleaners, and was analyzed for nine PAHs using gas chromatography-mass spectrometry. All nine PAHs were detected in more than 93% of dust samples, with median concentrations ranging from 14 to 94 ng/g dust. Statistically significant effects on PAH concentrations in house dust were found for gas heating, outdoor PAH concentrations, and residence age. Yet, the optimal regression model only explained 15% of the variation in PAH levels in house dust. As self-reported data and outdoor PAH sources were only marginally predictive of observed PAH levels, we recommend that PAH concentrations be measured directly in dust samples for use in epidemiological studies.
Keywords: cancer, child exposure/health, empirical/statistical models, environmental monitoring, polycyclic aromatic hydrocarbons
Introduction
Polycyclic aromatic hydrocarbons (PAHs) are molecules with two or more fused aromatic rings that are formed as products of incomplete combustion. Children are exposed to PAHs from a variety of indoor sources including cigarette smoke, wood-burning fireplaces, gas appliances, and grilled or charred foods, as well as to outdoor sources of PAHs, including vehicle exhaust (Agency for Toxic Substances and Disease Registry, 1995). Occupational exposures to PAHs have been associated with increased risks of lung, skin, and bladder cancers (Boffetta et al., 1997). Likewise, increased levels of PAH–DNA adducts have been associated with lung cancer in the general population (Perera et al., 2002). Moreover, in utero PAH exposures, as measured by maternal personal air monitoring during pregnancy, have been associated with IQ deficits (Perera et al., 2009), cognitive developmental delays (Perera et al., 2006), decreased gestational size (Choi et al., 2008), and respiratory effects (Miller et al., 2004; Jedrychowski et al., 2005).
Surrogates of PAH exposure have been measured in several environmental and biological media, including air (Tjoe Ny et al., 1993; Burstyn et al., 2000; Pleil et al., 2004), house dust (Murkerjee et al., 1997; Chuang et al., 1995, 1999; Lewis et al., 1999; Rudel et al., 2003; Wilson et al., 2003; Beyea et al., 2006; Gevao et al., 2007; Maertens et al., 2004, 2008), urine (Jacob and Seidel, 2002; Onyemauwa et al., 2009; Sobus et al., 2009), and blood (Kriek et al., 1998; Dai et al., 2004). Because PAHs can accumulate in carpets over years and decades (Roberts et al., 2009), house-dust PAH concentrations may be long-term predictors of indoor PAH exposures. Moreover, because inadvertent dust ingestion could be responsible for as much as 42% of non-dietary total PAH exposure in young children (Gevao et al., 2007), levels of PAHs in house dust may be particularly relevant to the uptake of PAHs in children.
Previous studies have reported that PAH concentrations in house dust were higher in urban compared with rural homes (Chuang et al., 1999), in smoking compared with non-smoking homes (Maertens et al., 2004), in spring compared with summer (Murkerjee et al., 1997), and in homes with decreased cleaning frequency (Maertens et al., 2008). Curiously, in the largest study to date, an inverse relationship was observed between estimated outdoor PAH levels and PAH concentrations or loadings measured in house dust (Beyea et al., 2006).
Although measurements of chemicals in house dust are specific measures of indoor exposures, such data have rarely been collected in epidemiological investigations. Rather, epidemiologists have classified potential exposures to chemicals on the basis of self-reported information and/or ambient levels of chemicals measured at outdoor monitoring sites. As self-reports and estimated outdoor air levels may not be good surrogates for indoor exposures, it is important to know the extent to which these indirect measures predict household levels of environmental agents. In this study, we evaluate the predictive value of self-reported and geographic data in estimating measured levels of nine PAHs in house dust.
Methods
Study Population
The Northern California Childhood Leukemia Study (NCCLS) is a large case–control study of childhood leukemia conducted in 35 counties in the San Francisco Bay area and California Central Valley, where cases aged 0–14 years are ascertained from nine pediatric clinical centers. Controls, matched to cases on the basis of date of birth, sex, race, and Hispanic ethnicity, are selected from the California birth registry (Chang et al., 2006). Cases and controls aged 0–7 years, who were living in the same home they occupied at the time of diagnosis (and a similar reference date for controls) from December 1999 to November 2007, were eligible for household dust collection. Among 324 cases and 407 controls determined to be eligible, 296 cases (91%) and 333 controls (82%) participated, and among the participants, 277 cases (94%) and 306 controls (92%) had analyzable dust. We obtained a written informed consent from the children’s parent or legal guardian in accordance with the institutional review boards’ requirements at the University of California, Berkeley and all other participating institutions.
House-Dust Collection
House-dust samples were collected using a high-volume surface (HVS3) sampler or household vacuum cleaners, as previously described; (Colt et al., 2008) data from both methods were used in our analyses. Briefly, for HVS3 samples, parents were asked to identify the room (other than the kitchen or the child’s bedroom) in which the child spent the most time while awake. For most subjects, this was the living room or family room. The interviewer marked a 4-ft by 6-ft area using tape and vacuumed the surface in 3-inch strips, making four passes back and forth on each strip, until 10 ml of fine dust had been collected. In HVS3-sampled homes, the area of the carpet sampled was a variable that could be included in statistical analyses. The HVS3 sampling train was cleaned with isopropyl alcohol and dried between uses at each home. Initially, HVS3-sampled dust was collected (N = 415, 71%), but household vacuum cleaner dust was substituted starting in 2006 (N = 168, 29%).
Laboratory Analysis of PAHs
The nine PAHs analyzed were benzo(a)anthracene, chrysene, benzo(a)pyrene, benzo(b)fluoranthene, benzo(k)fluoranthene, indeno(1,2,3-c,d)pyrene, dibenzo(a,h)anthracene, coronene, and dibenzo(a,e)pyrene. For the PAH analyses, 0.5-g portions of dust were spiked with 250 ng of each of two surrogate recovery standards 13C6-benzo(k)fluoranthene and 13C6-dibenzo(a,e)pyrene. Dust samples were then extracted by ultrasonication in the ratio of 1:1 hexane/acetone, solvent exchanged into hexane, purified by solid-phase extraction (using sequential elution of hexane, 15% diethyl ether in hexane, and dichloromethane on 1 g silica cartridges), concentrated to 1 ml, spiked with the internal standard d12-benzo(e)pyrene, and analyzed using gas chromatography-mass spectrometry (GC-MS) in the multiple ion detection mode. The GC separation used an RTx-5MS column (30 m, 0.25-mm i.d., 0.25-μm film) that was programmed from 130°C to 220°C at 2°C per min, and then from 220°C to 300°C at 10°C per min. A nine-point calibration curve (range 2–750 ng/ml) and a zero-level standard were analyzed with each sample set (12 field samples, a duplicate, a duplicate spike (250 ng), and a solvent method blank). The internal standard method of quantification was used with linear least-squares determination of the calibration curve. We used 13C6-benzo(k)fluoranthene and 13C6-dibenzo(a,e)-pyrene as surrogate recovery standards to correct for variable PAH recovery on a sample-by-sample basis. The average recoveries for the two surrogate recovery standards in the dust samples were 83±23% and 99±78% for 13C6-benzo(k)fluoranthene (N = 583) and 13C6-dibenzo(a,e)pyrene (N = 579), respectively. The average relative difference between analytes in duplicate samples was 27%.
Self-Reported Exposure Surrogates
Parents, primarily the biological mother (97%), responded to questions in a structured in-home personal interview designed to ascertain information about exposures and demographic factors pertinent to childhood leukemia. From these extensive questionnaire responses, we selected a focused subset of questions that were potentially indicative of the concentrations of PAHs measured in the house dust for our analysis. Specifically, we selected questions related to sources of indoor PAHs, including household heating appliances, household cooking practices, household cigarette smoking before and after birth, and presence of an attached garage. Furthermore, we considered the effects of household characteristics (i.e., residence age and type), parental demographics (i.e., parental age, education, income, and ethnicity), sampling conditions (i.e., season, duration at residence, vacuuming frequency, sampling method, carpet age, and sampling area), and child-specific variables (i.e., child’s case–control status, sex, and age) on PAH concentrations in house dust.
GIS-Derived Exposure Surrogates
We used a global positioning system device to determine the latitude and longitude coordinates for each household. Subsequently, we evaluated three surrogates for outdoor PAH concentrations: traffic density, modeled predictions of outdoor PAH concentrations, and urban or rural location. Traffic density was estimated as described previously (Gunier et al., 2006). Briefly, a 500-m radius was drawn around each residence and traffic density was defined as the sum of the annual average daily traffic count from the year 2000, multiplied by the length of the road for all roads within the buffer, divided by the buffer’s area (United States Department of Transportation, Office of Highway Policy Information, 2003). The estimates of outdoor PAH concentrations were taken from the EPA’s 2002 National-Scale Air Toxics Assessment (US Environmental Protection Agency, 2009). The outdoor PAH concentrations were estimated at a census tract resolution using an air dispersion model and National Emissions Inventory data, which includes major stationary sources (i.e., power plants), area sources (i.e., commercial and residential emissions), and mobile sources (i.e., automobiles and trucks). The estimated outdoor PAH concentration represented seven of the nine individual PAHs measured in the house dust. As both outdoor PAH estimates and traffic density were approximately log-normally distributed, their logged values were used for statistical analyses. The urban indicator variable was coded as either 1, for residences in census blocks classified as “urban” (population density of at least 1000 people per square mile), or 0, for those classified as “rural” or “other” by the 2000 US Census (US Census Bureau).
Statistical Analysis
As previously described (Whitehead et al., 2009), we used principal components analysis to summarize 15 highly correlated household cigarette smoking variables with three meaningful principal components (i.e., parental, father-only, and other household smoking components). Likewise, five highly correlated parental demographic variables were summarized with two principal components (i.e., parental age and socioeconomic status). Residence age, a categorical variable, was treated as a continuous variable by subtracting the mid-point year from the construction date range reported from the median year of dust collection (i.e., if respondent reported a residence constructed between 1950 and 1959, residence age = 2004–1955=49 years or 4.9 decades).
Pairwise correlation coefficients between the natural log-transformed house-dust PAH concentrations and covariates of interest were estimated. Although Pearson correlation coefficients (of logged PAH levels) are reported, results were similar when using Spearman rank coefficients.
Multiple Imputation of Missing Data
We used a multiple imputation procedure to borrow information from available measurements to impute values for missing data. In simulation studies, multiple imputation has been shown to produce unbiased effect estimates and appropriate confidence intervals (Hopke et al., 2001; Lubin et al., 2004; Uh et al., 2008). We had three types of missing data: missing house-dust PAH values, house-dust PAH values below the limit of detection, and missing covariate data. Overall, 70 (1.3% of N=5247) house-dust PAH measurements were missing for 56 subjects. These PAH measurements were missing as a result of interference from co-eluting compounds during GC-MS analysis, which made detection of some individual PAHs impossible. In addition, there were 63 (1.2% of N=5247) house-dust PAH measurements below the limit of=detection in 44 participant households. Finally, 246 (42%) of the subjects had at least one missing covariate, because respondents were either unable or unwilling to complete all of the survey questions (i.e., respondent answered “don’t know”).
Because the nine individual PAHs were correlated in our data, the multiple imputation strategy was particularly useful. Specifically, using Proc MI (SAS v.9.1, Cary, NC, USA), we estimated the joint multivariate normal distribution for the nine correlated PAHs. Then, for each missing value, a probability distribution was created conditional upon the values for the non-missing PAHs (generally the eight other PAHs). Next, five possible imputations for the missing value were randomly drawn from the conditional probability distribution, which was bounded such that each of the randomly drawn values was greater than the limit of detection. The random sampling addressed uncertainty owing to missing values and resulted in more valid statistical inferences than single imputation. In addition, the relative magnitude of missing PAH estimates reflected the profile of the corresponding non-missing PAHs for the same subjects.
We used a similar procedure to estimate five possible values for each PAH measurement below the limit of detection and each missing covariate of interest. Covariate imputation was based on the distribution of non-missing covariates only. Again, logical bounds were set on the randomly selected values so that the estimates were reasonable (i.e., gas heating must be assigned as 0 or 1 and all estimates for measurements below the limit of detection must be less than the detection limit). Ultimately, five complete data sets were created with five imputed values for each of the three types of missing data. Regression analyses were performed separately on each data set (as described below) and the results were combined to produce inferential results.
Model Selection
The goal of the regression analysis was to build a model that would be useful in predicting house-dust PAH levels, given the questionnaire- and GIS-based variables. Hence, we used the deletion–substitution–addition (DSA) algorithm, a tool for model selection written in R programme (van der Laan and Dudoit, 2003; Sinisi and van der Laan, 2004; van der Laan et al., 2004), to choose an optimal model from our list of candidate variables. We included all households and included imputed values (average of five imputations) in the DSA procedure. For each model considered, the DSA algorithm performed a 10-fold cross-validation procedure with 10 repeated rounds. Each round of cross-validation involved randomly partitioning the data into 10 complementary subsets, fitting a regression model based on 9/10 of the data, and validating the model by comparing predicted and measured values in the remaining data (the validation set). This process was repeated 10 times in each round so that each partition was used as the validation set once. Finally, to reduce variability, 10 rounds of cross-validation were performed using different partitions, and the regression coefficients were averaged over the rounds. The “best” model was the one that minimized the mean error between the predicted and observed values in 100 validation sets. The parameters in this “best” model should be the most useful in predicting house-dust PAH concentrations in other house-holds from our population. The search for the “best” model began with the intercept-only model and proceeded iteratively by comparing the best model at each step with (1) a deletion step, which removed a term from the model, (2) a substitution step, which replaced one term with another, and (3) an addition step, which added a term to the model. Initially, we restricted the DSA algorithm; hence, it produced a model with only linear effects and no interaction terms. However, after we narrowed the model selection to the most informative variables, we repeated the DSA procedure and added second-order non-linear terms and two-way interactions that improved the model fit.
Regression Analysis
Because the PAH data had approximate log-normal distributions, the natural log of the total house-dust PAH concentration was used for all analyses. After selecting the optimal model using the DSA algorithm, three regression analyses were performed with case and control households combined. The primary analysis used data from all possible households regardless of the sampling method (both HVS3 and vacuum cleaner dust samples) or missing data (both observed and imputed values). The second analysis used only HVS3-sampled households and used the imputed data; this analysis included the size of sampling area variable. The third analysis included households with both HVS3 and vacuum cleaner dust, but excluded subjects with any missing data. The first two regressions analyzed the five imputed data sets separately and combined the results to infer appropriate confidence intervals (SAS v.9.1, PROC MI Analyze). For the third analysis, we used a standard least-squares linear regression (SAS v.9.1, PROC Reg).
Results
PAHs in House Dust
Our analyses included 277 cases and 306 controls with PAH house-dust measurements. As shown in Table 1, individual PAH detection rates ranged from 94% to 100% and individual PAH concentrations ranged from below detection (limit of 2 or 4 ng/g) to a maximum of 2450 ng/g. The sum of the nine house-dust PAH concentrations (hereafter referred to as total house-dust PAH concentrations) for the 583 households ranged from 54 to 11170 ng/g, with a median value of 479 ng/g. Table 2 shows the Pearson correlation coefficients between individual log-transformed house-dust PAH concentrations. In general, levels of the nine PAHs were moderately to highly correlated.
Table 1.
Summary of house-dust PAH measurements for nine PAHs.
| Individual PAH | Molecular weight |
Missing | Below detection |
Percent detected |
Non-missing and above detection |
Concentration (ng PAH per g dust) |
||
|---|---|---|---|---|---|---|---|---|
| Min. | Median | Max. | ||||||
| Benzo(a)anthracenea,b,c | 228 | 1 | 5 | 99.1% | 577 | <2 | 25 | 834 |
| Chrysenea,b,c | 228 | 1 | 0 | 100.0% | 582 | 7 | 73 | 1547 |
| Benzo(a)pyrenea,b,c | 252 | 16 | 9 | 98.4% | 558 | <2 | 40 | 1948 |
| Benzo(b)fluoranthenea,b,c | 252 | 5 | 1 | 99.8% | 577 | <2 | 59 | 2450 |
| Benzo(k)fluoranthenea,b,c | 252 | 11 | 0 | 100.0% | 572 | 3 | 40 | 814 |
| Indeno(1,2,3-c,d)pyrenea,b,c | 276 | 0 | 1 | 99.8% | 582 | <2 | 53 | 2371 |
| Dibenzo(a,h)anthracenea,b,c | 278 | 6 | 35 | 93.9% | 542 | <2 | 14 | 393 |
| Coronened | 300 | 25 | 8 | 98.6% | 550 | <4 | 94 | 636 |
| Dibenzo(a,e)pyrened | 302 | 5 | 4 | 99.3% | 574 | <4 | 27 | 713 |
PAH, polycyclic aromatic hydrocarbons.
Detection limit 2 ng per g dust.
Classified as probable human carcinogen by US Environmental Protection Agency.
Used in EPA’s 2002 National-Scale Air Toxics Assessment outdoor PAH model.
Detection limit 4 ng per g dust.
Table 2.
Pearson correlation coefficients between nine logged house-dust polycyclic aromatic hydrocarbons concentrations.
| ln(B(a)A) | ln(Chry) | ln(B(a)P) | ln(B(k)F) | ln(B(b)F) | ln(I(c,d)P) | ln(D(a,h)A) | ln(Cor) | ln(D(a,e)P) | |
|---|---|---|---|---|---|---|---|---|---|
| N, non-missing and above detection | 577 | 582 | 558 | 572 | 577 | 582 | 542 | 554 | 570 |
| ln(Benzo(a)anthracene) | 1 | 0.91 | 0.70 | 0.65 | 0.81 | 0.82 | 0.60 | 0.46 | 0.49 |
| ln(Chrysene) | 1 | 0.61 | 0.64 | 0.82 | 0.76 | 0.57 | 0.46 | 0.39 | |
| ln(Benzo(a)pyrene) | 1 | 0.57 | 0.61 | 0.70 | 0.63 | 0.37 | 0.51 | ||
| ln(Benzo(k)fluoranthene) | 1 | 0.55 | 0.57 | 0.48 | 0.36 | 0.27 | |||
| ln(Benzo(b)fluoranthene) | 1 | 0.79 | 0.58 | 0.46 | 0.42 | ||||
| ln(Indeno(1,2,3-c,d)pyrene) | 1 | 0.66 | 0.58 | 0.69 | |||||
| ln(Dibenzo(a,h)anthracene) | 1 | 0.35 | 0.41 | ||||||
| ln(Coronene) | 1 | 0.58 | |||||||
| ln(Dibenzo(a,e)pyrene) | 1 |
ln(B(a)A), ln(Benzo(a)anthracene); ln(Chry), ln(Chrysene); ln(B(a)P), ln(Benzo(a)pyrene); ln(B(k)F), ln(Benzo(k)fluoranthene); ln(B(b)F), ln(Benzo(b)-fluoranthene); ln(I(c,d)P), ln(Indeno(1,2,3-c,d)pyrene); ln(D(a,h)A), ln(Dibenzo(a,h)anthracene); ln(Cor), ln(Coronene); ln(D(a,e)P), ln(Dibenzo(a,e)pyrene).
Table 3 shows the Pearson correlation coefficients between total log-transformed house-dust PAH concentrations and covariates of interest for the multiple imputation analysis (N=583×5 data sets) and for the participants with complete covariate and PAH data. In general, the correlation coefficients were similar regardless of how the missing data were treated. In the bivariate analysis, residence age, traffic density, and outdoor PAH concentrations were the covariates most strongly correlated with total house-dust PAH concentrations. Table 3 also shows the number of subjects with missing values for the variables of interest. Table 4 shows the sum of the nine PAH concentrations by covariates of interest.
Table 3.
Pearson correlation coefficients between the total logged house-dust PAH concentrations and covariates of interest.
| Variable | rp, After multiple imputation | Number imputed | rp, Complete data | N with complete data |
|---|---|---|---|---|
| Residence age (years) | 0.26 | 70 | 0.28 | 431 |
| ln(Traffic density, veh-mi/mi2/day)a | 0.21 | 156 | 0.23 | 352 |
| ln(Outdoor PAH estimate, ng/m3) | 0.20 | 82 | 0.20 | 411 |
| Duration at residence before enrollment (years) | 0.11 | 55 | 0.12 | 437 |
| Size of sampling area (m2) | 0.09 | 0 | 0.09 | 334 |
| Mother’s educationb | 0.08 | 0 | 0.09 | 489 |
| Vacuum frequencyb | −0.07 | 13 | −0.06 | 480 |
| Child’s age at enrollment (years) | 0.07 | 0 | 0.09 | 489 |
| Household annual incomeb | 0.04 | 19 | −0.04 | 489 |
| Mother’s age (years) | 0.02 | 0 | −0.04 | 489 |
| Household cigarette consumption (cig/day) | −0.02 | 1 | 0.03 | 488 |
PAH, polycyclic aromatic hydrocarbons.
Traffic density was defined as the annual average daily traffic count within a 500-m radius of each residence, multiplied by the length of the road for all roads within the buffer, divided by the buffer’s area.
Categorical variable.
Table 4.
Total house-dust PAH concentrations for 583 households by covariates of interest.
| Variable | Category | N | Percentage | Concentration (ng PAH/g dust) |
||
|---|---|---|---|---|---|---|
| Median | 25th Percentile | 75th Percentile | ||||
| Residence age | 1990–present | 162 | 28 | 362 | 254 | 510 |
| 1985–1989 | 38 | 7 | 383 | 284 | 537 | |
| 1980–1984 | 29 | 5 | 469 | 350 | 622 | |
| 1970–1979 | 76 | 13 | 592 | 390 | 972 | |
| 1960–1969 | 60 | 10 | 566 | 371 | 935 | |
| 1950–1959 | 69 | 12 | 601 | 417 | 963 | |
| 1940–1949 | 45 | 8 | 620 | 395 | 900 | |
| 1939–earlier | 34 | 6 | 570 | 439 | 924 | |
| Unknown | 70 | 12 | 522 | 347 | 944 | |
| Gas heating | Present | 407 | 70 | 521 | 339 | 839 |
| Absent | 171 | 29 | 402 | 286 | 639 | |
| Unknown or missing | 5 | 1 | 374 | 347 | 479 | |
| Residence type | Single family home | 488 | 84 | 472 | 308 | 753 |
| Duplex or townhouse | 36 | 6 | 584 | 386 | 1049 | |
| Apartment or condominium | 47 | 8 | 538 | 371 | 903 | |
| Mobile home | 11 | 2 | 419 | 320 | 1126 | |
| Unknown | 1 | 0 | 374 | 374 | 374 | |
| Mother’s ethnicity | Hispanic | 172 | 30 | 430 | 305 | 686 |
| Not Hispanic | 411 | 70 | 501 | 331 | 793 | |
| Household smoking | None | 553 | 95 | 475 | 318 | 770 |
| ≥1 cigarette/day | 29 | 5 | 586 | 412 | 839 | |
| Unknown | 1 | 0 | 304 | 304 | 304 | |
PAH, polycyclic aromatic hydrocarbon.
Multivariable Regression Models
On the basis of the DSA algorithm that used all homes and included imputed values, we selected six main effects in our model of logged total house-dust PAH concentrations and subsequently added two non-linear terms. Table 5 shows the parameter estimates and 95% confidence intervals for the optimal logged house-dust PAH concentration model, given the uncertainty introduced by the multiple imputation analysis (Table 5, Model 1). Restricting the analysis to only HVS3-sampled homes (and including the variable size of sampling area) yielded a model with similar parameter estimates, but with slightly larger confidence intervals (Table 5, Model 2). The variable size of the sampling area was marginally significant in the model with only HVS3-sampled homes. Similarly, restricting the analysis to only subjects with complete data yielded a model with parameter estimates similar to those in Model 1, but with slightly larger confidence intervals (Table 5, Model 3).
Table 5.
Results of multivariable regression analyses of total house-dust PAH concentrations using the optimal variable set selected with deletion-substitution-addition algorithm.
| Parameter | Model 1; All homes, imputed values (N=583) |
Model 2; HVS3-sampled homes, imputed values (N=417) |
Model 3; All homes, no imputed values (N=307) |
|||||||||
|---|---|---|---|---|---|---|---|---|---|---|---|---|
| Estimate | SE | 95% CI | Partial R2 | Estimate | SE | 95% CI | Partial R2 | Estimate | SE | 95% CI | Partial R2 | |
| Intercept | 5.43 | 0.11 | (5.22, 5.64) | – | 5.16 | 0.16 | (4.85, 5.47) | – | 5.51 | 0.14 | (5.24, 5.78) | – |
| Residence age, decade | 0.21 | 0.05 | (0.11, 0.30) | 0.07 | 0.26 | 0.06 | (0.14, 0.38) | 0.07 | 0.24 | 0.06 | (0.13, 0.35) | 0.09 |
| ln(Outdoor PAH estimate, ng/m3) | 0.22 | 0.07 | (0.08, 0.36) | 0.02 | 0.28 | 0.07 | (0.14, 0.41) | 0.02 | 0.16 | 0.07 | (0.02, 0.30) | 0.01 |
| Gas heating | 0.16 | 0.06 | (0.04, 0.29) | 0.02 | 0.18 | 0.07 | (0.04, 0.33) | 0.02 | 0.20 | 0.08 | (0.04, 0.36) | 0.04 |
| Residence is apartment/townhouse | 0.18 | 0.08 | (0.02, 0.33) | 0.01 | 0.12 | 0.09 | (−0.07, 0.30) | 0.01 | −0.13 | 0.11 | (−0.35, 0.08) | 0.002 |
| Child’s age at enrollment, years | 0.04 | 0.02 | (0.01, 0.07) | 0.01 | 0.04 | 0.02 | (0.00, 0.08) | 0.01 | 0.03 | 0.02 | (−0.01, 0.07) | 0.01 |
| Mother’s ethnicity is Hispanic | −0.12 | 0.06 | (−0.24, 0.01) | 0.002 | −0.10 | 0.08 | (−0.24, 0.05) | 0.001 | −0.09 | 0.08 | (−0.25, 0.07) | 0.003 |
| (Residence age)2 | −0.02 | 0.01 | (−0.03, −0.01) | 0.02 | −0.02 | 0.01 | (−0.04, −0.01) | 0.03 | −0.02 | 0.01 | (−0.04, −0.01) | 0.03 |
| (ln(Outdoor PAH estimate, ng/m3))2 | −0.05 | 0.02 | (−0.09, −0.01) | 0.01 | 0.06 | 0.03 | (0.00, 0.12) | 0.02 | −0.03 | 0.02 | (−0.07, 0.01) | 0.005 |
| Size of sampling area, m2 | – | – | – | – | −0.06 | 0.02 | (−0.10, −0.02) | 0.01 | – | – | – | – |
PAH, polycyclic aromatic hydrocarbon.
The overall fit of Model 1 was R2=0.15. During cross-validation of Model 1, the average difference between the predicted total house-dust PAH concentration and the measured total house-dust PAH concentration was 0.67 (in log scale). For comparison, the average difference between any measured total house-dust PAH concentration and the average total house-dust concentration was 0.72. Figure 1 compares the measured and predicted total house-dust PAH concentrations (in log scale). Table 6 shows predicted total house-dust PAH concentrations for various combinations of the six variables using parameter estimates from Model 1. Table 6, shows the added effect of each term in the model on total house-dust PAH concentration. For example, while holding all other variables constant, the added effect of indoor gas heating increased the predicted total house-dust PAH concentration from 510 to 600 ng/g.
Figure 1.
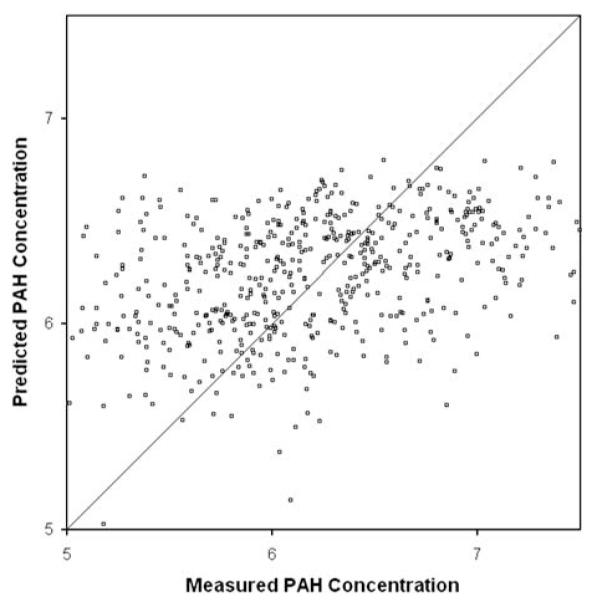
Plot of measured vs predicted total house-dust polycyclic aromatic hydrocarbon (PAH) concentrations.
Table 6.
Predicted total house-dust PAH concentrations, using parameter estimates from Model 1.
| Median values |
New house |
Old house |
Young child |
Old child |
No gas heating |
Low outdoor PAH |
High outdoor PAH |
Hispanic mother |
Residence apartment |
Worst-case scenario |
Best-case scenario |
|
|---|---|---|---|---|---|---|---|---|---|---|---|---|
| Residence age (years) | 30a | 10b | 50c | 30a | 30a | 30a | 30a | 30a | 30a | 30a | 56 | 0 |
| Child’s age at aenrollment (years) | 3.5a | 3.5a | 3.5a | 2.3b | 5.0c | 3.5a | 3.5a | 3.5a | 3.5a | 3.5a | 8.0 | 0 |
| Gas heating | Yes | Yes | Yes | Yes | Yes | No | Yes | Yes | Yes | Yes | Yes | No |
| Outdoor PAH estimate (ng/m3) | 3.0a | 3.0a | 3.0a | 3.0a | 3.0a | 3.0a | 1.6b | 5.4c | 3.0a | 3.0a | 10.8 | 0.2 |
| Mother’s ethnicity is Hispanic | No | No | No | No | No | No | No | No | Yes | No | No | Yes |
| Residence is apartment/townhouse | No | No | No | No | No | No | No | No | No | Yes | Yes | No |
| Predicted total house-dust PAH concentration (ng/g) |
600 | 460 | 670 | 560 | 640 | 510 | 540 | 630 | 530 | 710 | 1060 | 120 |
PAH, polycyclic aromatic hydrocarbons.
Median value.
25th percentile value.
75th percentile value.
Discussion
The house-dust PAH concentrations measured in our study were generally lower than those previously reported for households in Durham, NC, USA (Chuang et al., 1995; Lewis et al., 1999; Wilson et al., 2003), in the Rio Grande Valley, TX, USA (Murkerjee et al., 1997), in Cape Cod, MA, USA (Rudel et al., 2003), in Long Island, NY, USA (Beyea et al., 2006), and in Ottawa, Canada (Maertens et al., 2008). However, a recent study of homes in Kuwait found house-dust PAH concentrations similar to those that we measured (Gevao et al., 2007). The wide range of reported house-dust PAH concentrations probably reflects true geographical variability.
Two suspected sources of indoor PAHs, that is, indoor gas heating and estimated outdoor PAH levels, were significant predictors of total house-dust PAH concentration in the models. Interestingly, the age of the residence had the most significant effect on total house-dust PAH concentrations, with older houses having higher PAH concentrations. The presence of the non-linear term, (residence age)2, in Model 1 shows that in houses built before 1970, the effect of the age of the house was sublinear. The age of residence had a similar effect in our previous analysis of house-dust nicotine concentrations (Whitehead et al., 2009). Previous researchers have shown that only about 5% of the total dust loading present in a 10-year-old carpet will be available as surface dust, whereas the larger portion resides deep within the carpet and will not be removed by typical cleaning (Roberts et al., 1999, 2005). Taken together, these findings suggest that environmental contaminants can accumulate in household carpets over years or decades (Roberts et al., 2009).
The child’s age at enrollment was also a significant predictor of PAH concentrations in house dust. Older children seemed to have higher concentrations of PAHs in their house dust. In bivariate analyses, a child’s age at enrollment was positively correlated with the amount of time his or her family had lived in the current residence (rp=0.61) and with the age of the carpet sampled (rp=0.13). Although duration at residence and carpet age were not significant predictors of PAH levels, child’s age may be a more reliably reported surrogate for the age of the dust collected. If so, the positive regression coefficient for the child’s age variable is taken as further evidence that PAHs accumulate in house-hold dust over time.
Residence in an apartment/condominium, duplex/town-house, or mobile home compared with a single family home, was also a significant predictor of the house-dust PAH concentration, with higher concentrations seen for multiple family dwellings. In Model 1, if the residence was not a single family home, the predicted total PAH concentration increased (Table 6). Because apartments, mobile homes, and townhouses are typically smaller than single family homes, this result is consistent with a previous finding that concentrations of environmental contaminants in house dust increased with decreasing square footage of the residence (Hein et al., 1991). Presumably, given a constant number of PAH sources (i.e., heaters, stoves, smokers), a smaller residence would have a greater PAH concentration.
The mother’s ethnicity was also a significant predictor of PAH concentrations in house dust. Hispanic mothers seemed to have lower house-dust PAH concentrations than non-Hispanic mothers. Notably, Hispanic mothers were also more likely to report that their carpets were vacuumed more than once a week (76 vs 36% for Hispanic vs non-Hispanic) and were less likely to live in an urban census tract (66 vs 78% for Hispanic vs non-Hispanic). Although these other factors were not selected as variables in our optimal house-dust PAH model, in bivariate analyses, vacuum frequency was negatively correlated with PAH concentrations and urban location was positively correlated with PAH concentrations.
Although we were able to identify several significant determinants of total house-dust PAH concentrations, even our best model only explained a small portion of the total variability of the data (R2=0.15). Moreover, during cross-validation, our best model was only marginally better at predicting house-dust PAH concentrations than the intercept model (average residuals of 0.67 and 0.72, respectively). Ultimately, it seems that even the most relevant self-reported and GIS-based data provided only limited information about household PAH levels; this underscores the importance of making environmental or biological measurements.
As discussed above, dust samples were collected using both the HVS3 and household vacuum cleaners. Restricting the regression analysis to only those homes with dust collected by the HVS3 did little to change the estimates of the parameters used in Model 1 (Table 5). This reinforces previous findings from our study (Colt et al., 2008; Whitehead et al., 2009) and suggests that collecting house dust from household vacuum cleaners is a useful alternative to the more expensive and labor-intensive HVS3 sampling method.
An implicit assumption of our multiple imputation procedure is that the distribution of the missing data depends only on the observed data. This assumption is plausible, given the large size and correlation of the set of predictors used for imputation (Collins et al., 2001). Moreover, restricting the regression to participants with complete data had little impact on the estimates of the parameters used in Model 1 (Table 5). Indeed, whereas the parameter estimates were similar, the standard errors and confidence intervals were smaller for Model 1 than for Model 3. Thus, it seems that the multiple imputation of missing data was useful. The one variable that was substantially different in Model 3 was the variable identifying the residence as an apartment. However, because this variable had only one missing observation, the discrepancy probably points to data censoring in Model 3 rather than to failure of the imputation process.
Interestingly, several factors that have been related to house-dust PAH levels in previous studies, that is, smoking (Maertens et al., 2004), vacuum use frequency (Maertens et al., 2008), season (Murkerjee et al., 1997), and urban location (Chuang et al., 1999), were not important determinants in our analysis. However, some variables that were omitted from our optimal model (Model 1) were correlated with house-dust PAH concentrations in bivariate analyses. Specifically, the variables, urban location (rp=0.11), traffic density (rp=0.21), and vacuum use frequency (rp=−0.07), were correlated with PAH levels. Moreover, PAH levels were higher in residences in which some household smoking was reported compared with residences with no household smoking (Pt-Test=0.18). Still, these variables were not important predictors of PAH concentrations when more informative variables were included in the model (i.e., mother’s ethnicity and outdoor PAH estimate). Conversely, variables describing cooking habits, fireplace use, and season did not seem to be correlated with house-dust PAH concentrations in bivariate or multivariable regression analyses (data not shown). Unfortunately, our variables describing cooking habits were crude (i.e., number of meat servings per week) and we did not have information for most of our population (N=129). Notably, the case–control status was not an important= determinant of PAH concentrations when more informative variables were included in the model. We also discount the potential importance of reporting bias in our models, because case and control parents would not be expected to differentially report the important predictor variables, namely, address, child’s age, and residence construction date. Indeed, a recent unpublished study from the NCCLS showed no difference in the reliability of self-reported household pesticide use between cases and controls.
Our analyses of total PAH concentrations assume that the nine individual PAHs would have similar characteristics. To examine differences across PAHs, we used the variable set selected for the total PAH model and created a model for each individual PAH. The regression coefficients for each of the nine individual PAH models were fairly consistent, with each individual regression coefficient falling within the 99% confidence interval of the regression coefficient from the total PAH model (data not shown). The consistency of the regression results across individual PAH models and the correlation between individual PAHs, suggests that the nine PAHs measured have similar determinants.
Although the total concentration of house-dust PAH is a useful indicator of PAH contamination in the home, it has limitations as a measure of children’s exposures to PAHs, which reflect not only ingestion of contaminated dust but also inhalation of contaminated air and ingestion of contaminated food. Thus, measuring the concentration of PAHs in house dust allows us to directly estimate only one route of exposure, namely, ingestion of PAHs in house dust. This route may be important to the overall dose of PAHs received by a child, given a recent estimate that dust ingestion contributed as much as 42% of non-dietary total PAH exposure in children (Gevao et al., 2007). In addition, children may receive nearly 2.5 times the dose of carcinogenic PAH through ingested dust vs inhalation (Chuang et al., 1999).
Our study was limited to collection of only one dust sample from each home, and in most cases, from only one room (HVS3 samples). This sampling strategy prevented us from analyzing the temporal (i.e., day-to-day) and spatial (i.e., room-to-room) variability of house-dust PAH concentrations in a given household and made it impossible to investigate measurement errors associated with temporal variability. Future studies should collect repeated samples of house dust to evaluate within-home and between-home sources of variability in house-dust PAH concentrations.
In summary, this study identified several determinants of house-dust PAH concentrations and confirmed that gas heating and elevated outdoor PAH concentrations were significant predictors of indoor PAH levels. Moreover, our results suggest that house-dust PAHs could be used as long-term surrogates for residential exposures to PAHs. Nonetheless, despite the large number of dust measurements and the extensive questionnaire- and GIS-based data in our study, we were only able to explain a small portion of the overall variability in PAH levels in house dust (R2=0.15). This underscores the importance of directly measuring PAH levels in epidemiological studies.
Acknowledgements
This work was supported by the National Institute of Environmental Health Sciences (Grant numbers R01ES009137 and P42ES0470518); the Intramural Research Program of the National Cancer Institute, National Institute of Health (subcontracts 7590-S-04 and 7590-S-01); the National Cancer Institute (contract N02-CP-11015) and the Berkeley Fellowship for Graduate Study. We thank the families for their participation. We also thank the clinical investigators at the following collaborating hospitals for help in recruiting patients: University of California Davis Medical Center (Dr. Jonathan Ducore), University of California San Francisco (Dr. Mignon Loh and Dr. Katherine Matthay), Children’s Hospital of Central California (Dr. Vonda Crouse), Lucile Packard Children’s Hospital (Dr. Gary Dahl), Children’s Hospital Oakland (Dr. James Feusner), Kaiser Permanente Roseville (Dr. Kent Jolly and Dr. Vincent Kiley), Kaiser Permanente Santa Clara (Dr. Alan Wong and Dr. Carolyn Russo), Kaiser Permanente San Francisco (Dr. Kenneth Leung) and Kaiser Permanente Oakland (Dr. Daniel Kronish and Dr. Stacy Month). Finally, we acknowledge the entire Northern California Childhood Leukemia Study staff and the UCB Survey Research Center for their effort and dedication.
Footnotes
Conflict of interest The authors declare no conflict of interest.
References
- Agency for Toxic Substances and Disease Registry (ATSDR) US Department of Health and Human Services, Public Health Service; Atlanta, GA: Toxicological Profile For Polycyclic Aromatic Hydrocarbons (PAHs) 1995 [PubMed]
- Boffetta P, Jourenkova N, Gustavsson P. Cancer risk from occupational and environmental exposure to polycyclic aromatic hydrocarbons. Cancer Causes Control. 1997;8(3):444–472. doi: 10.1023/a:1018465507029. [DOI] [PubMed] [Google Scholar]
- Perera FP, Mooney LA, Stampfer M, Phillips DH, Bell DA, Rundle A, et al. Associations between carcinogen-DNA damage, glutathione S-transferase genotypes, and risk of lung cancer in the prospective physicians’ health cohort study. Carcinogenesis. 2002;23(10):1641–1646. doi: 10.1093/carcin/23.10.1641. [DOI] [PubMed] [Google Scholar]
- Perera FP, Li Z, Whyatt R, Hoepner L, Wang S, Camann D, et al. Prenatal airborne polycyclic aromatic hydrocarbon exposure and child IQ at age 5 years. Pediatrics. 2009;124(2):e195–e202. doi: 10.1542/peds.2008-3506. [DOI] [PMC free article] [PubMed] [Google Scholar]
- Perera FP, Rauh V, Whyatt RM, Tsai WY, Tang D, Diaz D, et al. Effect of prenatal exposure to airborne polycyclic aromatic hydrocarbons on neurodevelopment in the first 3 years of life among inner-city children. Environ Health Perspect. 2006;114(8):1287–1292. doi: 10.1289/ehp.9084. [DOI] [PMC free article] [PubMed] [Google Scholar]
- Choi H, Rauh V, Garfinkel R, Tu Y, Perera FP. Prenatal exposure to airborne polycyclic aromatic hydrocarbons and risk of intrauterine growth restriction. Environ Health Perspect. 2008;116(5):658–665. doi: 10.1289/ehp.10958. [DOI] [PMC free article] [PubMed] [Google Scholar]
- Miller RL, Garfinkel R, Horton M, Camann D, Perera FP, Whyatt RM, et al. Polycyclic aromatic hydrocarbons, environmental tobacco smoke, and respiratory symptoms in an inner-city birth cohort. Chest. 2004;126(4):1071–1078. doi: 10.1378/chest.126.4.1071. [DOI] [PMC free article] [PubMed] [Google Scholar]
- Jedrychowski W, Galas A, Pac A, Flak E, Camman D, Rauh V, et al. Prenatal ambient air exposure to polycyclic aromatic hydrocarbons and the occurrence of respiratory symptoms over the first year of life. Eur J Epidemiol. 2005;20(9):775–782. doi: 10.1007/s10654-005-1048-1. [DOI] [PubMed] [Google Scholar]
- Tjoe Ny E, Heederik D, Kromhout H, Jongeneelen F. The relationship between polycyclic aromatic hydrocarbons in air and in urine of workers in a soderberg potroom. Am Ind Hyg Assoc J. 1993;54(6):277–284. doi: 10.1080/15298669391354685. [DOI] [PubMed] [Google Scholar]
- Burstyn I, Kromhout H, Kauppinen T, Heikkila P, Boffetta P. Statistical modelling of the determinants of historical exposure to bitumen and polycyclic aromatic hydrocarbons among paving workers. Ann Occup Hyg. 2000;44(1):43–56. [PubMed] [Google Scholar]
- Pleil JD, Vette AF, Rappaport SM. Assaying particle-bound polycyclic aromatic hydrocarbons from archived PM2.5 filters. J Chromatogr A. 2004;1033(1):9–17. doi: 10.1016/j.chroma.2003.12.074. [DOI] [PubMed] [Google Scholar]
- Chuang JC, Callahan PJ, Menton RG, Gordon SM, Lewis RG, Wilson NK. Monitoring methods for polycylic aromatic hydrocarbons and their distribution in house dust and track-in soil. Environ Sci Technol. 1995;29:494–500. doi: 10.1021/es00002a027. [DOI] [PubMed] [Google Scholar]
- Murkerjee S, Ellenson WD, Lewis RG, Stevens RK, Sommerville MC, Shadwick DS, et al. An environmental scoping study in the lower rio grande valley of texas – III. residential microenvironmental monitoring for air, house dust, and soil. Environ Int. 1997;23(5):657–673. [Google Scholar]
- Chuang JC, Callahan PJ, Lyu CW, Wilson NK. Polycyclic aromatic hydrocarbon exposures of children in low-income families. J Expo Anal Environ Epidemiol. 1999;9(2):85–98. doi: 10.1038/sj.jea.7500003. [DOI] [PubMed] [Google Scholar]
- Lewis RG, Fortune CR, Willis RD, Camann DE, Antley JT. Distribution of pesticides and polycyclic aromatic hydrocarbons in house dust as a function of particle size. Environ Health Perspect. 1999;107(9):721–726. doi: 10.1289/ehp.99107721. [DOI] [PMC free article] [PubMed] [Google Scholar]
- Rudel RA, Camann DE, Spengler JD, Korn LR, Brody JG. Phthalates, alkylphenols, pesticides, polybrominated diphenyl ethers, and other endocrine-disrupting compounds in indoor air and dust. Environ Sci Technol. 2003;37(20):4543–4553. doi: 10.1021/es0264596. [DOI] [PubMed] [Google Scholar]
- Wilson NK, Chuang JC, Lyu C, Menton R, Morgan MK. Aggregate exposures of nine preschool children to persistent organic pollutants at day care and at home. J Expo Anal Environ Epidemiol. 2003;13(3):187–202. doi: 10.1038/sj.jea.7500270. [DOI] [PubMed] [Google Scholar]
- Maertens RM, Bailey J, White PA. The mutagenic hazards of settled house dust: A review. Mutat Res. 2004;567(2–3):401–425. doi: 10.1016/j.mrrev.2004.08.004. [DOI] [PubMed] [Google Scholar]
- Beyea J, Hatch M, Stellman SD, Santella RM, Teitelbaum SL, Prokopczyk B, et al. Validation and calibration of a model used to reconstruct historical exposure to polycyclic aromatic hydrocarbons for use in epidemiologic studies. Environ Health Perspect. 2006;114(7):1053–1058. doi: 10.1289/ehp.8659. [DOI] [PMC free article] [PubMed] [Google Scholar]
- Gevao B, Al-Bahloul M, Zafar J, Al-Matrouk K, Helaleh M. Polycyclic aromatic hydrocarbons in indoor air and dust in Kuwait: Implications for sources and nondietary human exposure. Arch Environ Contam Toxicol. 2007;53(4):503–512. doi: 10.1007/s00244-006-0261-6. [DOI] [PubMed] [Google Scholar]
- Maertens RM, Yang X, Zhu J, Gagne RW, Douglas GR, White PA. Mutagenic and carcinogenic hazards of settled house dust. I: Polycyclic aromatic hydrocarbon content and excess lifetime cancer risk from preschool exposure. Environ Sci Technol. 2008;42(5):1747–1753. doi: 10.1021/es702449c. [DOI] [PubMed] [Google Scholar]
- Jacob J, Seidel A. Biomonitoring of polycyclic aromatic hydrocarbons in human urine. J Chromatogr B Analyt Technol Biomed Life Sci. 2002;778(1–2):31–47. doi: 10.1016/s0378-4347(01)00467-4. [DOI] [PubMed] [Google Scholar]
- Onyemauwa F, Rappaport SM, Sobus JR, Gajdosova D, Wu R, Waidyanatha S. Using liquid chromatography-tandem mass spectrometry to quantify monohydroxylated metabolites of polycyclic aromatic hydrocarbons in urine. J Chromatogr B Analyt Technol Biomed Life Sci. 2009;877(11–12):1117–1125. doi: 10.1016/j.jchromb.2009.02.067. [DOI] [PubMed] [Google Scholar]
- Sobus JR, Waidyanatha S, McClean MD, Herrick RF, Smith TJ, Garshick E, et al. Urinary naphthalene and phenanthrene as biomarkers of occupational exposure to polycyclic aromatic hydrocarbons. Occup Environ Med. 2009;66(2):99–104. doi: 10.1136/oem.2008.041418. [DOI] [PMC free article] [PubMed] [Google Scholar]
- Kriek E, Rojas M, Alexandrov K, Bartsch H. Polycyclic aromatic hydrocarbon-DNA adducts in humans: Relevance as biomarkers for exposure and cancer risk. Mutat Res. 1998;400(1–2):215–231. doi: 10.1016/s0027-5107(98)00065-7. [DOI] [PubMed] [Google Scholar]
- Dai YF, Leng SG, Pan ZF, Rappaport SM, Zheng YX. Preliminary study on naphthalene-metabolites-albumin adduct as an exposure biomarker for coke oven workers. Zhonghua Yu Fang Yi Xue Za Zhi. 2004;38(6):392–395. [PubMed] [Google Scholar]
- Roberts JW, Wallace LA, Camann DE, Dickey P, Gilbert SG, Lewis RG, et al. Monitoring and reducing exposure of infants to pollutants in house dust. Rev Environ Contam Toxicol. 2009;201:1–39. doi: 10.1007/978-1-4419-0032-6_1. [DOI] [PubMed] [Google Scholar]
- Chang JS, Selvin S, Metayer C, Crouse V, Golembesky A, Buffler PA. Parental smoking and the risk of childhood leukemia. Am J Epidemiol. 2006;163(12):1091–1100. doi: 10.1093/aje/kwj143. [DOI] [PubMed] [Google Scholar]
- Colt JS, Gunier RB, Metayer C, Nishioka MG, Bell EM, Reynolds P, et al. Household vacuum cleaners vs. the high-volume surface sampler for collection of carpet dust samples in epidemiologic studies of children. Environ Health. 2008;7:6. doi: 10.1186/1476-069X-7-6. [DOI] [PMC free article] [PubMed] [Google Scholar]
- Gunier RB, Reynolds P, Hurley SE, Yerabati S, Hertz A, Strickland P, et al. Estimating exposure to polycyclic aromatic hydrocarbons: A comparison of survey, biological monitoring, and geographic information system-based methods. Cancer Epidemiol Biomarkers Prev. 2006;15(7):1376–1381. doi: 10.1158/1055-9965.EPI-05-0799. [DOI] [PubMed] [Google Scholar]
- United States Department of Transportation, Office of Highway Policy Information United States Department of Transportation, Office of Highway Policy Information; Washington, DC: Highway Performance and Monitoring System for 2000. 2003
- US Environmental Protection Agency United States Environmental Protection Agency; USA: 2002 National-Scale Air Toxics Assessment. 2009
- US Census Bureau US Department of Commerce, Economics and Statistics Administration; USA: 2000 Census Of Population And Housing.
- Whitehead T, Metayer C, Ward MH, Nishioka MG, Gunier R, Colt JS, et al. Is house-dust nicotine a good surrogate for household smoking? Am J Epidemiol. 2009;169(9):1113–1123. doi: 10.1093/aje/kwp021. [DOI] [PMC free article] [PubMed] [Google Scholar]
- Hopke PK, Liu C, Rubin DB. Multiple imputation for multivariate data with missing and below-threshold measurements: Time-series concentrations of pollutants in the arctic. Biometrics. 2001;57(1):22–33. doi: 10.1111/j.0006-341x.2001.00022.x. [DOI] [PubMed] [Google Scholar]
- Lubin JH, Colt JS, Camann D, Davis S, Cerhan JR, Severson RK, et al. Epidemiologic evaluation of measurement data in the presence of detection limits. Environ Health Perspect. 2004;112(17):1691–1696. doi: 10.1289/ehp.7199. [DOI] [PMC free article] [PubMed] [Google Scholar]
- Uh HW, Hartgers FC, Yazdanbakhsh M, Houwing-Duistermaat JJ. Evaluation of regression methods when immunological measurements are constrained by detection limits. BMC Immunol. 2008;9:59. doi: 10.1186/1471-2172-9-59. [DOI] [PMC free article] [PubMed] [Google Scholar]
- van der Laan MJ, Dudoit S. Unified cross-validation methodology for selection among estimators and a general cross-validated adaptive epsilon-net estimator: Finite sample oracle inequalities and examples. 2003. Report No.: Working Paper 130.
- van der Laan MJ, Dudoit S, van der Vaart AW. The cross-validated adaptive epsilon-net estimator. 2004. Report No.: Working Paper 142.
- Sinisi SE, van der Laan MJ. Loss-based cross-validated deletion/substitution/addition algorithms in estimation. 2004. Report No.: Working Paper 143.
- Roberts JW, Clifford WS, Glass G, Hummer PG. Reducing dust, lead, dust mites, bacteria, and fungi in carpets by vacuuming. Arch Environ Contam Toxicol. 1999;36(4):477–484. doi: 10.1007/pl00022756. [DOI] [PubMed] [Google Scholar]
- Roberts JW, Glass G, Mickelson L. A pilot study of the measurement and control of deep dust, surface dust, and lead in 10 old carpets using the 3-spot test while vacuuming. Arch Environ Contam Toxicol. 2005;48(1):16–23. doi: 10.1007/s00244-003-0224-0. [DOI] [PubMed] [Google Scholar]
- Hein HO, Suadicani P, Skov P, Gyntelberg F. Indoor dust exposure: An unnoticed aspect of involuntary smoking. Arch Environ Health. 1991;46(2):98–101. doi: 10.1080/00039896.1991.9937435. [DOI] [PubMed] [Google Scholar]
- Collins LM, Schafer JL, Kam CM. A comparison of inclusive and restrictive strategies in modern missing data procedures. Psychol Methods. 2001;6(4):330–351. [PubMed] [Google Scholar]