

Abstract
Despite the yield of recent genome-wide association (GWA) studies, the identified variants explain only a small proportion of the heritability of most complex diseases. This unexplained heritability could be partly due to gene-environment (G×E) interactions or more complex pathways involving multiple genes and exposures. This article provides a tutorial on the available epidemiological designs and statistical analysis approaches for studying specific G×E interactions and choosing the most appropriate methods. I discuss the approaches that are being developed to study entire pathways and available techniques for mining interactions in GWA data. I also explore approaches to marrying hypothesis-driven pathway-based approaches with “agnostic” GWA studies.
The term ‘interaction’ has various meanings in the epidemiologic literature, depending on the context (Box 1). The focus of this article is on gene-environment (G×E) interaction, here defined as a joint effect of one or more genes with one or more environmental factors that cannot be readily explained by their separate marginal effects. By convention in epidemiology, a multiplicative model is taken as the null hypothesis; that is, the relative risk of disease in individuals with both the genetic and environmental risk factors is the product of the relative risks of each separately. Thus, any joint effect that differs from this prediction is considered a form of interaction. Other null hypotheses, such as an additive model for the excess risk, would yield different interpretations about interaction (Box 1).
Box 1. Types of Interaction.
Statistical: a departure from a pure main effects model, e.g., additive or multiplicative for disease risk, natural or logarithmic for continuous traits. Any statement about statistical interaction is scale dependent: an additive model implies interaction on a multiplicative scale and vice versa.
Quantitative: a form of statistical interaction where the effects of one factor go in the same direction at different levels of the other, but differ in magnitude. Lack of interaction on one scale necessarily implies interaction on other scales. For example, carriers of rare deleterious mutations in ATM have a more-than-multiplicative increased risk of second primary breast cancers following radiotherapy than noncarriers, although radiation risks are increased in both genotypes and carrier risks are increased in both exposure groups159.
Qualitative: forms of statistical interaction where (1) the effects go in opposite directions (e.g., exposure is deleterious in carriers and protective in noncarriers and vice versa), (2) there is an increased effect only in the presence of both the environmental factor and the susceptible genotype, (3) the effect of genotype is present at only one level of the environment, or (4) where the effect of the environment is present in only one genotype. Such interactions do not depend upon the choice of scale. For example, in utero tobacco smoke exposure seems to have an effect on asthma and wheeze only in children with the GSTM1 null genotype and vice versa160. Opposite effects of a defensin beta DEFB1 haplotype on asthma were seen between women and girls or between girls and boys, suggesting an interaction with some aspect of the “internal environment”161.
Public health synergy: a disease burden attributable to exposure to two or more risk factors that is greater than the sum of the excess risks from each alone. For example, the population burden of gastric cancer attributable to the combination of H. pylori infection and interleukin IL-1 susceptibility alleles is greater than that the sum of their separate contributions162.
Biological: an effect of one factor that depends upon the presence or absence of another163. For example, GST genes are inducible by oxidative stress caused by radicals and oxidants in air pollution and myeloperoxidase levels are increased in the respiratory extrathelial lining fluid by ozone-induced inflammation52. This concept generally applies at the cellular or molecular level, but may have implications for statistical interactions at the whole organism or population level.
Both public health and biological interactions lead to an additive risk model as the natural null hypothesis164, although in epidemiology, the multiplicative model is more commonly used. Various authors25,165-167 have offered classifications of different types of G×E interactions, including qualitative interactions (crossing, no effect of environment in those not genetically susceptible, no effect of genotype in the unexposed, etc.) and quantitative. See these papers for examples of each.
G×E interactions are worth studying for many reasons1,2 (Box 2), not least of which is the insight they could provide into biological pathways. If some of the unexplained heritability in genome-wide association (GWA) studies is due to interactions, then one goal might be to use interactions to discover novel genes that act synergistically with other factors without having demonstrable marginal effects, rather than discovery of the interaction per se3. Conversely, one might wish to discover environmental hazards that affect only a subpopulation of genetically susceptible individuals. For example, G×E interactions might allow the effects of the components of a complex mixture like air pollution to be dissected4. Understanding the failure to replicate the findings of GWA studies is another goal, as it could provide insights to disease complexity by identifying sources of real heterogeneity5,6. Finally, taking account of G×E interactions in risk prediction models can have important implications for both public health and personalized medicine7.
Box 2. Current and Potential Uses of G×E Interactions.
Understanding biological mechanisms and pathways. For example, the interaction of tobacco smoking, hair dyes, and various occupational exposures with the N-acetyl-transferase (NAT2) gene in bladder cancer suggests a role for aryl amines58. Various pathway-based analyses of significant hits from GWA studies have yielded insights into underlying mechanisms of disease, but to date, none appear to have exploited G×E interactions in a GEWIS.
Identifying novel genes acting through interactions that are manifest by their marginal effects. In GWA studies, in particular, these interactions could provide an explanation for some of the “missing heritability.” GWA scans are currently underway to search for genes conferring susceptibility to air pollution in childhood asthma, to ionizing radiation in second breast cancers, or for dietary factors in colorectal cancer, amongst others.
Understanding heterogeneity in results across studies due to differences in exposure distributions. A meta-analysis of NAT2 and GSTM1 associations in bladder cancer168 revealed some between-study heterogeneity in main effects, but found the smoking × NAT2 interaction to be robust and no GSTM1 × smoking interaction.
Identifying environmental factors that affect only a subgroup of genetically susceptible individuals. For example, maternal smoking during pregnancy seems to cause asthma only in children with the GSTM1 null genotype160.
Dissecting the effects of complex mixtures (such as air pollution) into components that are metabolized by different genes. For example, the interaction between red meat consumption and NAT2 in colorectal cancer suggests that it is the heterocyclic amines generated during cooking that is the responsible agent4.
Establishing environmental regulation aimed at setting standards to protect the most vulnerable individuals. Although the U.S. Environmental Protection Agency currently takes identifiable susceptible population subgroups (e.g., children, elderly, asthmatics) into account in setting standards, it has so far limited the use of genetic data to understanding mechanisms169; use of specific genotypes in regulation raises difficult practical and ethical concerns. However, there are some voluntary employer-sponsored screening programs for HLA-DP sensitivity to beryllium170.
Predicting individual risk of disease or prognosis and potential changes in risk in relation to modifiable environmental factors. For example, the optimal mammographic screening interval for women with a strong family history of breast cancer may differ depending on whether they carry a BRCA1 or BRCA2 mutation171. The potentially protective or deleterious effects of folate supplementation on colorectal cancer risk could depend upon genes involved in its metabolism, such as methylenetetrahydrofolate reductase (MTHFR)172.
Choosing the best treatment for an individual to maximize response or minimize side effects based on genetic predisposition. For example, a single SNP in the solute carrier organic anion transporter gene SLCO1B1 identified in a GWA study appears to dramatically affect the risk of cardiomyopathy following treatment with statins70
Traditionally, G×E interactions were investigated using candidate-gene studies. This research often begins with an established association with an environmental factor and proceeds to explore genes in pathways known to metabolize them. Over time, candidate gene studies have become more elaborate investigations of entire pathways, including all the genes, exposures, and cofactors thought to be involved in a particular mechanism. With the advent of GWA studies, a different philosophy has gained prominence, based on “agnostic” searches with no prior hypotheses. Understandably, most reports have focused on genetic main effects, but now increasingly are directed at gene-gene (G×G) interactions8. Although many GWA studies have not collected data on environmental factors, some are based on epidemiologic cohort or case-control studies that have well-characterized exposure information and could be scanned for novel G×E interactions. Such scans for G×G and G×E interactions have been viewed as agnostic. Recently, however, there has been an intriguing convergence of the two philosophies, either by using external pathway knowledge to inform the analysis of GWA data to better detect signals that do not achieve genome-wide significance9 or by mining patterns of interaction effects in GWA data to discover novel pathways10.
In the current post-GWA era the focus is on integrating findings from the vast body of data that has been generated through large consortia. A key feature of this next phase should be a renewed focus on G×E interactions, but this will require careful consideration of epidemiologic study design, exposure assessment, and methods of analysis, with particular attention to harmonization of these features across the consortium. Another key feature is the integration of GWA data with external biological knowledge from –omics databases.
I first discuss some of the challenges facing investigators studying environmental factors. Next, I provide a tutorial for the various types of study designs and analytical methods for studying G×E interactions in different contexts, ranging from specific interactions, to more extensive biological pathways, to GWA studies (“Gene-Environment-Wide Interaction Studies, GEWIS)”11. I discuss various ways that external data can be exploited in these types of analyses. Finally, I discuss some emerging directions and needs for making further progress.
Challenges to G × E studies
Whatever study design is used, the major challenges to the success of a G×E study — in addition to the usual challenges for genetic association studies that have been thoroughly discussed elsewhere — are exposure assessment, sample size, and heterogeneity.
Exposure assessment
Many environmental factors are multi-dimensional; air pollution, for example, is a complex mixture of gases and particles with differing biological effects. Most environmental agents have degrees of exposure intensity, usually varying over time. Even if an exposure is not time-dependent, the resulting disease risk is likely to be modified by temporal factors like age at or duration of exposure12. Seldom are accurate measurements of exposure over a lifetime available on all participants in a large epidemiologic study, but more detailed information may be obtainable on a stratified subsample to allow correction for measurement error13. Exposures may not even be measured on individuals, but assigned on the basis of ecologic-level exposures or a prediction model. Two-phase case-control designs that leverage readily available exposure surrogates to select individuals for more in-depth exposure assessment and/or genotyping might be used. Uncertainties in exposure assignments can be large and lead to unpredictable biases, particularly if differential with respect to disease, and can induce spurious interactions9. Although methods of correction for exposure or genotype measurement errors are well established for main effects, they have seldom been applied to interaction analyses14,15. In general, however, interactions are less likely to be biased than main effects unless the measurement errors are differentially related to both exposure and genotype.
Sample size and power
Sample size requirements for G×E studies can be enormous. A useful rule-of-thumb is that detection of an interaction requires at least four times the sample size than for detecting a main effect of comparable magnitude16. Sample sizes in the thousands of cases are typically needed for G×E analyses in candidate gene studies (Suppl. Fig. 1a) and tens of thousands in GWA studies because of the more stringent significance levels required (Suppl. Fig. 1b). In addition to study design, the key determinants of power or sample size requirements are the prevalence of exposure (or its distribution if continuous), the allele frequency, mode of inheritance, Interaction Odds Ratio ORG×E (and to a lesser extent the ORs for the main effects), significance level, and desired power. Several programs for sample size and power calculations are freely available, notably Quanto17 and POWER18. It is likely that at least some of the poor track record of replicating claims of G×E interactions is due to underpowered studies in the initial discovery or replication attempts19-21. This has led some to suggest that the search for interactions is not worthwhile, as genes involved in interactions are more likely to be detected through their marginal effects22. Nevertheless, a range of interaction effect sizes can be detected in a GWA study by either a test of interaction or a genetic effect in an environmental subgroup even when the marginal effects are not detectable (Suppl. Fig. 1c). Despite claims that interaction in the absence of main effects is a “ubiquitous” phenomenon in nature23,24, most examples are found at the molecular or cellular level and there are few convincing examples in human epidemiology. Nevertheless, there are examples of genetic effects that are apparent only groups with the relevant environmental exposure or of environmental factors that affect only those with the susceptible genotype (Box 1).
Heterogeneity and replication
When comparing studies with different exposure assessment tools, different distributions or characteristics of exposure (e.g., different sizes or chemical constituents of particulate air pollution across regions), or different confounders (e.g., co-pollutants, ethnic distributions with differing genetic background risk), the potential for true heterogeneity is magnified. If explanations can be found for such heterogeneity5, there is an opportunity for insights about the complexity of the disease, but spurious inconsistency due to methodological or data quality differences will just add confusion.
G × E interactions with candidate genes
Any of the standard epidemiological designs to study main effects of genes or environmental factors — cohort, case-control, or hybrid designs such as nested case-control or case-cohort25-27 — can also be applied to the study of G×E interactions. The issues for choosing between the designs are similar for main effects and interactions — for example, control of confounding and other biases, temporal sequence of exposure and disease, data quality, ability to examine multiple endpoints, and efficiency to detect rare diseases or rare risk factors (Table 1). For simplicity, I treat G in this section as a single functional polymorphism, but it could comprise a risk-associated haplotype, several causal variants within a gene, or some risk index composed of multiple rare variants. The same analysis techniques could be applied in any case (e.g., multiple logistic regression) and the design considerations would be similar. The following non-traditional designs offer particular advantages for studying interactions.
Table 1.
Study designs for G×E interactions
| Design | Approach | Advantages | Disadvantages | Settings | Examples |
|---|---|---|---|---|---|
| Basic epidemiologic designs | |||||
| Cohort | Comparison of incidence of new cases across groups defined by E and G | Freedom from most biases Clear temporal-sequence of cause & effect |
Large cohorts and/or long follow-up needed to obtain sufficient numbers of cases Possible biased losses to follow-up Changes in exposure may require recurring observation |
Common diseases or multiple endpoints; especially within biobanks | PI × fibrinogen in platelet aggregation in Framingham cohort154 |
| Case-control | Comparison of prevalence of E and G between cases and controls | Modest sample sizes needed for rare diseases Can individually match on confounders |
Recall bias for E Selection bias, particularly for control group |
Rare diseases with common E and G risk factors | CYP1A2, NAT2, smoking, and red meat in colorectal cancer57 |
| Case-only | Test of G-E association among cases, assuming G-E independence in the source population | Greater power than case-control or cohort | Bias if G-E assumption is incorrect | G×E studies where G-E independence can be assumed | Radiotherapy × DNA repair genes in second breast cancers32 |
| Randomized trial | Cohort study with random assignment of E across individuals | Experimental control of confounders | Prevention trials for disease incidence can require very large sample sizes | Experimental confirmation for chronic effects | Albuteral and β2AR in asthmatics126 |
| Crossover trial | Exposes each individual to the different Es in random order | Experimental control of confounders Within-individual comparisons |
Small sample sizes Only low doses possible, if potentially harmful |
Experimental confirmation for acute effects | Immunologic markers changes following allergen and diesel exhaust particles124 |
| Hybrid designs: | |||||
| Nested case-control | Matched selection of controls for each case in a cohort from disease-free survivors from the cohort | Basic freedom from bias of a cohort design, and efficiency of case-control design Simple analysis |
Each case group requires a separate control series | Studies within cohorts requiring additional data collection | Antioxidants × MPO in breast cancer155 |
| Case-cohort | Unmatched comparison of cases from a cohort with a random sample of the cohort | Same as nested-case control Can use same control group for multiple case series |
Complex analysis | Studies within cohorts with stored baseline biospecimens | APO-E and smoking for coronary heart disease in Framingham offspring cohort156 |
| Two-phase | Stratified sampling on D, E, and G for additional measurements (e.g., biomarkers) | High statistical efficiency for subsample measurements | Complex analysis | Substudies where outcome and predictor data are already available | GST genes and tobacco smoking in coronary heart disease47 |
| Countermatc hed | Matched selection of controls to be discordant for a surrogate for E | Permits individual matching Highly efficient for E main effect and G×E |
Complex control selection | Substudies where a matched design is needed | Radiotherapy × DNA repair genes in second breast cancers49 |
| Case-only/case-control | Bayesian compromise between case-only and case-control comparisons | Power advantage of case-only combined with robustness of case-control | Some bias when G-E association is moderate | G×E studies where G-E independence is uncertain | GSM1, NAT2, smoking, and diet in colorectal cancer34 |
| Family-based designs: | |||||
| Case-sibling (or – cousin) | Case-control comparison of E and G using unaffected relatives as controls | More powerful than case-control for G×E Immune to population stratification bias |
Discordant sibships difficult to enroll Overmatching for G main effects |
Populations with potential substructure | GSTM1 × air pollution in childhood asthma17 |
| Case-parent triad | Comparison of G for cases with what could have been inherited from parents, stratified by case's E | More powerful than case-control for G×E Immune to population stratification bias for G main effects |
Difficult to enroll complete triads Possible bias in G×E if G & E are associated within parental mating types |
Substructured populations, particularly for diseases of childhood | TGFα × maternal smoking, alcohol & vitamins in cleft palate157 |
| Twin studies | Comparison of disease concordance between MZ and DZ pairs in different environments | No genetic data required Can be extended to include half-sibs, twins reared together or apart, or compare discordant pairs on measured genes and environment |
Used mainly to identify interactions with unmeasured genes Assumption of similar environmental sharing between MZ and DZ pairs |
Exploratory studies of potential for G×E before specific genes have been identified | Concordance of insulin levels in relation to non-genetic variation in obesity 158 |
| GWA designs: | |||||
| Two-stage genotyping | Use of high-density panel on part of a case-control sample to select subset of SNPs with suggestive G or G×E interaction for testing using a custom panel in an independent sample, with joint analysis of both samples | Highly cost-efficient | Only part of sample has GWA genotypes | GWA studies for which complete SNP data on all subjects is not needed | None identified |
| Two-step interaction analysis | Preliminary filtering of a GWA scan for G-E association in combined case-control sample, followed by G×E testing of selected subset | Much more powerful for G×E or G×G interactions than a single-step analysis | Can miss some interactions | GWA studies with complete SNP data and focus on G×E | G× in utero tobacco in childhood asthma |
| DNA pooling | Comparison of allelic density in pools of cases and controls stratified by E, followed by individual genotyping | Highly cost efficient | Technical difficulties in forming pools and assaying allelic density Limited possibilities for testing interactions |
GWA studies where initial scan is severely limited by cost | None identified |
Case-only design
One of the earliest non-traditional designs was the case-only (or “case-case”) design28, which can only be used for testing interactions, not main effects. This design relies on an assumption of gene-environment independence in the source population to avoid estimating this association among controls, thereby increasing power for the test of interaction. While this assumption would be reasonable for most exogenous exposures like air pollution, the case-only design will yield a biased estimate of ORG×E and an elevated type I error rate if the independence assumption is violated. For example, genes involved in behavioral traits such as addiction might be expected to produce a causal association between G and E (e.g. tobacco smoking29,30) in the general population. Other G-E associations could arise indirectly; for instance, between oral contraceptives and BRCA1 through the effect of the gene on family history — a sister of an affected case might choose to take oral contraceptives to lessen her risk of ovarian cancer31.
Broeks et al.32 used a case-only design to assess the interaction between radiotherapy (RT) for treatment of a first breast cancer and mutations in four DNA damage repair genes (BRCA1, BRCA2, CHEK2, and ATM) on the subsequent risk of contralateral breast cancer (CBC). Among RT+ cases, there was a 2.2-fold higher prevalence of germline mutations in one or more of these genes than among RT– cases. Here it seems unlikely that genotypes would have affected the choice of treatment, except perhaps indirectly through tumor characteristics or stage at diagnosis (factors that could be adjusted for).
It is tempting to begin by testing for G-E association in controls and then decide whether to use the case-only test (for greater power if there is no G-E association) or the case-control test (for greater validity if there is). However, this naïve procedure leads to biased tests and estimates because it fails to take proper account of this two-step inference procedure33. More appropriate empirical Bayes34 or Bayes model averaging35 approaches have been developed that essentially provide weighted averages of the case-only and case-control estimators, yielding an acceptable trade-off between bias and efficiency. For example, Mukherjee et al.34 reanalyzed data on glutathione-S-transferase (GSTM1) and N-acetyl-transferase (NAT2) genotypes in relation to smoking and dietary factors. They found a strong association between NAT2 and smoking, so that their empirical Bayes estimate of the interaction between the two was closer to the case-control estimate than to the case-only one, which was in the opposite direction. However, there was no association between GSTM1 and fruit consumption, so the empirical Bayes estimate of that interaction was similar to both the case-control and case-only estimates, but took advantage of the smaller standard error of the latter.
Family-based association tests
Family-based association tests (FBATs) — case-parent-trios36, case-sibling37, designs using extended pedigrees38, and modified segregation analysis39 — are appealing because they avoid bias from population stratification, but are generally less powerful for testing main effects than case-control studies using unrelated controls. However, they can be more powerful for testing G×E interactions if relatives’ exposures are not too highly correlated37. Population stratification can bias G×E interactions only if the substructure is related to the gene and the environmental factor differentially—different ancestry-genotype associations in exposed and unexposed individuals—which seems unlikely. The case-parent trio design requires exposure information only on the cases (although it does require surviving parents for genotyping, making it more suitable for early-onset diseases) and entails a comparison of genetic relative risks between exposed and unexposed cases. The discordant sibship design requires exposure information on all cases and controls and uses standard conditional logistic regression tests of interaction. Twin studies40, segregation41, and linkage analysis42-44 can also be used for testing the existence of G×E with unknown genes or specific regions25.
Two-phase case-control design
Two other novel designs use different ways of selecting controls to improve the power for detecting either main effects or interactions. The two-phase case-control design45 is useful where a surrogate for exposure is readily available but data on exact doses, confounders, or modifiers require additional expensive data collection46. (Note that the kinds of two-phase sampling designs described here are fundamentally different from the two-stage genotyping designs for GWA studies described below.) These designs entail independent subsampling on the basis of both disease status and the exposure surrogate variable from a first-phase case-control or cohort study. Data from both phases are combined in the analysis, with appropriate allowance for the biased sampling in phase two. The optimal design entails over-representing the rarer cells, typically the exposed cases. Although most applications have focused on its use for improving exposure characterization for main effects or for better control of confounding, it can also be highly efficient for studying interaction effects. For example, Li et al.47 used a two-phase design nested within the Atherosclerosis Risk in Communities (ARIC) study to study the interaction between GSTM1/GSTT1 and cigarette smoking on the risk of coronary heart disease. Their sampling scheme was not fully efficient for addressing this particular question because it stratified only on intima media thickness, not smoking, and only for the controls, and did not exploit the information from the original cohort in the analysis. Reanalyses of other data from the ARIC study48 showed the considerable improvement in efficiency that can be obtained by using the full cohort information.
Countermatching
Countermatching is essentially a matched variant of the two-phase design. Here one or more controls are selected for each case on the basis of exposure so that each matched set contains the same number of exposed individuals. Another study of CBC in relation to RT and DNA damage repair genes49 counter-matched each CBC case to two controls with unilateral breast cancer, such that each matched set contained two RT+ subjects. Radiation doses to each quadrant of the contralateral breast were then estimated and DNA was obtained for genotyping candidate DNA repair genes and for a GWA scan. Langholz50 has demonstrated the considerable gains in power that can be obtained, both for main effects and for interactions. In particular, for G×E interactions Andrieu et al.51 showed that a 1:1:1:1 design counter-matched on surrogates for both exposure and genotype was more powerful than conventional 1:3 nested case-control or 1:3 or 2:2 designs counter-matched on just one of these factors.
Approaches for candidate pathway analyses
So far I have considered interactions between one gene and one environmental factor, but most candidate gene studies are based on a conceptual model for one or more hypothesized pathways. For example, most of the genetic studies being done for susceptibility to the effects of air pollution on children's asthma and lung growth within the Southern California Children's Health Study (CHS) have been motivated by a theoretical framework involving oxidative stress, inflammation, and modifiers such as anti-oxidant intake52. Typically such hypotheses lead to the selection of a set of candidate genes to be studied together. How then can these data be analyzed in combination to learn about the overall effect of the postulated pathway(s)?
Multifactor dimension reduction
Many exploratory methods have been developed for multivariate analysis of high-dimensional data ranging from standard multiple regression techniques to various machine learning or pattern recognition methods8,53,54. Perhaps the most popular of these methods to study interactions is Multifactor Dimension Reduction (MDR)8,55,56, which I applied in Box 3 to data on a reported four-way interaction between two exposures (smoking and red meat) and two genes (cytochrome P-450 (CYP1A2) and NAT2) in colorectal cancer57. Although this study is widely quoted as one of the few examples of a higher-order interaction, this analysis makes clear that the 4-way interaction is not internally reproducible by cross-validation. In this instance, MDR is more useful for putting a high-dimensional interaction in context than for discovering one, and emphasizes that if two-way interactions require large sample sizes, higher-order interactions require even larger sample sizes. Nevertheless, the interaction is biologically plausible (similar replicated interactions among NAT2, GSTM1, tobacco smoking, and occupational exposures have been reported for bladder cancer58) and is worth studying further using techniques that leverage known pathways.
Box 3. Multifactor Dimension Reduction.
A reanalysis by the author of grouped data from Le Marchand et al.44 on colorectal cancer in relation to two exposures, smoking and red meat (RM, R/M=rare/medium, WD=well done), and phenotypic markers of two genes, CYP1A2 and NAT2 (S/I=slow/intermediate, R = rapid acetelators) using the MDR technique. Blue shading indicates low risk strata, yellow high risk.
Training subset (9/10):
| Smoking: | Never | Ever | |||
|---|---|---|---|---|---|
| RM doneness: | R/M | WD | R/M | WD | |
| CYP1A2 | NAT2 | Numbers of cases / controls | |||
| ≤ median | S/I | 31/51 | 15/11 | 39/44 | 12/19 |
| R | 15/23 | 9/14 | 25/30 | 10/12 | |
| > median | S/I | 32/46 | 16/19 | 16/23 | 8/6 |
| R | 51/58 | 20/32 | 9/21 | 10/2 | |
Testing subset (1/10)
| Smoking: | Never | Ever | |||
|---|---|---|---|---|---|
| RM doneness: | R/M | WD | R/M | WD | |
| CYP1A2 | NAT2 | Numbers of cases / controls | |||
| ≤ median | S/I | 1/6 | 3/1 | 1/11 | 1/3 |
| R | 1/3 | 0/1 | 2/5 | 0/0 | |
| > median | S/I | 0/7 | 1/0 | 0/5 | 1/0 |
| R | 10/12 | 5/1 | 2/0 | 2/0 | |
The proportion correctly classified in the testing subset by the rule derived from the training data for this realization is 58/85 = 68.2%. Across 10 random training/testing subsets, however, the mean classification accuracy is only 49.7% (range 31.9–74.1%); this is no better than chance, due to the small numbers of subjects (12 cases, 2 controls) in the highest risk stratum. MDR explored all possible models (combinations of genes and environmental factors) and found that only the main effect of smoking on CRC risk was replicable.
Gene set enrichment analysis and hierarchical models
Since candidate pathway studies are hypothesis-driven, it seems appropriate to carry this reasoning through to the analysis59,60. Two approaches that attempt to leverage external information about biological pathways are summarized below and in Box 4. These methods, though promising, have not been widely applied to candidate gene studies so far.
Box 4. Pathway-based approaches to GWAS analysis.
Gene set enrichment analysis
This approach shifts the emphasis from the effects of individual SNPs to sets of genes known a priori to have related functions. First, each SNP is assigned to one or more genes, typically based on proximity and a summary statistic for each gene is obtained (e.g., the minimum p-value for all SNPs assigned to it). Then genes are assigned to gene sets and the distribution of gene-specific summary statistics for each set is compared with its null distribution, typically using the Kolmogoroff-Smirnoff test. Permutation may be used to allow for the non-uniformity of the null distributions. This method seems to have been applied only to purely genetic analyses, but could be extended to the genes involved in G×E interactions.
Hierarchical models
This approach supplements a traditional epidemiologic analysis (e.g., multiple logistic regression) with a second level in which the first-level regression coefficients are modeled in relation to a set of “prior covariates” derived from external information, such as pathway or genomic databases (see the figure). This shifts the main focus of inference from the effects of specific exposures, genes, or interactions to the effects of the pathways or other external predictors. It also provides more stable estimates of the individual risk factor effects by “borrowing strength” from related risk factors. The first-level associations may comprise a mixture of null and non-null ones, with probability depending upon prior covariates. The prior means of the non-null effects are regressed on prior covariates and their covariances can depend on a matrix of gene-gene connections. Rebbeck et al.18 provide a discussion of various sources of prior covariate information. 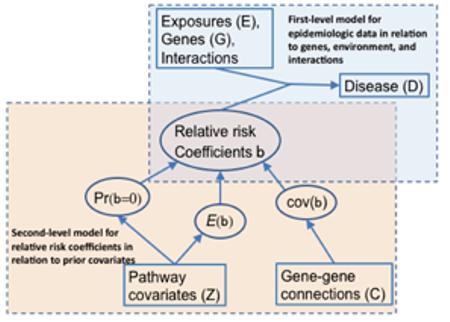
Gene set enrichment analysis (GSEA)61 tests whether disease-associated genes are significantly enriched for particular pathways. Although GSEA is widely used in the analysis of gene-expression data, methods for applying it in association studies have only recently been developed62-64 and have not yet been used for G×E studies.
Hierarchical models extend traditional multiple regression methods for exploring main effects and interactions in an epidemiological dataset by regressing the first-level coefficients on external data65-67. External information can include simple pathway indicator variables68, genomic annotation or pathway ontologies69, functional assays70, in silico predictions of function or evolutionary conservation71, or simulation of pathway kinetics72,73.
Both the GSEA and hierarchical modeling approaches can be thought of as “empirical” as they use external information only to guide the selection of terms to include in a model or to stabilize their estimation. These approaches do not fit strong mechanistic models directly — our understanding of the basic biology is too primitive — although there have been notable successes. Some of the earliest were stochastic models for multistage carcinogenesis74,75, but they have not been applied to pathways involving specific genes. Another area that has seen extensive mathematical modeling is the pharmacokinetics and pharmacodynamics of drug metabolism76, exposure to toxic substances77,78, and normal metabolism79,80. While inter-individual variation in metabolic rate parameters has long been recognized, their genetic basis has only recently been incorporated into this kind of modeling81,82.
Use of biomarkers
Even when supplemented with external information, the informativeness of epidemiological studies of chronic disease endpoints for the purpose of pathway analysis is limited by the dichotomous nature of the phenotype. The information content may be improved by obtaining biomarker data on some of the intermediate steps in the process. Ideally, biomarker specimens would be sampled longitudinally and before disease onset. This may be prohibitively expensive, so the two-phase case-control design samples individuals from a cohort or case-control study based on disease, exposure, and genotype information83. Nested case-control studies within biobanks overcome the problem of reverse causation by using stored specimens and exposure information obtained at enrollment. Mendelian randomization84,85 provides another way to avoid reverse causation by using genes (which are not subject to this problem) as instrumental variables86 for the biomarker–disease relationship. In a randomized trial of estrogen plus progestin, Dai et al.87 used a two-phase design to assess interactions of treatment with thrombosis biomarkers and found that estimates of the interaction effect were considerably more precise than those from the case-control study alone or standard two-phase estimators not assuming G-E independence.
Mining GWA data for G × E interactions
Although the approaches described above could be used in a genome-wide context, the enormous cost, computational burden, multiple comparisons penalty, and general absence of prior knowledge about most SNPs pose additional complexities. For main effects of genes, various design and analysis issues have been widely discussed88,89, so the remainder of this Review focuses on the use of GWA data for G×E. Both two-stage genotyping designs and two-step analyses of a single-stage design discussed below could be applied to interaction studies (Box 5). In contrast to the pathway-based approaches in the previous section, these novel techniques are readily applicable to GWA data now.
BOX 5. Designs for Genome Wide Interaction Scans.
Although any of the designs for studying G×E interactions with single genes could be used for GWA studies including interactions (GEWIS), the following five have the potential to greatly improve power or cost-efficiency:
Two-phase case-control: combines GWA SNPs data on a subsample of a large epidemiologic case-control or cohort study stratified jointly by disease and exposure with the data on exposure (and possibly established genes) from the parent study, with adjustment for the biased sampling. For example, Li et al. 47 compared CHD cases with a stratified subcohort based on age, gender, and carotid intima thickness (IMT) and found an interaction between smoking and the GSTT1 null genotype.
Two-stage genotyping: Uses a high-density genotyping chip or array technology to assay hundreds of thousands or over a million SNPs on a random sample of cases and controls and then selects the most promising of these based on main effects and interactions for custom genotyping in the remainder of the sample. The final analysis combines the information on the selected SNPs and environmental factors from both samples.
- Two-step analyses: The multiple comparisons penalty for looking at all possible interactions within a sample with complete GWA SNP data is reduced by restricting the final analysis to only a subset of the possible interactions based on a preliminary filtering step. Two approaches to this filtering have been suggested:
Joint case-only/case-control: Apply the empirical Bayes or Bayes model averaging combination of the case-only and case-control tests to all possible interactions.
DNA pooling: pools of DNA from cases and controls, stratified by exposure, are tested for differences in allele frequency, followed by individual genotyping in the same or new samples.
Two-stage genotyping design
The two-stage genotyping design90 has been extended to GWA scale91-94 and used to discover main effects in many studies. The design is also attractive for GEWIS, but requires choices about how to select the SNPs to be carried forward to the second stage based on promising main effects and interactions. Any SNP for which the main effect or any of the G×E/G×G interaction tests attained the appropriately Bonferroni-corrected significance level would be chosen for inclusion in stage 2 genotyping. While an optimal selection of numbers of hits of each type to pursue so as to maximize the yield of true positives would require knowledge of the distribution of true effect sizes of each type, reasonable bets might be made based on previous literature and calculation of the power to detect similar effects.
Two-step analysis approaches
A conventional two-step analysis of G×G interactions in a single-stage GWA study restricts the search for interactions to gene pairs for which one or both members shows a marginal association. It can be more powerful than an exhaustive scan for all possible pair-wise interactions, but risks missing those with no or weak marginal effects8,95-97. In addition, scanning for higher-order (G×G×G…) interactions is computationally infeasible without filtering based on main effects and/or lower-order interactions. While this filtering approach could also be applied to G×E interactions, it does not exploit the ability of the following two-step approaches to use different designs.
The case-only design is appealing for a GEWIS because of its greater power than the case-control design and because most GWA SNPs are unlikely to be correlated with environmental factors in the source population. Nevertheless, some false positives due to G-E association may occur, and even if only a small proportion of all SNPs were associated, they could represent a high proportion of all reported G×E interactions. Since any scan for interactions is likely to have been accompanied by a main effects scan, controls are probably available anyway, so it would be wasteful not to use them. (The exception would be if public controls with no environmental data, or non-comparable data, were used for the main effects scan, combining case-only information on G×E interactions with case-control information on genetic main effects98.) Two basic approaches have been suggested for taking advantage of controls to protect against false positives while exploiting the power advantage of the case-control design. Murcray et al.99 introduced a two-step analysis of a single-stage GWA study (FIG 1), in which G-E association is first tested in the combined case and control sample and only the most significant SNPs are then tested for G×E interaction using the standard case-control test. The second general approach is the empirical Bayes34 or Bayes model averaging35 methods that combine the case-only and case-control estimators to provide a reasonable trade-off between validity and efficiency. Simulation studies show that these approaches can have better power than the two-step analysis over a range of modest interaction relative risks, while the two-step approach is more powerful for larger relative risks.
Figure 1.

Schematic representation of the two-step GEWIS test for G×E interaction of Murcray et al. G1,…GM denotes the genotypes at each SNP in a GWAS and E denotes a binary exposure variable. G-E association is first tested in the combined case and control sample and only the most significant SNPs are then tested for G×E interaction using the standard case-control (in this example, the second and fourth rows are taken forward to the second step). Despite the dilution of the induced G-E association in the first step by the inclusion of the controls, this approach yields a second-step test that is independent of the first and hence need only be corrected for the number of SNPs actually taken forward to the second. They showed that the resulting procedure has dramatically better power than a conventional single-step case-control comparison. The optimal design depends only weakly on the true model parameters. For rare diseases with a 1:1 ratio, any first-stage significance level of α1 ~ 0.0001 yields roughly similar power, although a common disease would require a much larger α1. In an application to the CHS GWA study for asthma, the first-stage test of association between SNPs and in utero tobacco smoke exposure in the combined case-control sample identified 15,006 SNPs that attained the optimized first-step threshold of α1 = 0.025; of these, the second stage case-control test yielded one nearly significant interaction (the second example in the figure), which would not have been deemed genomewide significant in a traditional 1-step test, nor by its main effect. This SNP shows no effect in the absence of in utero tobacco exposure and exposure shows no effect in non-carriers of the minor allele. The first row illustrates the most significant SNP × E interaction in a conventional single-stage test that fails the first-step procedure and hence is declared non-significant in the two-step procedure. The fourth row illustrates the most significant SNP–E association in the first step, which shows no sign of SNP×E interaction in the second step. (The marginal totals differ slightly from row to row because of missing genotypes.)
DNA pooling
Another possible approach to saving on genotyping costs is DNA pooling, at least for an initial screen, to be followed by individual genotyping of promising loci100. Beyond the technical challenges in forming comparable pools and assaying allelic concentrations, this approach would be feasible for studies of G×E interactions only if the pools were stratified on the basis of exposure, thus limiting the number of possible environmental factors that could be considered. Recent advances in DNA bar-coding101, however, would permit the reconstruction of individual genotypes from within pools, thereby allowing a broader range of interaction analyses102.
Prioritization of hits to pursue
One must sift through a massive number of potential “hits” to decide which should be considered in subsequent stages of a multi-stage genotyping design, in independent replication studies, or in functional assays. This decision is usually based on statistical significance, but also entails expert judgment based on the internal consistency of the results and the coherence with other knowledge (e.g., the existence of other GWA associations for the same or related traits or biological pathways). Coherence has tended to be a more informal judgment, but various methods have emerged for formalizing this process. The following techniques can be viewed as well established and available for application now, although because of their novelty, there are few applications so far. See REF. 103 for an excellent review of the available techniques in the context of genetic main effects.
One of the first was a weighted False Discovery Rate (FDR) approach104, which uses external information to prioritize some SNPs or regions while maintaining a fixed overall FDR. Bayesian versions of the FDR have also been described105,106, as well as the use of Bayes factors107 and empirical Bayes shrinkage108. Both GSEA and hierarchical modeling approaches are also amenable to incorporating external knowledge. Several authors109-111 have described applications of the hierarchical Bayes modeling approach to GWA data using prior covariates extracted from genomic or pathway ontologies. While these have focused on main effects, the methods are also applicable to GEWIS11, the limiting factor presently being the lack of suitable ontologies for interaction effects. Meanwhile, a growing literature is discussing various ways of using GSEA or other methods of integrating pathway knowledge into GWA analyses9,62-64,112-116. Few studies have explicitly included G×E interactions in formal pathway-based analyses of GWA data117. A promising approach entails incorporating metabolomics, as in the first GWA of a large panel of metabolite phenotypes118, which found associations of 4 genes with metabolite concentration ratios for enzymatic activities that matched the pathways in which these enzymes act.
Methods for discovering novel pathways
An emerging idea is to use Bayesian network analysis119-121 or similar techniques to discover novel pathways. Bayesian networks have been widely used in the analysis of gene co-expression data to discover cliques of interacting loci. The starting point is usually a matrix of gene-gene correlations across multiple experimental conditions (e.g., time series of synchronized cell cultures or different environmental stressors), which can be used to derive a parsimonious graphical representation of the important interactions. Unlike co-expression data, GWA data provides only a single estimate of the association between genotype and phenotype, but no information about gene-gene connections. G×G interaction analyses do, however, yield information about pairs of genes that could be mined in a similar way, as could G×E interactions. Sebastiani et al.10 applied the technique to modeling the posterior probability of genotypes and exposures given disease status, yielding graphical models that can be interpreted in terms of interactions. However, these probabilities depend on both the risk of disease given G and E (and their interactions) and the correlations among these factors, so do not represent a pure interactome122 model. Alternatively, a known network can be used as either a prior covariance matrix for main effects or as prior covariates for interactions in a hierarchical model (Box 4). Although potentially exciting, such methods have yet to be applied on a GWA scale.
Experimental validation of G × E interactions
Experimental studies offer unique promise for validating G×E interactions, as both exposure and genotypes can be carefully controlled through randomization. Model organisms are commonly used for evaluating genetic modifiers of drug response; for example, Koch and Britton123 used selective breeding of rats on aerobic capacity to study gene-diet interactions in body weight and various metabolic markers. In human challenge studies, a randomized crossover design is typically used, in which volunteers are exposed to one or more environmental exposures in random order. In one intra-nasal challenge study of allergen alone or with diesel exhaust particles, various immunological responses were measured124. Stratified analyses revealed that those with the GSTM1 null or GSTP1 I/I genotypes had significantly larger increases in IgE and histamine levels after diesel challenge. Subjects were not preselected on the basis of genotype, so results were limited by the relatively small numbers of subjects with the susceptible genotypes. Challenge studies nested within epidemiologic cohorts for which genotypes (and possibly various outcomes) are already available could be more powerful.
Clinical trials also allow controlled comparisons for G×E interactions and more powerful designs using two-phase sampling on various combinations of genotype, treatment, outcomes, and possibly other factors93,125. For example, Israel et al.126 performed a clinical trial of albuteral in asthmatics, matching pairs on forced expiratory volume and β2AR genotypes, and found a highly significant gene × treatment interaction. A case-only design nested within a clinical trial is particularly appealing for evaluating gene-treatment interactions on survival or other treatment responses, as treatment assignment is independent of genotype by virtue of randomization127,128.
Needs for Further Progress
Better ontologies
The biggest barrier to integrating biological knowledge with agnostic GEWIS data may be the lack of ontologies designed to bring together information from SNPs, genes, and pathways, but also their relevant environmental substrates, known relationships to disease, metabolic parameters, and toxicological information. The creation of such a database is arguably one of the most important contributions of the Human Genome Epidemiology Network (HuGE NET) project129, but is highly labor-intensive because expert curation of the literature is needed; their valuable series of reviews on specific topics130,131 does not replace the need for a searchable database that could provide prior covariate information in a systematic and unbiased manner. Automatic literature-mining approaches132,133 have been developed that can help assign sets of genes to shared pathways or interaction networks. However, they are still vulnerable to bias in what is investigated and published; the current literature on G×E interactions is very sparse, highly subject to publication bias, poorly replicated, and tends to reflect a “looking under the lamppost” mentality in terms of what gets studied. Other genomic or pathway ontologies134-136 tend to be limited to purely genetic information and are only partially useful for G×E modeling.
Environmental pathways mediated through epigenetics and other mechanisms
One of the aims of pathway-based modeling is to understand how genetic and environmental effects are mediated through intermediate events such as changes in gene expression, epigenetic events like DNA methylation137, somatic mutations138, and small-interfering RNAs139. These phenomena have been studied in relation to disease and to a lesser extent exposure140,141, but the full pathways from genes and exposures through epigenetics to disease remain to be studied137. For example, the seminal observation142 that MZ twins start life with identical methylation patterns but subsequently diverge suggests the effect of environmental factors and may provide a mechanism for their subsequent discordance in disease. Latent variable models could be used to treat biomarker measurements as surrogate observations of a long-term unobserved process leading to disease. Various –omics technologies could provide high-dimensional measurements of intermediate processes on targeted subsamples of epidemiologic study subjects, although the multiple comparisons challenges of relating high-dimensional phenotypes to high-dimensional genotypes and interactions are even more daunting than for regular GWA studies. Alternatively, stand-alone studies or external databases can be used to construct prior covariates to inform G×E analyses of epidemiologic studies. For example, GWA data on immunologic markers for a challenge study of allergen and diesel exhaust particles are being used to define a set of immunologic covariates associated with each SNP as priors in a hierarchical model for a GWA study of asthma. Associations of genome-wide expression with genome-wide SNPs143 could be used in a similar manner, and would likely be even more promising for G×E interactions if based on expression studies conducted under a range of environmental conditions.
Next-generation sequencing and rare variants in a G×E context
Increasing attention is being paid to the possibility that rare variants might account for at least some of the missing heritability144. Next-generation sequencing methods are making it feasible to sequence portions of the genome identified through a GWA study in a subset of study subjects. Until it becomes possible to obtain and manage genome-wide sequence information on the massive sample sizes that would be required to discover associations with rare variants directly, some form of informative sampling approaches will be required. For example, one might sequence a subsample of cases and controls, stratified by associated SNPs in a given region, family history, and environmental factors, to discover novel variants in the region and for a joint analysis of subsample and main study data94,145. The imminent availability of the 1000 Genomes Project146 data will doubtless have a profound effect on the design of such studies.
Public health and personal medicine implications
Insights from G×E interactions could have important policy implications for environmental health standards147, targeting of interventions148, and treatment selection149 (Box 2). For example, the Clean Air Act directs the U.S. Environmental Protection Agency to set standards to protect the most sensitive, including genetically susceptible individuals150, although it has been argued that public health interventions aimed at the whole population may be more effective151. As another example, suppose the joint effect of mutations in BRCA1/2 and radiotherapy in an individual were multiplicative; then even if the radiation effect in mutation carriers alone was not statistically significant or the joint effect was not significantly greater than additive, it would be misleading to conclude that radiotherapy was no more dangerous for carriers than for noncarriers, owing to their much higher baseline risk152. Since any statement about interaction is necessarily scale dependent (Box 1), it is essential that claims about the presence or absence of an interaction make clear whether it is a departure from an additive or multiplicative model on a scale of absolute or attributable risk, odds, underlying liability, or some other scale that is being discussed. Unfortunately, translation of scientific understanding about G×E interactions into risk assessment and prevention policies has so far been limited153.
Conclusions
The current enthusiasm for studying genetic associations with disease, recently enhanced by the advent of GWA studies, has tended to overshadow the important role of environmental factors and G×E interactions. While these are much more difficult to study than purely genetic associations, requiring careful collection of exposure data and rigorous study designs, standard epidemiologic designs can be used and several recently developed variants of them can enhance power. Nevertheless, large consortia will likely be needed to fully explore G×E interactions, requiring attention to these principles and harmonization across studies. The use of powerful pathway-based methods that leverage external biological knowledge can further enhance power and insight.
ONLINE SUMMARY.
Studies of gene-environment can be useful for investigating biological pathways, discovering genes that act only in particular environments or exposures that are hazardous only to genetically susceptible individuals, setting environmental safety standards, understanding heterogeneity in genetic associations across populations, predicting individual risk and changes that might result from changes in modifiable risk factors, and choosing the best treatment based on a patient's genotype.
While basic epidemiological cohort or case-control designs can be used, more powerful alternatives for studying G×E interactions include the case-only, two-phase case-control, and counter-matched designs. Case-only substudies within clinical trials are attractive for studying genetic modifiers of treatment response because genotype and treatment can be assumed independent through randomization.
Various exploratory and hypothesis-driven approaches are available to examine the joint effects of multiple genes and exposures in a common pathway. Hierarchical models provide a way to incorporate external knowledge about the pathway into the analysis of complex interactions in the study data.
Two-step analyses can be used in genome-wide association studies to target a subset of promising interactions and improve power for testing them in the same dataset using an independent test. New methods are being developed to use pathway information to guide the search for novel genes and interactions or to mine agnostic genome scans for novel pathways.
Comprehensive ontologies that incorporate environmental and toxicological information into genomic and pathway databases will be useful for informing future analysis of complex G×E interactions in both pathway-driven and GWA scans.
Emerging areas include understanding the environmental influences on gene expression through epigenetics, somatic mutations, and other mechanisms and their roles in disease causation. Various types of biomarkers and high-volume metabolomics methods can be incorporated as intermediate variables in pathway-based analysis methods.
Supplementary Material
DEFINITIONS TO APPEAR IN THE MARGINS
- Marginal effects
The effect of a specific risk factor (gene or exposure) in the population as a whole, averaging over all other variables.
- Genome-wide association studies
A scan of the entire genome for association with a disease or trait using a standard panel of ~500K to 1M haplotype-tagging SNPs.
- Cohort study
A follow-up study of unaffected individuals to compare their rates of new disease in relation to their genotypes and exposures at start of follow-up (and possibly changes in exposure during follow-up)
- Case-control study
A comparison of cases of a disease with randomly selected or matched individuals from the source population free of disease in terms of their genotypes and exposures prior to disease onset.
- Gene-Environment-Wide Interaction studies
A scan of the entire genome for interactions with various environmental exposures.
- Ecologic-level studies
Observational epidemiology studies that rely on comparisons of aggregate disease rates across groups in relation to aggregate exposure information rather than comparisons between individuals.
- Two-phase case-control design
A form of case-control study in which subjects are subsampled based on both disease and surrogates for exposure or genes.
- Interaction odds ratio
The ratio of odds ratios for the relationship of one factor (e.g., a gene) with disease across the levels of another factor (e.g., an environmental exposure); as such, it is a measure of departure from a multiplicative joint effect.
- Nested case-control study
Hybrid design that selects matched controls for each case from the cohort members who are still disease free at that time.
- Case-cohort study
A hybrid design based on an unmatched comparison of all cases with a random sample of the cohort at entry using survival analysis methods.
- Confounding
A spurious association between a risk factor (gene or exposure or interaction) and disease induced by the joint associations of some other variable with the risk factor and with disease independently of the risk factor. Confounding can also distort the magnitude of a true risk factor to disease association or mask it.
- Case-only study
A test of multiplicative interaction based on testing G–E association among cases, under the assumption of gene-environment independence.
- Gene-environment independence
The independent distribution of genotype and environment in the source population.
- Empirical Bayes
A technique for estimating the effects of each component of a large ensemble of related variables by assuming the ensemble has some common distribution and estimating the parameters of that distribution. Empirical Bayes estimators typically have better prediction error than estimating each one separately.
- Bayes model averaging
A technique for accounting for uncertainty about the correct model form (e.g., selection of variables to include in a multiple regression model) by averaging the effects of each possible variable over the set of all plausible models.
- Case-parent trio design
A design for testing gene-disease associations by comparing the genotypes of cases to the set of genotypes they could have inherited from their parents; for G×E interactions, only the case's exposure is needed, the comparison being of genetic relative risks between exposed and unexposed cases.
- Case-sibling design
A standard matched case-control design using unaffected siblings (or other relatives, such as cousins) as controls
- Modified segregation analysis
This analysis applies likelihood-based methods to pedigree data in which one or more members have genotypes available at a major gene, summing untyped individuals over their conditional genotype probabilities given the available genotypes.
- Population stratification
The phenomenon of an apparently homogeneous population comprising subgroups of individuals with distinct ancestral origins and differing allele frequencies at many loci, leading to bias in the assessment of the significance of associations of a trait with particular loci.
- Twin studies
Estimate heritability for G×E interactions with all unknown genetic loci combined by comparing twin pairs that are concordant or discordant for exposure.
- Joint segregation and linkage analysis
Uses family studies to estimate parameters of a penetrance model, which could include interaction terms between the unobserved major gene linked to a marker and environmental factors
- Countermatching
A form of case-control study in which controls are individually selected for each case to be discordant for exposure or a surrogate for it.
- Multiple regression
A standard statistical technique to relate a single outcome variable to multiple explanatory variables, either all at once or using some variable selection method, such as stepwise, forward selection, or backward elimination.
- Machine learning
Any of many data analysis techniques for mining large datasets derived from the computer science field, not specifically based on mathematical statistics theory.
- Pattern recognition
Any technique from exploratory data analysis or machine learning for discovering non-random patterns in large datasets.
- Gene set enrichment analysis
A method for combining data on the association between disease and a large set of genes with data on the pathways that subsets of genes have in common by assessing the extent to which genes in the same pathway tend to show similar associations with disease.
- Hierarchical modeling
A statistical analysis method that uses multiple levels of regression models in which the parameters of the first-level model for the study data (e.g., RR estimates for many genes) are treated as the dependent variables in a second-level model to be regressed on external data describing their characteristics (e.g., the pathways in which specific genes are thought to act).
- First level coefficients
In a hierarchical model, the regression coefficients (e.g., log relative risks for each variable) for the subject-level data on the association between risk factors and disease. Unlike a non-hierarchical model, these coefficients are treated as random variables with distributions described in the higher level(s) of the model rather than as model parameters to be estimated directly.
- Pathway indicator variables
One of various types of information that can be used as predictor variables in the higher levels of a hierarchical model, specifically binary variables indicating whether a particular gene or interaction is thought to have a role in a particular pathway.
- Ontology
A formal system for organizing knowledge, here used in the context of biological pathways as a means of synthesizing information about the function of genes and exposures and their joint roles in disease causation.
- Reverse causation
A bias in the estimation of the causal effect of a biomarker on disease when biospecimens are obtained after diagnosis, because the disease or its treatment alters the underlying intermediate variable or measurement of it
- Mendelian randomization
A technique for studying the relationship between a biomarker and disease indirectly by studying the relationship of each to a gene that influences the biomarker.
- Instrumental variable
In statistics, a variable that can be used to predict the value of an explanatory variable that is measured with error and thereby indirectly yields an unbiased estimate of the relationship of the explanatory variable with an outcome variable.
- Multiple comparisons penalty
Any of several adjustment methods aimed at taking account of the higher degree of statistical significance required for a particular association to be considered noteworthy when many possible associations are analyzed simultaneously. Best known is the “Bonferroni correction”.
- Two-stage genotyping design
A design for a GWA study in which a subset of the available samples are tested using a high-density genotyping array and only the most strongly associated SNPs are then tested using a custom array on the remaining samples, using a joint analysis of both stages (allowing for their overlap) for final significance testing.
- Two-step analysis
Any of several analytical approaches to analyzing all the data from a single-stage genotyping design in two-steps, the set of associations being considered in the second step being based on a screening test in the first step.
- Bonferroni correction
A multiple comparisons adjustment based on multiplying the p-value for a specific test by the total number of tests performed, for testing at a conventional significance level; this procedure approximately controls the overall Type I error rate (the probability of at least one false positive association) at the chosen significance level if the predictors are independent.
- False Discovery Rate
An approach to judging which of many associations are noteworthy by controlling the expected proportion of all reported positive associations that are false positives rather than the conventional significance level (the expected proportion of all truly null associations that are reported as significantly positive).
- DNA pooling
An approach to genetic association analysis by creating multiple pools of case DNA and control DNA and then comparing the mean density of variant alleles at each locus between case and control pools.
- DNA bar coding
The addition of a unique molecular tag to each fragment of an individual's DNA so that after pooling with other DNA samples, the genotype of each individual in the pool can be reconstructed.
- Coherence
The extent to which the data at hand is concordant with other types of biological knowledge, reinforcing a causal interpretation.
- Bayesian network analysis
A technique for developing a minimal graphical representation of the connections among a large set of variables by examining the conditional independence relationships among pairs of variables given the other variables connected to them within the graph. This technique has been widely used for analysis of gene co-expression data, for example.
- Challenge studies
Various experimental designs to assess the effects of a noxious agent by exposing individuals to trace amounts in a controlled setting (as in a randomized or crossover trial). For G×E, the effects can be compared across subgroups with different genotypes; efficiency can be improved by stratified sampling based on genotype.
- Latent variable models
A model involving one or more unobservable intermediate variables representing the pathway connecting a cause (e.g., exposures and genotypes) and an effect (e.g., disease); identifiability typically requires surrogate measures (e.g., biomarkers) of these latent variables, in addition to the cause and effect variables.
- 1000 Genomes Project
A large-scale effort to obtain and catalog the full genome-wide DNA sequence of 1000 individuals selected from a range of races.
Biography
Duncan Thomas is Professor and Director of the Biostatistics Division of the Department of Preventive Medicine in the Keck School of Medicine at the Uniuversity of Southern California and holds the Verna Richter Chair in Cancer Research. His major research interests are in the development of study design and statistical analysis methods for genetic and environmental epidemiology and their interface. He has been a coinvestigator on numerous studies ranging from radiation carcinogenesis to the health effects of air pollution and their genetic modifiers.
REFERENCES
- 1.Le Marchand L. The predominance of the environment over genes in cancer causation: implications for genetic epidemiology. Cancer Epidemiol Biomarkers Prev. 2005;14:1037–9. doi: 10.1158/1055-9965.EPI-04-0816. [DOI] [PubMed] [Google Scholar]
- 2.Le Marchand L, Wilkens LR. Design considerations for genomic association studies: importance of gene-environment interactions. Cancer Epidemiol Biomarkers Prev. 2008;17:263–7. doi: 10.1158/1055-9965.EPI-07-0402. [DOI] [PubMed] [Google Scholar]
- 3.Kraft P, Yen YC, Stram DO, Morrison J, Gauderman WJ. Exploiting gene-environment interaction to detect genetic associations. Hum Hered. 2007;63:111–119. doi: 10.1159/000099183. [DOI] [PubMed] [Google Scholar]
- 4.Hunter DJ. Gene-environment interactions in human diseases. Nat Rev Genet. 2005;6:287–298. doi: 10.1038/nrg1578. An excellent review of the basic principles of epidemiological study designs for G×E interactions in the pre-GWAS era. Amongst other insights, the author argues that G×E findings can “point the finger” towards the causal constituent of a complex mixture. [DOI] [PubMed] [Google Scholar]
- 5.Greene CS, Penrod NM, Williams SM, Moore JH. Failure to replicate a genetic association may provide important clues about genetic architecture. PLoS One. 2009;4:e5639. doi: 10.1371/journal.pone.0005639. [DOI] [PMC free article] [PubMed] [Google Scholar]
- 6.Ioannidis JP. Non-replication and inconsistency in the genome-wide association setting. Hum Hered. 2007;64:203–13. doi: 10.1159/000103512. [DOI] [PubMed] [Google Scholar]
- 7.Thomas D. Methods for investigating gene-environment interactions in candidate pathway and genome-wide association studies. Annu Rev Public Health. 2010;31 doi: 10.1146/annurev.publhealth.012809.103619. Epub 2010/01/15. [DOI] [PMC free article] [PubMed] [Google Scholar]
- 8.Cordell HJ. Detecting gene-gene interactions that underlie human diseases. Nat Rev Genet. 2009;10:392–404. doi: 10.1038/nrg2579. [DOI] [PMC free article] [PubMed] [Google Scholar]
- 9.Holmans P, et al. Gene Ontology analysis of GWA study data sets provides insights into the biology of bipolar disorder. Am J Hum Genet. 2009;85:13–24. doi: 10.1016/j.ajhg.2009.05.011. [DOI] [PMC free article] [PubMed] [Google Scholar]
- 10.Sebastiani P, Ramoni MF, Nolan V, Baldwin CT, Steinberg MH. Genetic dissection and prognostic modeling of overt stroke in sickle cell anemia. Nat Genet. 2005;37:435–40. doi: 10.1038/ng1533. [DOI] [PMC free article] [PubMed] [Google Scholar]
- 11.Khoury MJ, Wacholder S. Invited commentary: from genome-wide association studies to gene-environment-wide interaction studies--challenges and opportunities. Am J Epidemiol. 2009;169:227–30. doi: 10.1093/aje/kwn351. discussion 234-5. [DOI] [PMC free article] [PubMed] [Google Scholar]
- 12.Thomas DC. Exposure-time-response relationships with applications to cancer epidemiology. Ann Rev Publ Health. 1988;9:451–482. doi: 10.1146/annurev.pu.09.050188.002315. [DOI] [PubMed] [Google Scholar]
- 13.Thomas DC, Stram D, Dwyer J. Exposure measurement error: Influence on exposure-disease relationships and methods of correction. Ann Rev Publ Health. 1993;14:69–93. doi: 10.1146/annurev.pu.14.050193.000441. [DOI] [PubMed] [Google Scholar]
- 14.Lobach I, Carroll RJ, Spinka C, Gail MH, Chatterjee N. Haplotype-based regression analysis and inference of case-control studies with unphased genotypes and measurement errors in environmental exposures. Biometrics. 2008;64:673–84. doi: 10.1111/j.1541-0420.2007.00930.x. [DOI] [PMC free article] [PubMed] [Google Scholar]
- 15.Wong MY, Day NE, Luan JA, Wareham NJ. Estimation of magnitude in gene-environment interactions in the presence of measurement error. Stat Med. 2004;23:987–98. doi: 10.1002/sim.1662. [DOI] [PubMed] [Google Scholar]
- 16.Smith PG, Day NE. The design of case-control studies: the influence of confounding and interaction effects. Int J Epidemiol. 1984;13:356–65. doi: 10.1093/ije/13.3.356. [DOI] [PubMed] [Google Scholar]
- 17.Gauderman WJ. Sample size requirements for matched case-control studies of gene-environment interaction. Stat Med. 2002;21:35–50. doi: 10.1002/sim.973. This paper describes a general approach to sample size and power calculations for G×E studies and the capabilities of the freely-available QUANTO program for this purpose. [DOI] [PubMed] [Google Scholar]
- 18.Garcia-Closas M, Lubin JH. Power and sample size calculations in case-control studies of gene-environment interactions: comments on different approaches. Am J Epidemiol. 1999;149:689–92. doi: 10.1093/oxfordjournals.aje.a009876. [DOI] [PubMed] [Google Scholar]
- 19.Burton PR, et al. Size matters: just how big is BIG?: Quantifying realistic sample size requirements for human genome epidemiology. Int J Epidemiol. 2009;38:263–73. doi: 10.1093/ije/dyn147. [DOI] [PMC free article] [PubMed] [Google Scholar]
- 20.Ioannidis JP, Trikalinos TA, Khoury MJ. Implications of small effect sizes of individual genetic variants on the design and interpretation of genetic association studies of complex diseases. Am J Epidemiol. 2006;164:609–14. doi: 10.1093/aje/kwj259. [DOI] [PubMed] [Google Scholar]
- 21.Matullo G, Berwick M, Vineis P. Gene-environment interactions: how many false positives? J Natl Cancer Inst. 2005;97:550–1. doi: 10.1093/jnci/dji122. [DOI] [PubMed] [Google Scholar]
- 22.Clayton D, McKeigue PM. Epidemiological methods for studying genes and environmental factors in complex diseases. Lancet. 2001;358:1356–60. doi: 10.1016/S0140-6736(01)06418-2. This paper takes a critical look at the current enthusiasm for G×E interactions, particularly in the context of large biobanks. The authors argue for case-control studies over cohort studies and for relying on case-only methods for detecting G×E interactions; however, they question whether genes involved in interactions might not more easily be discovered on the basis of the marginal associations they induce. [DOI] [PubMed] [Google Scholar]
- 23.Moore JH. The ubiquitous nature of epistasis in determining susceptibility to common human diseases. Hum Hered. 2003;56:73–82. doi: 10.1159/000073735. The creator of the Multifactor Dimension Reduction algorithm for identifying higher-order interactions gives a spirited argument in support of the notion that many such effects would be overlooked by limiting attention to factors showing significant main effects. [DOI] [PubMed] [Google Scholar]
- 24.Moore JH, Williams SM. Epistasis and Its Implications for Personal Genetics. Am J Hum Genet. 2009;85:309–320. doi: 10.1016/j.ajhg.2009.08.006. [DOI] [PMC free article] [PubMed] [Google Scholar]
- 25.Yang Q, Khoury MJ. Evolving methods in genetic epidemiology. III. Gene-environment interaction in epidemiologic research. Epidemiologic Reviews. 1997;19:33–43. doi: 10.1093/oxfordjournals.epirev.a017944. Another excellent review of study design principles for G×E interactions covering a broad range of designs. [DOI] [PubMed] [Google Scholar]
- 26.Manolio TA, Bailey-Wilson JE, Collins FS. Genes, environment and the value of prospective cohort studies. Nature Reviews Genetics. 2006;7:812–20. doi: 10.1038/nrg1919. [DOI] [PubMed] [Google Scholar]
- 27.Andrieu N, Goldstein AM. Epidemiologic and genetic approaches in the study of gene-environment interaction: an overview of available methods. Epidemiol Rev. 1998;20:137–47. doi: 10.1093/oxfordjournals.epirev.a017976. [DOI] [PubMed] [Google Scholar]
- 28.Piegorsch W, Weinberg C, Taylor J. Non-hierarchical logistic models and case-only designs for assessing susceptibility in population-based case-control studies. Stat Med. 1994;13:153–162. doi: 10.1002/sim.4780130206. The paper that introduced the case-only design for testing G×E interactions. [DOI] [PubMed] [Google Scholar]
- 29.Caporaso N, et al. Genome-wide and candidate gene association study of cigarette smoking behaviors. PLoS ONE. 2009;4:e4653. doi: 10.1371/journal.pone.0004653. [DOI] [PMC free article] [PubMed] [Google Scholar]
- 30.Thorgeirsson TE, et al. A variant associated with nicotine dependence, lung cancer and peripheral arterial disease. Nature. 2008;452:638–42. doi: 10.1038/nature06846. [DOI] [PMC free article] [PubMed] [Google Scholar]
- 31.Thomas DC. Re: “Case-parents design for gene-environment interaction” by Schaid. Genet Epidemiol. 2000;19:461–3. doi: 10.1002/1098-2272(200012)19:4<461::AID-GEPI16>3.0.CO;2-Y. [DOI] [PubMed] [Google Scholar]
- 32.Broeks A, et al. Identification of women with an increased risk of developing radiation-induced breast cancer: a case only study. Breast Cancer Res. 2007;9:R26. doi: 10.1186/bcr1668. [DOI] [PMC free article] [PubMed] [Google Scholar]
- 33.Albert PS, Ratnasinghe D, Tangrea J, Wacholder S. Limitations of the case-only design for identifying gene-environment interactions. Am J Epidemiol. 2001;154:687–93. doi: 10.1093/aje/154.8.687. [DOI] [PubMed] [Google Scholar]
- 34.Mukherjee B, et al. Tests for gene-environment interaction from case-control data: a novel study of type I error, power and designs. Genetic Epidemiology. 2008;32:615–626. doi: 10.1002/gepi.20337. [DOI] [PubMed] [Google Scholar]
- 35.Li D, Conti DV. Detecting gene-environment interactions using a combined case-only and case-control approach. Am J Epidemiol. 2009;169:497–504. doi: 10.1093/aje/kwn339. [DOI] [PMC free article] [PubMed] [Google Scholar]
- 36.Schaid D. Case-parents design for gene-environment interaction. Genet Epidemiol. 1999;16:261–273. doi: 10.1002/(SICI)1098-2272(1999)16:3<261::AID-GEPI3>3.0.CO;2-M. This paper introduced the use of the transmission-disequilibrium test stratified by the case's exposure as a way of testing for G×E interactions that is robust to population G-E association. [DOI] [PubMed] [Google Scholar]
- 37.Gauderman WJ, Witte JS, Thomas DC. Family-based association studies. J Natl Cancer Inst Monogr. 1999:31–7. doi: 10.1093/oxfordjournals.jncimonographs.a024223. [DOI] [PubMed] [Google Scholar]
- 38.Laird NM, Lange C. Family-based designs in the age of large-scale gene-association studies. Nat Genet. 2006;7:385–394. doi: 10.1038/nrg1839. A nice review of the various family-based designs for testing genetic main effects in the context of GWAS. [DOI] [PubMed] [Google Scholar]
- 39.Cui JS, et al. Regressive logistic and proportional hazards disease models for within-family analyses of measured genotypes, with application to a CYP17 polymorphism and breast cancer. Genetic Epidemiology. 2003;24:161–172. doi: 10.1002/gepi.10222. [DOI] [PubMed] [Google Scholar]
- 40.Boomsma D, Busjahn A, Peltonen L. Classical twin studies and beyond. Nat Rev Genet. 2002;3:872–82. doi: 10.1038/nrg932. [DOI] [PubMed] [Google Scholar]
- 41.Andrieu N, Demenais F. Interactions between genetic and reproductive factors in breast cancer risk in a French family sample. Am J Hum Genet. 1997;61:678–90. doi: 10.1086/515507. [DOI] [PMC free article] [PubMed] [Google Scholar]
- 42.Gauderman WJ, Faucett CL. Detection of gene-environment interactions in joint segregation and linkage analysis. Am J Hum Genet. 1997;61:1189–99. doi: 10.1086/301597. [DOI] [PMC free article] [PubMed] [Google Scholar]
- 43.Gauderman WJ, Siegmund KD. Gene-environment interaction and affected sib pair linkage analysis. Human Heredity. 2001;52:34–46. doi: 10.1159/000053352. [DOI] [PubMed] [Google Scholar]
- 44.Schaid DJ, Olson JM, Gauderman WJ, Elston RC. Regression models for linkage: issues of traits, covariates, heterogeneity, and interaction. Hum Hered. 2003;55:86–96. doi: 10.1159/000072313. [DOI] [PubMed] [Google Scholar]
- 45.White JE. A two stage design for the study of the relationship between a rare exposure and a rare disease. Am J Epidemiol. 1982;115:119–28. doi: 10.1093/oxfordjournals.aje.a113266. The paper that first introduced the idea of two-stage sampling in the epidemiologic context. [DOI] [PubMed] [Google Scholar]
- 46.Breslow NE, Chatterjee N. Design and analysis of two-phase studies with binary outcome applied to Wilms tumor prognosis. Appl Statist. 1999;48:457–68. Arguably the most accessible summary of a major series of papers on the design and analysis of two-phase case-control studies. [Google Scholar]
- 47.Li R, et al. Glutathione S-transferase genotype as a susceptibility factor in smoking-related coronary heart disease. Atherosclerosis. 2000;149:451–62. doi: 10.1016/s0021-9150(99)00483-9. [DOI] [PubMed] [Google Scholar]
- 48.Breslow NE, Lumley T, Ballantyne CM, Chambless LE, Kulich M. Using the whole cohort in the analysis of case-cohort data. Am J Epidemiol. 2009;169:1398–405. doi: 10.1093/aje/kwp055. An important contribution to the literature on two-phase case-control studies that emphasizes the value added by exploiting the information available on the entire cohort that is not used in standard analysis methods. [DOI] [PMC free article] [PubMed] [Google Scholar]
- 49.Bernstein JL, et al. Study design: evaluating gene-environment interactions in the etiology of breast cancer - the WECARE study. Breast Cancer Res. 2004;6:R199–214. doi: 10.1186/bcr771. This paper provides an overview of the design of the WECARE Study, with particular attention to the gain in power for testing gene-radiation interactions from using the counter-matched design. [DOI] [PMC free article] [PubMed] [Google Scholar]
- 50.Langholz B, Goldstein L. Risk set sampling in epidemiologic cohort studies. Statist Sci. 1996;11:35–53. This paper provides a non-technical discussion of countermatching and other cohort sampling designs, with numerous examples of applications to epidemiologic studies. [Google Scholar]
- 51.Andrieu N, Goldstein AM, Thomas DC, Langholz B. Counter-matching in studies of gene-environment interaction: efficiency and feasibility. American Journal of Epidemiology. 2001;153:265–74. doi: 10.1093/aje/153.3.265. [DOI] [PubMed] [Google Scholar]
- 52.Gilliland FD, McConnell R, Peters J, Gong H., Jr. A theoretical basis for investigating ambient air pollution and children's respiratory health. Environ Health Perspect. 1999;107:403–7. doi: 10.1289/ehp.99107s3403. This paper provides a superb overview of the biological rationale for focusing studies of air pollution and respiratory disease on genes and environmental modifiers involved in oxidative stress and inflammatory pathways. [DOI] [PMC free article] [PubMed] [Google Scholar]
- 53.Hoh J, Wille A, Ott J. Trimming, weighting, and grouping SNPs in human case-control association studies. Genome Research. 2001;11:2115–9. doi: 10.1101/gr.204001. [DOI] [PMC free article] [PubMed] [Google Scholar]
- 54.McKinney BA, Reif DM, Ritchie MD, Moore JH. Machine learning for detecting gene-gene interactions: a review. Appl Bioinformatics. 2006;5:77–88. doi: 10.2165/00822942-200605020-00002. [DOI] [PMC free article] [PubMed] [Google Scholar]
- 55.Moore JH, Williams SM. Epistasis and its implications for personal genetics. Am J Hum Genet. 2009;85:309–20. doi: 10.1016/j.ajhg.2009.08.006. [DOI] [PMC free article] [PubMed] [Google Scholar]
- 56.Ritchie MD, Motsinger AA. Multifactor dimensionality reduction for detecting gene-gene and gene-environment interactions in pharmacogenomics studies. Pharmacogenomics. 2005;6:823–34. doi: 10.2217/14622416.6.8.823. [DOI] [PubMed] [Google Scholar]
- 57.Le Marchand L, et al. Combined effects of well-done red meat, smoking, and rapid N-acetyltransferase 2 and CYP1A2 phenotypes in increasing colorectal cancer risk. Cancer Epidemiol Biomarkers Prev. 2001;10:1259–66. A classic example of an interaction involving two genes and two exposures for which none of the constituent lower-order main effects or interactions are significant. [PubMed] [Google Scholar]
- 58.Vineis P, et al. Current smoking, occupation, N-acetyltransferase-2 and bladder cancer: a pooled analysis of genotype-based studies. Cancer Epidemiol Biomarkers Prev. 2001;10:1249–52. [PubMed] [Google Scholar]
- 59.Thomas DC, et al. Approaches to complex pathways in molecular epidemiology: summary of an AACR special conference. Cancer Res. 2008;68:10028–30. doi: 10.1158/0008-5472.CAN-08-1690. [DOI] [PubMed] [Google Scholar]
- 60.Thomas DC. The need for a systematic approach to complex pathways in molecular epidemiology. Cancer Epidemiol Biomarkers Prev. 2005;14:557–9. doi: 10.1158/1055-9965.EPI-14-3-EDB. [DOI] [PubMed] [Google Scholar]
- 61.Subramanian A, et al. Gene set enrichment analysis: a knowledge-based approach for interpreting genome-wide expression profiles. Proc Natl Acad Sci U S A. 2005;102:15545–50. doi: 10.1073/pnas.0506580102. [DOI] [PMC free article] [PubMed] [Google Scholar]
- 62.Wang K, Li M, Bucan M. Pathway-based approaches for analysis of genomewide association studies. Am J Hum Genet. 2007;81:1278–83. doi: 10.1086/522374. [DOI] [PMC free article] [PubMed] [Google Scholar]
- 63.Hong MG, Pawitan Y, Magnusson PK, Prince JA. Strategies and issues in the detection of pathway enrichment in genome-wide association studies. Hum Genet. 2009;126:289–301. doi: 10.1007/s00439-009-0676-z. [DOI] [PMC free article] [PubMed] [Google Scholar]
- 64.Chasman DI. On the utility of gene set methods in genomewide association studies of quantitative traits. Genetic Epidemiology. 2008;32:658–668. doi: 10.1002/gepi.20334. This paper provides a clear discussion of the use of GSEA as a way of prioritizing hits from a GWAS and interpreting the ensemble of SNP associations in relation to pathways. [DOI] [PubMed] [Google Scholar]
- 65.Aragaki CC, Greenland S, Probst-Hensch N, Haile RW. Hierarchical modeling of gene-environment interactions: estimating NAT2 genotype-specific dietary effects on adenomatous polyps. Cancer Epidemiol Biomarkers Prev. 1997;6:307–14. [PubMed] [Google Scholar]
- 66.Wakefield J, De Vocht F, Hung RJ. Bayesian mixture modeling of gene-environment and gene-gene interactions. Genet Epidemiol. 2010;34:16–25. doi: 10.1002/gepi.20429. [DOI] [PMC free article] [PubMed] [Google Scholar]
- 67.Hung RJ, et al. Inherited predisposition of lung cancer: a hierarchical modeling approach to DNA repair and cell cycle control pathways. Cancer Epidemiol Biomarkers Prev. 2007;16:2736–44. doi: 10.1158/1055-9965.EPI-07-0494. [DOI] [PubMed] [Google Scholar]
- 68.Hung RJ, et al. Using hierarchical modeling in genetic association studies with multiple markers: application to a case-control study of bladder cancer. Cancer Epidemiol Biomarkers Prev. 2004;13:1013–21. One of the first examples of the use of hierarchical modeling for study of G×E interactions. A set of pathway indicator variables are used as prior covariates to classify specific combinations of genes and environmental exposures. [PubMed] [Google Scholar]
- 69.Conti DV, et al. Using ontologies in hierarchical modeling of genes and exposures in biologic pathways. In: Swan GE, editor. Phenotypes and Endophenotypes: Foundations for Genetic Studies of Nicotine Use and Dependence. NCI Tobacco Control Monographs; Bethesda, MD: 2009. pp. 539–84. [Google Scholar]
- 70.Wang L, Weinshilboum RM. Pharmacogenomics: candidate gene identification, functional validation and mechanisms. Hum Mol Genet. 2008;17:R174–9. doi: 10.1093/hmg/ddn270. [DOI] [PMC free article] [PubMed] [Google Scholar]
- 71.Rebbeck TR, Spitz M, Wu X. Assessing the function of genetic variants in candidate gene association studies. Nat Rev Genet. 2004;5:589–97. doi: 10.1038/nrg1403. An excellent discussion of ways of interpreting candidate gene associations in relation to biological function inferred from various external sources of information or programs to compute predicted function of polymorphisms. [DOI] [PubMed] [Google Scholar]
- 72.Ulrich CM, et al. Mathematical modeling of folate metabolism: predicted effects of genetic polymorphisms on mechanisms and biomarkers relevant to carcinogenesis. Cancer Epidemiol Biomarkers Prev. 2008;17:1822–31. doi: 10.1158/1055-9965.EPI-07-2937. One of a long series of papers on mathematical modeling of the folate pathway, this one focuses specifically on the use of their model to predict the effects of variation in metabolic rate parameters for polymorphisms in specific genes on various outcomes, such as homocysteine concentration or DNA methylation reactions. [DOI] [PMC free article] [PubMed] [Google Scholar]
- 73.Thomas DC, et al. Use of pathway information in molecular epidemiology. Hum Genomics. 2010;4:21–42. doi: 10.1186/1479-7364-4-1-21. [DOI] [PMC free article] [PubMed] [Google Scholar]
- 74.Armitage P, Doll R. The age distribution of cancer and a multistage theory of carcinogenesis. Br J Cancer. 1954;8:1–12. doi: 10.1038/bjc.1954.1. [DOI] [PMC free article] [PubMed] [Google Scholar]
- 75.Moolgavkar S, Knudson A. Mutation and cancer: a model for human carcinogenesis. JNCI. 1981;66:1037–1052. doi: 10.1093/jnci/66.6.1037. [DOI] [PubMed] [Google Scholar]
- 76.Racine-Poon A, Wakefield J. Statistical methods for population pharmacokinetic modelling. Stat Methods Med Res. 1998;7:63–84. doi: 10.1177/096228029800700106. [DOI] [PubMed] [Google Scholar]
- 77.Clewell HJ, Andersen ME, Barton HA. A consistent approach for the application of pharmacokinetic modeling in cancer and noncancer risk assessment. Environ Health Persp. 2002;110:85–93. doi: 10.1289/ehp.0211085. [DOI] [PMC free article] [PubMed] [Google Scholar]
- 78.Bois FY. Applications of population approaches in toxicology. Toxicol Lett. 2001;120:385–94. doi: 10.1016/s0378-4274(01)00270-3. [DOI] [PubMed] [Google Scholar]
- 79.Nijhout HF, Reed MC, Ulrich CM. Mathematical models of folate-mediated one-carbon metabolism. Vitam Horm. 2008;79:45–82. doi: 10.1016/S0083-6729(08)00402-0. [DOI] [PubMed] [Google Scholar]
- 80.Bergman RN, et al. Minimal model-based insulin sensitivity has greater heritability and a different genetic basis than homeostasis model assessment or fasting insulin. Diabetes. 2003;52:2168–74. doi: 10.2337/diabetes.52.8.2168. [DOI] [PubMed] [Google Scholar]
- 81.Cascorbi I. Genetic basis of toxic reactions to drugs and chemicals. Toxicol Lett. 2006;162:16–28. doi: 10.1016/j.toxlet.2005.10.015. [DOI] [PubMed] [Google Scholar]
- 82.Cortessis V, Thomas DC. Toxicokinetic genetics: An approach to gene-environment and gene-gene interactions in complex metabolic pathways. In: Bird P, Boffetta P, Buffler P, Rice J, editors. Mechanistic considerations in the molecular epidemiology of cancer. IARC Scientific Publications #157; Lyon, France: 2003. pp. 127–150. [PubMed] [Google Scholar]
- 83.Thomas DC. Multistage sampling for latent variable models. Lifetime Data Anal. 2007;13:565–81. doi: 10.1007/s10985-007-9061-1. [DOI] [PubMed] [Google Scholar]
- 84.Didelez V, Sheehan N. Mendelian randomization as an instrumental variable approach to causal inference. Stat Methods Med Res. 2007;16:309–30. doi: 10.1177/0962280206077743. [DOI] [PubMed] [Google Scholar]
- 85.Davey Smith G, Ebrahim S. ‘Mendelian randomization’: can genetic epidemiology contribute to understanding environmental determinants of disease? Int. J. Epidemiol. 2003;32:1–22. doi: 10.1093/ije/dyg070. [DOI] [PubMed] [Google Scholar]
- 86.Greenland S. An introduction to instrumental variables for epidemiologists. Int J Epidemiol. 2000;29:1102. doi: 10.1093/oxfordjournals.ije.a019909. [DOI] [PubMed] [Google Scholar]
- 87.Dai JY, LeBlanc M, Kooperberg C. Semiparametric estimation exploiting covariate independence in two-phase randomized trials. Biometrics. 2009;65:178–87. doi: 10.1111/j.1541-0420.2008.01046.x. [DOI] [PMC free article] [PubMed] [Google Scholar]
- 88.McCarthy MI, et al. Genome-wide association studies for complex traits: consensus, uncertainty and challenges. Nat Rev Genet. 2008;9:356–69. doi: 10.1038/nrg2344. [DOI] [PubMed] [Google Scholar]
- 89.Altshuler D, Daly MJ, Lander ES. Genetic mapping in human disease. Science. 2008;322:881–8. doi: 10.1126/science.1156409. [DOI] [PMC free article] [PubMed] [Google Scholar]
- 90.Satagopan JM, Verbel DA, Venkatraman ES, Offit KE, Begg CB. Two-stage designs for gene-disease association studies. Biometrics. 2002;58:163–70. doi: 10.1111/j.0006-341x.2002.00163.x. [DOI] [PMC free article] [PubMed] [Google Scholar]
- 91.Wang H, Thomas DC, Pe'er I, Stram DO. Optimal two-stage genotyping designs for genome-wide association scans. Genet Epidemiol. 2006;30:356–368. doi: 10.1002/gepi.20150. [DOI] [PubMed] [Google Scholar]
- 92.Skol AD, Scott LJ, Abecasis GR, Boehnke M. Optimal designs for two-stage genome-wide association studies. Genet Epidemiol. 2007;31:776–88. doi: 10.1002/gepi.20240. [DOI] [PubMed] [Google Scholar]
- 93.Elston RC, Lin D, Zheng G. Multistage sampling for genetic studies. Annu Rev Genomics Hum Genet. 2007;8:327–42. doi: 10.1146/annurev.genom.8.080706.092357. [DOI] [PubMed] [Google Scholar]
- 94.Thomas DC, et al. Methodological issues in multistage genome-wide association studies. Statist Sci. 2010;25 doi: 10.1214/09-sts288. Epub: http://www.imstat.org/sts/future_papers.html. [DOI] [PMC free article] [PubMed]
- 95.Kooperberg C, Leblanc M. Increasing the power of identifying gene x gene interactions in genome-wide association studies. Genet Epidemiol. 2008;32:255–63. doi: 10.1002/gepi.20300. [DOI] [PMC free article] [PubMed] [Google Scholar]
- 96.Marchini J, Donnelly P, Cardon LR. Genome-wide strategies for detecting multiple loci that influence complex diseases. Nat Genet. 2005;37:413–7. doi: 10.1038/ng1537. [DOI] [PubMed] [Google Scholar]
- 97.Evans DM, Marchini J, Morris AP, Cardon LR. Two-stage two-locus models in genome-wide association. PLoS Genet. 2006;2:e157. doi: 10.1371/journal.pgen.0020157. [DOI] [PMC free article] [PubMed] [Google Scholar]
- 98.Umbach DM, Weinberg CR. Designing and analysing case-control studies to exploit independence of genotype and exposure. Stat Med. 1997;16:1731–43. doi: 10.1002/(sici)1097-0258(19970815)16:15<1731::aid-sim595>3.0.co;2-s. [DOI] [PubMed] [Google Scholar]
- 99.Murcray CE, Lewinger JP, Gauderman WJ. Gene-environment interaction in genome-wide association studies. Am J Epidemiol. 2009;169:219–26. doi: 10.1093/aje/kwn353. [DOI] [PMC free article] [PubMed] [Google Scholar]
- 100.Pearson JV, et al. Identification of the genetic basis for complex disorders by use of pooling-based genomewide single-nucleotide-polymorphism association studies. Am J Hum Genet. 2007;80:126–139. doi: 10.1086/510686. [DOI] [PMC free article] [PubMed] [Google Scholar]
- 101.Craig DW, et al. Identification of genetic variants using bar-coded multiplexed sequencing. Nat Methods. 2008;5:887–93. doi: 10.1038/nmeth.1251. [DOI] [PMC free article] [PubMed] [Google Scholar]
- 102.Sham P, Bader JS, Craig I, O'Donovan M, Owen M. DNA Pooling: a tool for large-scale association studies. Nature Reviews Genetics. 2002;3:862–71. doi: 10.1038/nrg930. [DOI] [PubMed] [Google Scholar]
- 103.Cantor RM, Lange K, Sinsheimer JS. Prioritizing GWAS results: A review of statistical methods and recommendations for their application. Am J Hum Genet. 2010;86:6–22. doi: 10.1016/j.ajhg.2009.11.017. [DOI] [PMC free article] [PubMed] [Google Scholar]
- 104.Roeder K, Devlin B, Wasserman L. Improving power in genome-wide association studies: weights tip the scale. Genet Epidemiol. 2007;31:741–7. doi: 10.1002/gepi.20237. [DOI] [PubMed] [Google Scholar]
- 105.Whittemore AS. A Bayesian false discovery rate for multiple testing. J Appl Statist. 2007;34:1–9. [Google Scholar]
- 106.Wakefield J. A Bayesian measure of the probability of false discovery in genetic epidemiology studies. Am J Hum Genet. 2007;81:208–27. doi: 10.1086/519024. [DOI] [PMC free article] [PubMed] [Google Scholar]
- 107.Wakefield J. Reporting and interpretation in genome-wide association studies. Int J Epidemiol. 2008;37:641–53. doi: 10.1093/ije/dym257. [DOI] [PubMed] [Google Scholar]
- 108.Datta S. Empirical Bayes screening of many p-values with applications to microarray studies. Bioinformatics. 2005;21:1987–94. doi: 10.1093/bioinformatics/bti301. [DOI] [PubMed] [Google Scholar]
- 109.Chen GK, Witte JS. Enriching the analysis of genomewide association studies with hierarchical modeling. Am J Hum Genet. 2007;81:397–404. doi: 10.1086/519794. [DOI] [PMC free article] [PubMed] [Google Scholar]
- 110.Lewinger JP, Conti DV, Baurley JW, Triche TJ, Thomas DC. Hierarchical Bayes prioritization of marker associations from a genome-wide association scan for further investigation. Genet Epidemiol. 2007;31:871–82. doi: 10.1002/gepi.20248. [DOI] [PubMed] [Google Scholar]
- 111.Binder H, Schumacher M. Incorporating pathway information into boosting estimation of high-dimensional risk prediction models. BMC Bioinformatics. 2009;10:18. doi: 10.1186/1471-2105-10-18. [DOI] [PMC free article] [PubMed] [Google Scholar]
- 112.Holden M, Deng S, Wojnowski L, Kulle B. GSEA-SNP: applying gene set enrichment analysis to SNP data from genome-wide association studies. Bioinformatics. 2008;24:2784–5. doi: 10.1093/bioinformatics/btn516. [DOI] [PubMed] [Google Scholar]
- 113.Elbers CC, et al. Using genome-wide pathway analysis to unravel the etiology of complex diseases. Genet Epidemiol. 2009;33:419–31. doi: 10.1002/gepi.20395. [DOI] [PubMed] [Google Scholar]
- 114.Baranzini SE, et al. Pathway and network-based analysis of genome-wide association studies in multiple sclerosis. Hum Mol Genet. 2009;18:2078–90. doi: 10.1093/hmg/ddp120. [DOI] [PMC free article] [PubMed] [Google Scholar]
- 115.Torkamani A, Topol EJ, Schork NJ. Pathway analysis of seven common diseases assessed by genome-wide association. Genomics. 2008;92:265–72. doi: 10.1016/j.ygeno.2008.07.011. [DOI] [PMC free article] [PubMed] [Google Scholar]
- 116.Lesnick TG, et al. A genomic pathway approach to a complex disease: axon guidance and Parkinson disease. PLoS Genet. 2007;3:e98. doi: 10.1371/journal.pgen.0030098. [DOI] [PMC free article] [PubMed] [Google Scholar]
- 117.Thomas PD, et al. A systems biology network model for genetic association studies of nicotine addiction and treatment. Pharmacogenet Genomics. 2009;19:538–551. doi: 10.1097/FPC.0b013e32832e2ced. [DOI] [PMC free article] [PubMed] [Google Scholar]
- 118.Gieger C, et al. Genetics meets metabolomics: a genome-wide association study of metabolite profiles in human serum. PLoS Genet. 2008;4:e1000282. doi: 10.1371/journal.pgen.1000282. [DOI] [PMC free article] [PubMed] [Google Scholar]
- 119.Friedman N. Inferring cellular networks using probabilistic graphical models. Science. 2004;303:799–805. doi: 10.1126/science.1094068. An important paper that popularized the use of Bayesian network analysis for reconstruction of gene networks from gene co-expression data. [DOI] [PubMed] [Google Scholar]
- 120.Ramoni RB, Saccone NL, Hatsukami DK, Bierut LJ, Ramoni MF. A Testable Prognostic Model of Nicotine Dependence. J Neurogenet. 2009;23:283–92. doi: 10.1080/01677060802572911. [DOI] [PMC free article] [PubMed] [Google Scholar]
- 121.Ferrazzi F, Sebastiani P, Ramoni MF, Bellazzi R. Bayesian approaches to reverse engineer cellular systems: a simulation study on nonlinear Gaussian networks. BMC Bioinformatics. 2007;8(Suppl 5):S2. doi: 10.1186/1471-2105-8-S5-S2. [DOI] [PMC free article] [PubMed] [Google Scholar]
- 122.Kohler S, Bauer S, Horn D, Robinson PN. Walking the interactome for prioritization of candidate disease genes. Am J Hum Genet. 2008;82:949–58. doi: 10.1016/j.ajhg.2008.02.013. [DOI] [PMC free article] [PubMed] [Google Scholar]
- 123.Koch LG, Britton SL. Development of animal models to test the fundamental basis of gene-environment interactions. Obesity (Silver Spring) 2008;16(Suppl 3):S28–32. doi: 10.1038/oby.2008.513. [DOI] [PMC free article] [PubMed] [Google Scholar]
- 124.Gilliland FD, Li YF, Saxon A, Diaz-Sanchez D. Effect of glutathione-S-transferase M1 and P1 genotypes on xenobiotic enhancement of allergic responses: randomised, placebo-controlled crossover study. Lancet. 2004;363:119–25. doi: 10.1016/S0140-6736(03)15262-2. An excellent example of the use of experimental designs for investigating G×E interactions, in this case a randomized cross-over challenge study of immunologic responses to diesel exhaust particles in allergic subjects. [DOI] [PubMed] [Google Scholar]
- 125.Thomas DC, Conti DV. Two stage genetic association studies. In: D'Agostino R, Sullivan L, Massaro J, editors. Encyclopedia of Clinical Trials. Wiley; New York: 2007. [Google Scholar]
- 126.Israel E, et al. Use of regularly scheduled albuterol treatment in asthma: genotype-stratified, randomised, placebo-controlled cross-over trial. Lancet. 2004;364:1505–12. doi: 10.1016/S0140-6736(04)17273-5. [DOI] [PubMed] [Google Scholar]
- 127.Davis BR, et al. Imputing gene-treatment interactions when the genotype distribution is unknown using case-only and putative placebo analyses--a new method for the Genetics of Hypertension Associated Treatment (GenHAT) study. Stat Med. 2004;23:2413–27. doi: 10.1002/sim.1831. [DOI] [PubMed] [Google Scholar]
- 128.Vittinghoff E, Bauer DC. Case-only analysis of treatment-covariate interactions in clinical trials. Biometrics. 2006;62:769–76. doi: 10.1111/j.1541-0420.2006.00511.x. [DOI] [PubMed] [Google Scholar]
- 129.Lin BK, et al. Tracking the epidemiology of human genes in the literature: the HuGE Published Literature database. Am J Epidemiol. 2006;164:1–4. doi: 10.1093/aje/kwj175. [DOI] [PubMed] [Google Scholar]
- 130.Khoury MJ, Little J. Human genome epidemiologic reviews: the beginning of something HuGE. Am J Epidemiol. 2000;151:2–3. doi: 10.1093/oxfordjournals.aje.a010117. [DOI] [PubMed] [Google Scholar]
- 131.Yesupriya A, et al. Reporting of human genome epidemiology (HuGE) association studies: an empirical assessment. BMC Med Res Methodol. 2008;8:31. doi: 10.1186/1471-2288-8-31. [DOI] [PMC free article] [PubMed] [Google Scholar]
- 132.Jensen LJ, Saric J, Bork P. Literature mining for the biologist: from information retrieval to biological discovery. Nat Rev Genet. 2006;7:119–29. doi: 10.1038/nrg1768. [DOI] [PubMed] [Google Scholar]
- 133.Raychaudhuri S, et al. Identifying relationships among genomic disease regions: predicting genes at pathogenic SNP associations and rare deletions. PLoS Genet. 2009;5:e1000534. doi: 10.1371/journal.pgen.1000534. [DOI] [PMC free article] [PubMed] [Google Scholar]
- 134.Gene_Ontology_Consortium The Gene Ontology (GO) project in 2006. Nucleic Acids Res. 2006;34:D322–6. doi: 10.1093/nar/gkj021. [DOI] [PMC free article] [PubMed] [Google Scholar]
- 135.Kanehisa M, et al. KEGG for linking genomes to life and the environment. Nucleic Acids Res. 2008;36:D480–4. doi: 10.1093/nar/gkm882. [DOI] [PMC free article] [PubMed] [Google Scholar]
- 136.Thomas PD, et al. PANTHER: A Library of Protein Families and Subfamilies Indexed by Function. Genome Res. 2003;13:2129–2141. doi: 10.1101/gr.772403. [DOI] [PMC free article] [PubMed] [Google Scholar]
- 137.Miller RL, Ho SM. Environmental epigenetics and asthma: current concepts and call for studies. Am J Respir Crit Care Med. 2008;177:567–73. doi: 10.1164/rccm.200710-1511PP. [DOI] [PMC free article] [PubMed] [Google Scholar]
- 138.Salk JJ, Fox EJ, Loeb LA. Mutational heterogeneity in human cancers: origin and consequences. Annu Rev Pathol. 2010;5:51–75. doi: 10.1146/annurev-pathol-121808-102113. [DOI] [PMC free article] [PubMed] [Google Scholar]
- 139.Zeisel SH. Epigenetic mechanisms for nutrition determinants of later health outcomes. Am J Clin Nutr. 2009;89:1488S–1493S. doi: 10.3945/ajcn.2009.27113B. [DOI] [PMC free article] [PubMed] [Google Scholar]
- 140.Perera F, et al. Relation of DNA Methylation of 5′-CpG Island of ACSL3 to Transplacental Exposure to Airborne Polycyclic Aromatic Hydrocarbons and Childhood Asthma. PLoS ONE. 2009;4:e4488. doi: 10.1371/journal.pone.0004488. [DOI] [PMC free article] [PubMed] [Google Scholar]
- 141.Baccarelli A, et al. Rapid DNA methylation changes after exposure to traffic particles. Am J Respir Crit Care Med. 2009;179:572–8. doi: 10.1164/rccm.200807-1097OC. [DOI] [PMC free article] [PubMed] [Google Scholar]
- 142.Fraga MF, et al. Epigenetic differences arise during the lifetime of monozygotic twins. Proc Natl Acad Sci U S A. 2005;102:10604–9. doi: 10.1073/pnas.0500398102. [DOI] [PMC free article] [PubMed] [Google Scholar]
- 143.Stranger BE, et al. Genome-wide associations of gene expression variation in humans. PLoS Genet. 2005;1:e78. doi: 10.1371/journal.pgen.0010078. [DOI] [PMC free article] [PubMed] [Google Scholar]
- 144.Manolio TA, et al. Finding the missing heritability of complex diseases. Nature. 2009;461:747–53. doi: 10.1038/nature08494. [DOI] [PMC free article] [PubMed] [Google Scholar]
- 145.Zhu X, Feng T, Li Y, Lu Q, Elston RC. Detecting rare variants for complex traits using family and unrelated data. Genet Epidemiol. 2010;34:171–87. doi: 10.1002/gepi.20449. [DOI] [PMC free article] [PubMed] [Google Scholar]
- 146.Siva N. 1000 Genomes project. Nat Biotechnol. 2008;26:256. doi: 10.1038/nbt0308-256b. [DOI] [PubMed] [Google Scholar]
- 147.Cullen AC, Corrales MA, Kramer CB, Faustman EM. The application of genetic information for regulatory standard setting under the clean air act: a decision-analytic approach. Risk Anal. 2008;28:877–90. doi: 10.1111/j.1539-6924.2008.01084.x. [DOI] [PubMed] [Google Scholar]
- 148.Shostak S. Locating gene-environment interaction: at the intersections of genetics and public health. Soc Sci Med. 2003;56:2327–42. doi: 10.1016/s0277-9536(02)00231-9. [DOI] [PubMed] [Google Scholar]
- 149.Need AC, Motulsky AG, Goldstein DB. Priorities and standards in pharmacogenetic research. Nat Genet. 2005;37:671–81. doi: 10.1038/ng1593. [DOI] [PubMed] [Google Scholar]
- 150.Lave LB, Omenn GS. Clearing the air: reforming the Clean Air Act. The Brookings Institution; Washington, D.C.: 1981. [Google Scholar]
- 151.Rose G. The strategy of preventive medicine. Oxford University Press; Oxford: 1992. [Google Scholar]
- 152.Bernstein JL, et al. Radiation-induced second primary breast cancer and BRCA1 and BRCA2 mutation carrier status: A report from the WECARE Study. JNCI. 2010 in press. [Google Scholar]
- 153.Perera FP. Molecular epidemiology: on the path to prevention? J Natl Cancer Inst. 2000;92:602–12. doi: 10.1093/jnci/92.8.602. [DOI] [PubMed] [Google Scholar]
- 154.Feng D, et al. Platelet glycoprotein IIIa Pl(a) polymorphism, fibrinogen, and platelet aggregability: The Framingham Heart Study. Circulation. 2001;104:140–4. doi: 10.1161/01.cir.104.2.140. [DOI] [PubMed] [Google Scholar]
- 155.He C, Tamimi RM, Hankinson SE, Hunter DJ, Han J. A prospective study of genetic polymorphism in MPO, antioxidant status, and breast cancer risk. Breast Cancer Res Treat. 2009;113:585–94. doi: 10.1007/s10549-008-9962-z. [DOI] [PMC free article] [PubMed] [Google Scholar]
- 156.Bureau A, Diallo MS, Ordovas JM, Cupples LA. Estimating interaction between genetic and environmental risk factors: efficiency of sampling designs within a cohort. Epidemiology. 2008;19:83–93. doi: 10.1097/EDE.0b013e31815c4d0e. [DOI] [PubMed] [Google Scholar]
- 157.Jugessur A, et al. Cleft palate, transforming growth factor alpha gene variants, and maternal exposures: assessing gene-environment interactions in case-parent triads. Genet Epidemiol. 2003;25:367–74. doi: 10.1002/gepi.10268. [DOI] [PubMed] [Google Scholar]
- 158.Mayer EJ, et al. Genetic and environmental influences on insulin levels and the insulin resistance syndrome: an analysis of women twins. Am J Epidemiol. 1996;143:323–32. doi: 10.1093/oxfordjournals.aje.a008746. [DOI] [PubMed] [Google Scholar]
- 159.Bernstein JL, et al. Radiation exposure, the ATM gene, and risk of bilateral breast cancer in the WECARE study. JNCI. 2010 in press. [Google Scholar]
- 160.Gilliland FD, et al. Effects of glutathione S-transferase M1, maternal smoking during pregnancy, and environmental tobacco smoke on asthma and wheezing in children. American Journal of Respiratory & Critical Care Medicine. 2002;166:457–63. doi: 10.1164/rccm.2112064. [DOI] [PubMed] [Google Scholar]
- 161.Martinez FD. Gene-environment interactions in asthma: with apologies to William of Ockham. Proc Am Thorac Soc. 2007;4:26–31. doi: 10.1513/pats.200607-144JG. [DOI] [PMC free article] [PubMed] [Google Scholar]
- 162.Gianfagna F, De Feo E, van Duijn CM, Ricciardi G, Boccia S. A systematic review of meta-analyses on gene polymorphisms and gastric cancer risk. Curr Genomics. 2008;9:361–74. doi: 10.2174/138920208785699544. [DOI] [PMC free article] [PubMed] [Google Scholar]
- 163.Siemiatycki J, Thomas DC. Biological models and statistical interactions: an example from multistage carcinogenesis. Int J Epidemiol. 1981;10:383–387. doi: 10.1093/ije/10.4.383. [DOI] [PubMed] [Google Scholar]
- 164.Greenland S. Interactions in epidemiology: relevance, identification, and estimation. Epidemiology. 2009;20:14–7. doi: 10.1097/EDE.0b013e318193e7b5. [DOI] [PubMed] [Google Scholar]
- 165.Haldane JBS. Heredity and Politics. W.W. Norton; New York: 1938. [Google Scholar]
- 166.Ottman R. An epidemiologic approach to gene-environment interaction. Genetic Epidemiology. 1990;7:177–85. doi: 10.1002/gepi.1370070302. This is one of the first and still most widely quoted papers to offer a classification of different types of G×E interactions, with classic examples of each type. [DOI] [PMC free article] [PubMed] [Google Scholar]
- 167.Lewontin RC. Annotation: the analysis of variance and the analysis of causes. Am J Hum Genet. 1974;26:400–11. [PMC free article] [PubMed] [Google Scholar]
- 168.Garcia-Closas M, et al. NAT2 slow acetylation, GSTM1 null genotype, and risk of bladder cancer: results from the Spanish Bladder Cancer Study and meta-analyses. Lancet. 2005;366:649–59. doi: 10.1016/S0140-6736(05)67137-1. [DOI] [PMC free article] [PubMed] [Google Scholar]
- 169.Dearfield KL, Benson WH, Gallagher K, Johnson JD. Addressing genomic needs at the U.S. Environmental Protection Agency. In: Sharp RR, editor. Genomics and Environmental Regulation: Science, Ethics, and Law. Johns Hopkins University Press; Baltimore, MD: 2009. [Google Scholar]
- 170.Lympany PA, et al. HLA-DPB polymorphisms: Glu 69 association with sarcoidosis. Eur J Immunogenet. 1996;23:353–9. doi: 10.1111/j.1744-313x.1996.tb00008.x. [DOI] [PubMed] [Google Scholar]
- 171.Jacobi CE, Nagelkerke NJ, van Houwelingen JH, de Bock GH. Breast cancer screening, outside the population-screening program, of women from breast cancer families without proven BRCA1/BRCA2 mutations: a simulation study. Cancer Epidemiol Biomarkers Prev. 2006;15:429–36. doi: 10.1158/1055-9965.EPI-05-0223. [DOI] [PubMed] [Google Scholar]
- 172.Ulrich CM, Potter JD. Folate supplementation: too much of a good thing? Cancer Epidemiol Biomarkers Prev. 2006;15:189–93. doi: 10.1158/1055-9965.EPI-152CO. [DOI] [PubMed] [Google Scholar]
Associated Data
This section collects any data citations, data availability statements, or supplementary materials included in this article.