

To date, this study is the most complete characterization of the composition, selectivity, and permeability of human RPE tight junctions and how they may be affected by VEGF and drugs commonly used to treat age-related macular degeneration.
Abstract
Purpose.
Bevacizumab and ranibizumab are currently used to treat age-related macular degeneration by neutralizing vascular endothelial growth factor (VEGF). In this study, the potential side effects on the outer blood–retinal barrier were examined.
Methods.
Human fetal RPE (hfRPE) cells were used because they are highly differentiated in culture. The claudin composition of RPE tight junctions was determined by RT-PCR, immunoblot analysis, and immunofluorescence. ELISA assays monitored the secretion and trafficking of VEGF and a fluid-phase marker, methylpolyethylene glycol (mPEG). Tight junction functions were assessed by the conductance of K+ and Na+ (derived from the transepithelial electrical resistance, TER) and the flux of NaCl and mPEG.
Results.
Claudin-3, claudin-10, and claudin-19 were detected in RPE tight junctions. VEGF was secreted in equal amounts across the apical and basolateral membranes, but the apical membrane was more active in endocytosing and degrading VEGF. Exogenous VEGF and mPEG crossed the RPE monolayer by transcytosis, predominantly in the apical-to-basal direction. RPE tight junctions were selective for K+, but did not discriminate between Na+ and Cl−. VEGF, bevacizumab, and ranibizumab had minimal effects on TER, permeation of mPEG, and selectivity for K+, Na+, and Cl−. They had minimal effects on the expression and distribution of the claudins.
Conclusions.
RPE has mechanisms for maintaining low concentrations of VEGF in the subretinal space that include endocytosis and degradation and fluid-phase transcytosis in the apical-to-basal direction. RPE tight junctions are selective for K+ over Na+ and Cl−. Permeability and selectivity of the junctions are not affected by VEGF, bevacizumab, or ranibizumab.
Age-related macular degeneration (AMD) is a leading cause of impaired vision in the aging population of developed countries.1,2 It is associated with choroidal neovascular (CNV) membrane, macular edema, and atrophy of the retinal pigment epithelium (RPE), and photoreceptors.3,4 The molecular and cellular mechanisms underlying AMD and CNV are unclear, but many studies implicate vascular endothelial growth factor (VEGF).5–8 Normally, VEGF is secreted by RPE, a monolayer that separates the choroidal blood supply from the neural retina. The VEGF induces the formation of fenestrae in the choroidal endothelium, which makes them leaky.9,10 Consequently, it remains for the RPE to form the outer blood–retinal barrier. In wet AMD, concentrations of VEGF are high, and choroidal blood vessels grow through Bruch's membrane, disrupt the RPE, and enter the subretinal space. These neovascular membranes lack the tight barriers that are characteristic of normal retinal blood vessels, and fluid leaks into the retina and the subretinal space causing macular edema and subretinal fluid accumulation. The effects of VEGF on RPE have not been established, as results in culture studies have been contradictory. It is unclear whether VEGF makes the RPE barrier tighter or leakier and which VEGF receptor may be involved.11–15
The dynamic barrier formed by the RPE actively maintains the environment of the photoreceptors by absorbing fluid from the subretinal space and regulating the space's volume and ionic composition. In this way, the RPE prevents macular edema or exudative retinal detachment. The barrier is a collaboration of membrane pumps and channels that mediate transcellular transport and the tight junctions that regulate transepithelial diffusion through the paracellular spaces.16,17 The pumps and channels of the plasma membrane create electrochemical gradients across the RPE monolayer. Using the spaces between the cells of the monolayer, solutes would diffuse these gradients, except for a circumferential band of tight junctions. Tight junctions bind neighboring cells together and selectively retard the diffusion of some solutes more than others.
The selectivity of tight junctions is tissue-specific and essential for function.18 For example, the RPE actively transports Cl− from the apical to the basal side and creates a transepithelial electrical potential that is positive on the apical side. By using the energy from this gradient, cations and water also move from the apical to the basal side. Were RPE tight junctions leakier to Cl− than cations, this transcellular Cl− pump would be short circuited, fluid absorption would be reduced, and subretinal fluid accumulation would lead to retinal detachment.19 The selectivity of tight junctions is determined by a family of transmembrane proteins, the claudins. Each epithelium expresses a subset of the claudins.17 By regulating their expression and subcellular distribution, the permeability and selectivity of tight junctions can be regulated on a physiologic time scale.20,21 The loss of claudin 19 in RPE causes severe visual impairment.22 In renal cells, claudin 19 decreases the Cl− flux across tight junctions. It is unclear which additional claudins interact with claudin 19. Although claudin expression has been examined in ARPE19 cells, expression was thought to be dependent on culture conditions and the passage number of the culture.23,24 This variability may explain the conflicting reports on the effects of VEGF on RPE tight junctions.11–15,24
Recent therapeutic approaches to AMD involve blocking the action of VEGF with humanized monoclonal antibodies such as bevacizumab (Avastin; Hoffman-LaRoche, Nutley, NJ) or ranibizumab (Lucentis, Genentech, South San Francisco, CA). The intention of these therapies is to reduce the source of retinal edema by countering the effects of VEGF on endothelia, but it is unclear whether they have undesired effects on the RPE. These anti-VEGF drugs have reduced or eliminated macular edema with significant improvement of vision and have led to better long-term results.25 Ranibizumab was approved for treatment of AMD by the U.S. Food and Drug Administration, and bevacizumab continues to be used off label. So far, most studies report no or few side effects. In electrophysiological studies, no negative side effects were seen in the retina. In contrast, the results showed a recovery effect on photoreceptors, even at the site of the CNV.26 Nevertheless, there is an important role for endogenous VEGF in the maintenance and function of adult retinal neuronal cells, which suggests that anti-VEGF therapies should be administered with caution.27 Further, these drugs have been found to cross the RPE and affect the fenestrations of the choriocapillaris in primates.28,29
In the present study, we examined the effects of VEGF, bevacizumab, and ranibizumab on the tight junctions of human fetal RPE (hfRPE). These cultures exhibited robust, functional tight junctions and selectively removed VEGF from the apical (subretinal) milieu. They expressed the tight junctional proteins normally expressed in native, human RPE, which made it possible to determine the selectivity of the human RPE tight junctions. VEGF and its neutralizing agents had minimal effects on these properties.
Methods
Cell Culture Model
The research adhered to the tenets of the Declaration of Helsinki and the guidelines of the NIH Institutional Review Board. The secondary cultures of human fetal RPE cells were supplied by the laboratory of Sheldon Miller (National Eye Institute, Bethesda, MD). The hfRPE cells were trypsinized in 0.25% trypsin-EDTA for 10 minutes and this trypsinization was repeated three times. The cells were then resuspended in 15% serum-containing hfRPE cell culture medium. The suspensions were centrifuged for 10 minutes at 500 rpm. The serum culture medium consisted of MEM α-modified medium (Sigma-Aldrich, St. Louis, MO). Fetal bovine serum (Atlanta Biologicals, Norcross, GA), N1 supplement (1:100 mL/mL; Sigma-Aldrich), glutamine-penicillin-streptomycin (1:100 mL/mL; Sigma-Aldrich), 25 μg/mL nystatin, nonessential amino acid solution (1:100 mL/mL; Sigma-Aldrich), and hydrocortisone (20 μg/L), taurine (250 mg/L), and triiodo-thyronin (0.013 μg/L). Cells were seeded onto clear cell culture inserts at 1.3 × 10⁵ per well (12-mm diameter inserts, 0.4-μm pores, polyester membranes; Transwell; Corning Costar, Corning, NY). Before they were seeded, the wells were coated with human extracellular matrix (10 μg in 150 μL HBSS per well, cat. no. 354237; BD Biosciences, Franklin Lakes, NJ) and cured with UV light in a hood for 2 hours. The medium in the apical chamber and the basolateral chamber were 0.5 and 1.5 mL, respectively. The cultures were maintained at 37°C in a humidified atmosphere of 95% air/5% CO2. After 24 hours, the medium was replaced, and the cells were fed three times per week. The cells reached confluence in 2 to 3 days, but the TER continued to rise over the next 6 to 8 weeks. Experiments were not performed until the TER became stable.
Reverse Transcription–Polymerase Chain Reaction
RT-PCR was performed with a slight modification of the procedure we used earlier for human claudins.24 Briefly, total RNA was isolated for RT-PCR (RNeasy Mini kit; Qiagen, Inc., Valencia, CA) according to the manufacturer's protocol. RNA (0.15 μg) was amplified with the primers listed in Table 1 for 32 cycles of PCR (Minicycler PTC-150; MJ Research Inc., Watertown, MA). The reaction products were resolved by agarose gel electrophoresis, stained with ethidium bromide (Molecular Probes Inc., Eugene, OR), and imaged (Molecular Imager ChemiDoc XRS System; Bio-Rad, Hercules, CA).
Table 1.
Primers Used for RT-PCR
| Gene | Upstream | Downstream | Location | Size (bp) |
|---|---|---|---|---|
| Claudin 1 | CTGCCCCAGTGGAGGATTTA | CAATGACAGCCATCCACATC | 107–392 | 285 |
| Claudin 2 | ACACACAGCACAGGCATCAC | TCTCCAATCTCAAATTTCATGC | 490–809 | 319 |
| Claudin 3 | AAGGTGTACGACTCGCTGCT | AGTCCCGGATAATGGTGTTG | 189–436 | 247 |
| Claudin 4 | TGGATGAACTGCGTGGTGCAG | GAGGCGGCCCAGCCGACGTA | 2753–3114 | 361 |
| Claudin 5 | ATGTCGTGCGTGGTGCAGAG | GGTGCAGACCCAGGCGCCGCA | 1459–1872 | 413 |
| Claudin 6 | GATGCAGTGCAAGGTGTACG | CCTTGGAATCCTTCTCCTCC | 183–343 | 160 |
| Claudin 7 | AGTGGCAGATGAGCTCCTATG | GTTATAAAAGTCTGTGACAATCT | 404–768 | 364 |
| Claudin 8 | GAAGGACTGTGGATGAATTGC | GATGAAGATGATTCCAGCCG | 142–381 | 239 |
| Claudin 9 | TTCATCGGCAACAGCATCGT | GCCCAGCCCAGGTAGAGGGA | 954–1357 | 403 |
| Claudin 10 | TGTACCAAAGTCGGAGGCTC | GCATTTTTATCAAACTGTTTTGAAGG | 307–677 | 370 |
| Claudin 11 | TGGTGGACATCCTCATCC | AGAGAGCCAGCAGAATGAGC | 203–397 | 194 |
| Claudin 12 | TTCCTTCCTGTGTGGAATCG | GTTGCACATTCCAATCAGGC | 181–475 | 294 |
| Claudin 14 | CTCATGGTCATCTCCTGCCTG | ACGTAGTCGTTCAGCCTGTAC | 1050–1519 | 469 |
| Claudin 15 | CATCACCACCAACACCATCTT | GCTGCTGTCGCCTTCTTGGTC | 1225–1765 | 540 |
| Claudin 16 | TTTGGATTTCTCACCCTGCTC | TGTGCGAGGGGCTGAGTATGA | 481–879 | 398 |
| Claudin 17 | TGCTTATTGGCATCTGTGGC | TTCTGACCTATGTGGATGGC | 284–473 | 189 |
| Claudin 18 | GATGATCGTAGGCATCGTCC | ATGCCGGTGTACATGTTAGC | 246–473 | 227 |
| Claudin 19 | CTCAGCGTAGTTGGCATGAA | GAAGAACTCCTGGGTCACCA | 289–447 | 159 |
Location is numbered from the initiation codon. GenBank accession numbers (http://www.ncbi.nlm.nih.gov/Genbank; National Center for Biotechnology Information, Bethesda, MD): Claudin 1, NM_021101; Claudin 2, NM_020384; Claudin 3, NM_001306; Claudin 4, NM_001305; Claudin 5, NM_003277; Claudin 6, NM_021195; Claudin 7, NM_001307; Claudin 8, NM_199328; Claudin 9, NM_020982; Claudin 10, NM_006984; Claudin 11, NM_005602; Claudin 12, NM_012129; Claudin 14, NM_012130; Claudin 15, NM_014343; Claudin 16, NM_006580; Claudin 17 NM_006580; Claudin 18, NM_001002026; and Claudin 19, NG_008993.
Immunofluorescence
The subcellular distribution of claudins-3, -9, -10, -15, and -19 was determined by indirect immunofluorescence. Cultures were fixed in 100% ethanol at 4°C for 30 minutes and immunolabeled by incubating the samples with one of the following antibody preparations: rabbit anti-claudin-3, mouse monoclonal anti-claudin-10, mouse monoclonal anti-claudin-15 (Zymed Laboratories, Inc., Carlsbad, CA), goat anti-claudin-9 (Santa Cruz Biotechnology, Inc., Santa Cruz, CA), or mouse monoclonal anti-claudin-19 (Novus Biologicals, Littleton, CO). The samples were then incubated with ML-grade secondary antibodies conjugated with Cy2 or -3 dyes (Jackson ImmunoResearch Laboratories, West Grove, PA). Fluorescence images were acquired (Axioskop or LSM 700 Confocal Laser Scanning Microscope; Carl Zeiss Meditec, Thornwood, NY) and processed (AxioVision software; Carl Zeiss Meditec, Inc.).
VEGF Secretion and Trafficking
To estimate the concentration of VEGF that was normally secreted by cultured hfRPE, 200-μL aliquots were collected from the apical and basal media chambers after 24 hours of culture in the presence or absence of 10 mM ammonium chloride (Sigma-Aldrich). In some experiments, human VEGF-A165 (5 ng/mL; Sigma-Aldrich) was added to either the apical or basal medium chamber at the beginning of the incubation. The aliquots were measured with the (Quantikine Kit; R&D Systems, Minneapolis, MN) according to the manufacturer's protocol. The optical densities were determined within 30 minutes, with a microplate reader (Biotek, Winooski, VT) set to 450 nm.
Paracellular Flux of mPEG
The paracellular flux of mPEG was measured in each of the solutions used to measure TER or ion flux. The mPEG (average molecular weight, 550; MP Biomedicals, LLC, Solon, OH), was added to the appropriate medium chamber to a final concentration of 50 μg/mL, the cultures were incubated for 1.5 hours at 37°C, and the medium from the opposite medium chamber was collected for analysis. The concentration of mPEG was determined by using a rabbit monoclonal PEG ELISA kit (Epitomics, Inc., Burlingame, CA), according to the manufacturer's protocol.
Measurement of TER and Tight Junction Resistance
TER of hfRPE monolayers cultured on permeable filters (Transwell; Corning Inc.) was measured (EndOhm electrodes; World Precision Instruments, Sarasota, FL), according to the manufacturer's instructions at 33°C after the cells had been cultured for 6 to 8 weeks.30 The 33°C temperature was easier to maintain than 37°C and avoided the phase transition that occurs in tight junctions at ambient temperatures.31 Measurements were made in growth medium. The measurements are reported as ohms times the area in square centimeters.
The TER is an amalgam of the apical and basal plasma membrane resistances and the paracellular (or shunt) resistance. The source of the paracellular resistance is primarily the tight junctions.32 These resistors are related by the following equation33:
For many epithelia, the membrane resistance is higher than the paracellular resistance, which leads to equations 2 and 3.
Substituting equation 3 into equation 1 leads to
For hfRPE, the TER is ∼1000 Ω · cm2, which suggests that the assumptions for equations 2 and 3 are not correct. To measure effects on tight junctions alone, it would be necessary to use medium that inhibits membrane pumps and channels thereby increasing (Rapical + Rbasal). Because the Na+,K+-ATPase provides the main driving force for membrane transport, potassium- or sodium-free medium would greatly increase the membrane resistance. Bicarbonate-free medium would further inhibit prominent co-transporters.19 The inclusion of 2 mM BaCl2 would inhibit K+ channels to further minimize membrane transport. Under these conditions, equation 4 becomes a reasonable approximation. The buffers used in the following experiment met these conditions.
TER is the inverse of conductance. When the conditions for equation 4 are satisfied, then the conductance is a measure of how easily an electrical current crosses the tight junction. If the conductance is determined in the presence of different chloride salts, it becomes a measure of the selectivity for the corresponding cation. We measured the TER in 150 mM XCl, 2 mM CaCl2, 1 mM MgCl2, 2 mM BaCl2, 10 mM glucose, 1.0 mM HEPES [pH 7.4], where XCl is LiCl, NaCl, KCl, RbCl, or CsCl. The osmolarity was measured (Vapro 5520 Osmometer; Wescor, Logan, UT) and adjusted to 310 to 315 mOsM (the osmolarity of the culture medium). Cultures were incubated in each salt solution until the TER became stable. After the measurements, the cells were incubated in culture medium to demonstrate that the measurements were reversible and the cells remained viable. The measurements were reproducible in the same cultures the following day.
Paracellular Flux of Na+ and Cl−
To measure the paracellular flux of Na+ and Cl− an apical-to-basal concentration gradient was established. The apical medium chamber contained 137 mM NaCl, 10 mM CaCl2, 5 mM MgCl2, 2 mM BaCl2, 10 mM glucose, and 10 mM HEPES (pH 7.4), and the basal medium chamber contained 270 mM mannitol, 2 mM calcium lactate, 2 mM BaCl2, 10 mM glucose, and 10 mM HEPES (pH 7.4). To replace the growth medium in the apical chamber without damaging the monolayer, 50% of the medium (0.25 mL) was removed from the top edge of the solution, and an equal volume of the flux medium was gently added. The process was repeated three times. All solutions were prewarmed to 37°C, and the cultures were incubated on a heating block that maintained 37°C during the experiment. Aliquots (50 μL) were removed from the basal chamber at 0.5 hour, 1.0 hour, and 1.5 hours, and replaced with 50 μL of basal medium. The collected medium was spun at 1000g for 10 minutes before determination of ion concentrations. After the experiment, growth medium was restored to both chambers. The TER was measured in the growth medium before and after the experiment. Only monolayers in which the TER was the same before and after the experiment were used in the final analysis. Experiments were performed in quadruplicate.
To measure the Na+ concentration, a 25-μL aliquot was added to 25 μL H2O and recorded with a Na+ electrode (Orion, Beverly, MA), according to the manufacturer's instruction. Standard Na+ curves were generated by adding known concentrations of NaCl to equal volumes of the basal medium solution. Sodium concentrations in each sample were then calculated from the standard curve. For Cl− concentration, a chloride assay kit (QuantiChrom, DICL-250; BioAssay Systems, Hayward, CA) was used according to the manufacturer's protocol. The assays were optimized for each flux sample and diluted standard with a 96-well plate and optical density at 595 nm. The total Na+ or Cl− (in μg) that appeared in the basal medium chamber for each time point was plotted against time. The flux was the slope of the linear regression line (Na+ correlation coefficient > 0.89; Cl− correlation coefficient > 0.95). The permeation coefficient, P, in centimeters per hours, is the flux divided by the original concentration (in micrograms per milliliter) of NaCl in the apical medium chamber.
Immunoblot Analyses
The cultured hfRPE were solubilized on ice in 200 μL of 25 mM Tris buffer (pH 8.0) containing 2% sodium dodecyl sulfate and 10 μL/mL protease inhibitor cocktail (Sigma-Aldrich). Melanin granules were removed by centrifugation. Detergent-resistant multimers of claudin were prevented from forming by adding EDTA to 5 mM along with 50 μL of 5× gel loading buffer. The samples were incubated for 10 minutes at 37°C and then for 5 minutes in a boiling water bath. Protein concentration was determined by using a protein assay kit (Micro BCA; Pierce, Rockford, IL). Equal amounts of protein were resolved by sodium dodecyl sulfate–polyacrylamide gel electrophoresis and followed by immunoblotting. The level of α-tublin staining was used as an internal standard to normalize each sample. Rabbit polyclonal anti-claudin-3, mouse monoclonal anti-claudin-10 rabbit polyclonal anti-claudin-15 (Zymed Laboratories, Carlsbad, CA) and mouse monoclonal anti-claudin-19 (Novus Biologicals, Inc., Littleton, CO) were used as 1:300 dilutions. Mouse monoclonal antibodies against α-tubulin were purchased from Zymed. The immunoblots were developed with HRP-conjugated secondary antibodies and chemiluminescence reagent (ECL plus; Amersham Life Science, Arlington Heights, IL).
Effects of VEGF-A165, Bevacizumab, and Ranibizumab on Barrier Properties
These were added to the apical or basal chamber or to both chambers with similar results. VEGF-A165 was added in concentrations ranging from 1 to 300 ng/mL; Bevacizumab or ranibizumab was added in pharmaceutical concentrations of 0.25 mg/mL and 0.125 mg/mL, respectively. Cultures were fed three times per week, with fresh drug added at each feeding. Baseline TER was measured before administration of each agent and periodically for 2 weeks.
Results
Claudin Expression
For proper assessment of effects on RPE tight junctions, it is necessary to establish that native claudins are expressed. Transcriptome analysis of native human RPE (fetal and adult) and hfRPE cultured by the methods used in this study indicate that the mRNA for claudin-10, -15, -19, and possibly -3 are the only claudins expressed by RPE (Miller S, Maminishkis A, National Eye Institute, personal communication, 2009). That transcriptome analysis was performed using gene microarrays of the human genome (Affymetrix, Santa Clara, CA). We examined these findings by RT-PCR (Fig. 1). RT-PCR confirmed the expression of mRNAs for claudin-3, -10, -15, and -19. Contrary to the transcriptome analysis, there was evidence of claudin-9 mRNA. By immunofluorescence, claudin-3, -10, and -19 were detected, but claudin-9 and -15 were undetected by the available antibodies (Fig. 2). The immunoreactivity for each claudin was concentrated in circumferential bands at the apical end of the lateral membranes, which is the location of tight junctions (Fig. 3). For claudin-3 and -19, immunoreactivity was observed throughout the monolayers, but claudin-10 immunoreactivity was detected in only a subset of cells. Claudin-10 was observed at the border of claudin-10-positive and claudin-10-negative cells, which suggests that it may be capable of heterotypic interactions with claudins from the neighboring cells.
Figure 1.

RT-PCR revealed the presence of mRNA for claudins-3, -9, -10, -15, and -19. Equal amounts of total RNA were amplified for 32 cycles, with the primers indicated in Table 1. Left lane: HaeIII digest of φX174 DNA. The positions of 872, 603, and 280 bp are indicated.
Figure 2.

Claudin-3 and -19 were uniformly expressed, but claudin-10 was detected in only a subset of cells. Cells were cultured for more than 8 weeks and immunolabeled for the claudin indicated. Bar, 20 μm.
Figure 3.

Claudins localized to the position of tight junctions. The cultures described in Figure 2 were examined by scanning laser confocal microscopy and three-dimensional reconstructions were created with commercial software. The thickness of the box (∼4 μm) approximates the thickness of the monolayer. Nuclei, revealed by DAPI (blue), occupy the thickness of the cell body. The claudins were revealed using cy2 (green)- or cy3 (red)-conjugated secondary antibodies. Claudin immunoreactivity was observed in circumferential bands that lay near the apical end (top box face) of the cell, which is the position of tight junctions.
Normal Expression and Trafficking of VEGF in Cultures of hfRPE
Before examining the effects of VEGF on tight junctions, we examined its secretion and trafficking patterns. During a 24-hour incubation, equal concentrations of VEGF appeared in the apical and basal media chambers (Fig. 4). The basal chamber had three times the volume of the apical chamber, which suggests that most of the VEGF was secreted basally. Two alternative mechanisms could also lead to equal concentrations of VEGF in the two chambers. The high TER that we observed (800–1200 Ω · cm2) suggests that the equilibration via the paracellular pathway is unlikely, because diffusion would be retarded by the tight junctions. However, transcytosis would allow VEGF secreted in one chamber to cross the monolayer into the other chamber. A second mechanism would be faster endocytosis and degradation of VEGF at one pole of the cell.
Figure 4.

Secretion of VEGF was nonpolarized, but the apical membrane endocytosed VEGF and targeted it for degradation. VEGF-A165 was added to the culture medium of either the apical or basal medium chamber, as indicated on the x-axis. Degradation and transcytosis were blocked in half of the cultures with 10 mM NH4Cl. After 24 hours, the medium was collected, and the VEGF that accumulated in each chamber was determined. When NH4Cl was included, endogenous VEGF increased only in the apical chamber. The addition of VEGF-A165 to the apical chamber also appeared to inhibit degradation. Transcytosis was evident only in the basal-to-apical direction and only in the absence of NH4Cl. The experiment was performed in quadruplicate. The SE is indicated. Significant differences between control and NH4Cl-treated cultures are noted. *P < 0.01; †P < 0.05.
The second mechanism predominated in normal culture conditions. Endocytosis, degradation, and transcytosis were inhibited using NH4Cl,34 but it had no effect on the concentration of VEGF in the basal medium chamber, but increased the concentration in the apical chamber (Fig. 4). Accordingly, the secretion of VEGF appeared to be nonpolarized. When 5 ng/mL of VEGF was added to the apical medium chamber of untreated cells, very little appeared in the basal chamber. In fact, more VEGF (7.5 ng, total) was recovered from this culture than was added to the apical chamber (2.5 ng, total). It appeared as though apical VEGF bound its receptor and targeted the receptor for degradation, thereby preventing additional endocytosis during the 24-hour period. This interpretation stems from the following observation. In the presence of NH4Cl, 5 ng was secreted by hfRPE into the apical chamber. When 2.5 ng was added to the apical chamber in the absence of NH4Cl, 7.5 ng of VEGF was recovered after 24 hours. When 100 ng/mL of VEGF was added to the apical chamber, only 2% crossed the monolayer (data not shown). When, VEGF (5 ng/mL) was added to the basal chamber, a small amount (∼14%) appeared in the apical chamber. Together, these data suggest that transcytosis is a minor pathway that favors the basal-to-apical direction. With the addition of NH4Cl, the exogenous VEGF remained in the chamber to which it was added. These data indicate that in normal conditions, receptor-mediated uptake of VEGF from the basal side is more likely to be transcytosed than degraded. By contrast, there is a more active endocytic pathway on the apical side that targets the bulk of the VEGF and its receptor for degradation.
The basal-to-apical transcytosis of VEGF countered the bulk of fluid-phase transcytosis. To monitor transcellular diffusion and bulk fluid-phase transcytosis, we used mPEG. PEG is a mixture of polymers. A small fraction of polymers, <4 Å, can cross tight junctions with fast kinetics, but larger oliogmers would cross tight junctions at a much slower rate, or may follow fluid-phase, non–receptor-mediated transcytosis. The low apparent permeation (Papp) of PEG confirmed the presence of tight junctions. Under normal growth conditions, Papp was approximately 2.0 to 3.2 × 10⁻³ cm/h, but when tight junctions were disrupted with EDTA, the Papp was 10 times higher, 2.4 × 10⁻² cm/h. If the transcellular movement was purely via the paracellular path, Papp should be the same in the apical-to-basal and basal-to-apical directions. By contrast, the permeation of mPEG was 50% higher in the apical-to-basal direction (Table 2). Since there are no receptors for mPEG, this result suggests the bulk of fluid-phase transcytosis is in the apical-to-basal direction and that the basal-to-apical transcytosis of VEGF would have to be receptor mediated.
Table 2.
The Apparent Permeation of mPEG Revealed the Presence of Tight Junctions and an Apical-to-Basal Dominant Pathway for Bulk Fluid Phase Transcytosis
| Papp × 103 | |
|---|---|
| Apical to basal* | 3.2 ± 0.1† |
| Basal to apical* | 1.95 ± 0.03† |
| With 5 mM EDTA*‡ | 24 ± 3 |
| NaCl buffer§ | 1.2 ± 0.1 |
| KCl buffer§ | 1.1 ± 0.1 |
The data are expressed as mean centimeters/hour ± SE of quadruplicate measurements.
Growth medium P < 0.001.
P < 0.001.
Both directions.
Basal to apical direction.
Selectivity of Tight Junctions
Because the properties of RPE tight junctions have not been reported, we estimated the selectivity of the junctions for several ions. The TER was measured in a series of chloride salt solutions to determine the selectivity for monovalent cations (Fig. 5).35 The procedure was reversible, as the TER of the cultures was restored when the cultures were returned to growth medium. Similar measurements were obtained when the experiments were repeated with the same cultures the next day. The TER in NaCl was higher than the TER in growth medium, even though Na+ is the major cation in growth medium. This difference most likely reflects the high membrane resistance in the NaCl solution, as discussed in the Methods section. The TER was substantially lower for K+, which means the conductance was high and that the tight junctions were selective for K+. The data conform to Eisenman sequence IV.35
Figure 5.

The TER in KCl solution was much lower than in solutions containing other chloride salts of alkali I metals. hfRPE was incubated in the buffered salt solutions described in the Methods section. The principal chloride salt is indicated along the x-axis. The TER in growth medium is included as a reference. Measurements were performed in triplicate. Error bars, SE.
An alternative interpretation is that the KCl buffer causes the cells to shrink, which would widen the paracellular space, or the other buffers cause the cells to swell, which would narrow the paracellular space. The width of the paracellular space could affect the paracellular resistance, if it is very narrow.32 The measurements were repeated with the addition of polyethylene glycol in the basal medium chamber. Chains of PEG that are smaller than 4 Å cross tight junctions as readily as ions, but longer polymers cross the junctions at a much slower, rate.36 The apparent permeation of PEG was the same in NaCl and KCl buffers (Table 1), which suggests the width of the paracellular space, or alteration of the tight junctions, would not explain the differences in TER that were observed. Subsequent studies on how VEGF and anti-VEGF drugs might affect ion selectivity focused on the physiologically relevant ions Na+ and K+.
Chloride is the third ion that is critical for the regulation of the subretinal space and the absorption of fluid. We measured the permeation of Cl− together with Na+. The difference in permeation of Na+ and Cl− was not statistically significant (Table 2). Together with the previous result, these data suggest that the RPE tight junctions are K+-selective.
Effects of VEGF and Anti-VEGF Drugs
Even pharmacologic concentrations of VEGF (1–300 ng/mL) had minimal effects on the distribution of the claudins, regardless of whether VEGF was added to the apical or basal medium chambers (Fig. 6). Each claudin remained in the position of tight junctions, but there appeared to be a slight, variable, increase in the number of claudin-positive intracellular vesicles. Bevacizumab or ranibizumab had little effect on subcellular distribution. Immunoblots showed little effect on the level of protein expression (Fig. 7).
Figure 6.

The subcellular localization is unaffected by the presence or absence of VEGF. hfRPE was cultured for 2 weeks in VEGF-A165, bevacizumab or ranibizumab and labeled as described in the legend to Figure 3. The image for VEGF is representative of doses from 1 to 300 ng/mL.
Figure 7.
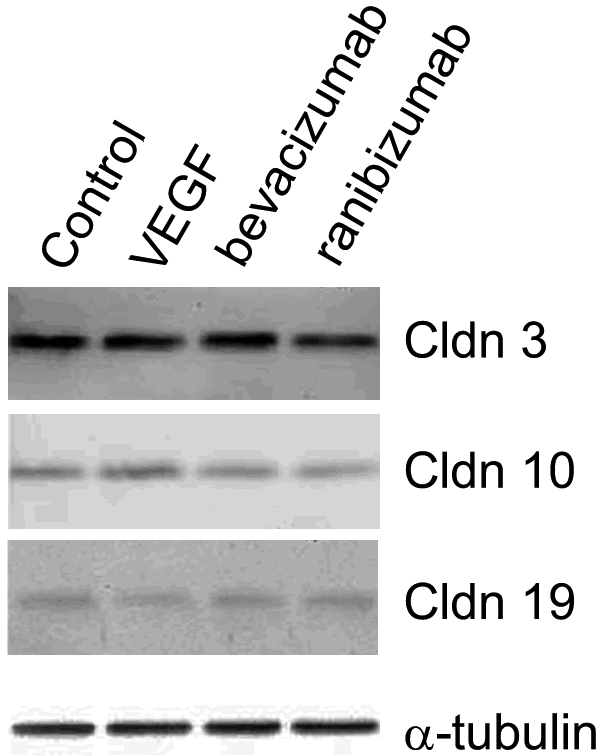
The expression of claudins was unaffected by VEGF-A165, bevacizumab or ranibizumab. hfRPE was cultured for 2 weeks with VEGF-A165 (300 ng/mL), bevacizumab (0.25 mg/mL), or ranibizumab (0.125 mg/mL) added to the culture medium. Equal amounts of protein were resolved by polyacrylamide gel electrophoresis and immunoblotted. α-Tubulin was included as a loading control. Claudin-9 and -15 were undetected. The other claudins were not affected by any of the culture additives to any appreciable extent. The immunoblot for VEGF is representative of doses from 1 to 300 ng/mL.
There was no effect of excess VEGF on the TER in the short or long-term (Fig. 8). The endogenous VEGF was neutralized with therapeutic concentrations of bevacizumab or ranibizumab for up to 2 weeks in culture. These pharmaceutical agents were added to the apical medium chamber, to mimic the injection of VEGF into the vitreous; to the basal chamber, to mimic leakage of high retinal VEGF across a compromised RPE barrier; or to both chambers. The TER was not affected by any of these treatments (Fig. 9). Because the TER is a gross measure of barrier functions, we examined the effects of VEGF, bevacizumab, and ranibizumab on the selectivity of the tight junctions. None of these agents affected the flux of Na+ or Cl− (Table 3). To determine cation selectivity, the TER was measured and the conductance (1/TER) is reported in Table 4. For comparison, the selectivity of the canine renal cell line MDCK is included. In RPE the conductance of Na+ was nearly three times lower than K+, but MDCK cells exhibited a different selectivity. VEGF had no effect on the conductance in any media, but bevacizumab and ranibizumab resulted in a slight increase in Na+ conductance.
Figure 8.

VEGF-A165 did not affect TER. Similar findings were obtained with 1, 5, and 10 ng/mL of VEGF-A165.
Figure 9.

Bevacizumab and ranibizumab did not affect TER.
Table 3.
Permeation of Na+ and Cl− by VEGF, Bevacizumab, and Ranibizumab
|
P × 103 |
||
|---|---|---|
| Na+ | Cl− | |
| Control | 9.5 ± 0.9 | 9.7 ± 0.7 |
| VEGF (100 ng/mL) | 7.9 ± 1.0 | 9.0 ± 0.6 |
| VEGF (300 ng/mL) | 8.4 ± 1.0 | 10.6 ± 0.7 |
| Bevacizumab (0.25 mg/mL) | 8.1 ± 1.0 | 10.3 ± 1.8 |
| Ranibizumab (0.13 mg/mL) | 8.7 ± 1.2 | 9.8 ± 0.6 |
Measurements were performed in quadruplicate in the apical-to-basal direction and are expressed as mean centimeters/hour ± SE.
Table 4.
Effect of Bevacizumab and Ranibizumab on Na+ Conductance
| Control | VEGF | Bevacizumab | Ranibizumab | MDCK | |
|---|---|---|---|---|---|
| Medium* | 9.2 ± 0.1 | 9.9 ± 0.1 | 10.1 ± 0.1 | 9.7 ± 0.1 | 227.5 ± 3.0 |
| NaCl* | 7.9 ± 0.2 | 7.9 ± 0.2 | 10.6 ± 0.3 | 8.4 ± 0.2 | 204.2 ± 1.2 |
| KCl* | 22.3 ± 5.2 | 29 ± 6.7 | 21 ± 4.9 | 16.6 ± 3.9 | 185.3 ± 3.0 |
| Ratio† | 0.35 | 0.27 | 0.50 | 0.51 | 1.10 |
In hfRPE cultures, the conductance in KCl was substantially higher than that in NaCl. For comparison, in the renal cell line MDCK, the conductance in NaCl was slightly higher. VEGF had no effect on the total conductance or the conductance in the NaCl or KCl buffers. Bevacizumab and ranibizumab had a slight but statistically significant effect on the Na+ conductance of RPE (P < 0.05). The control data are the inverse of the TER reported in Figure 5.
Conductance × 104 (Siemens/cm2).
Conductance (NaCl)/conductance (KCl).
Discussion
VEGF was originally identified as vascular permeability factor.37,38 In the outer retina, it is responsible for making the endothelia of the choriocapillaris leaky. But for an outer blood–retinal barrier to exist, VEGF cannot have the same effect on the overlying RPE. Recent findings indicate that VEGF is also important for the maintenance of the Müller cells and photoreceptors that lie on the opposite side of the RPE.27 Because the RPE lies at the interface between the choriocapillaris and the outer neural retina, it is an ideal source of VEGF for both tissues. However, in AMD, high levels of retinal VEGF have been implicated in subretinal neovascularization and retinal edema. Therefore, it would be important to regulate the concentration of VEGF in the subretinal space. The present study shows that neither reducing VEGF with neutralizing antibodies nor adding exogenous VEFG has any effect on the permeability of RPE. Further, the RPE has a mechanism to remove VEGF from the subretinal space and degrade it. In normal circumstances, this would maintain a low concentration of VEGF for Müller cells and photoreceptors without reaching a threshold level that would induce neovascularization. To gain support for this model, we examined the secretion, endocytosis, and degradation of VEGF, and we determined the functional properties of RPE tight junctions in the presence and absence of VEGF.
The effects of VEGF on RPE and its barrier properties have been controversial, with some investigators finding that VEGF makes the barrier leakier and others finding the opposite.12–15 These differences most likely reflect the variability of barrier properties of cultured RPE.11,24 Studies with the APRE19 cell line are particularly difficult to interpret, because its barrier properties are affected by culture media, passage number, and time in culture. Tight junctions may or may not form, and even when they do, the tight junctions are relatively leaky. The expression of claudins varies with culture conditions with claudin-1, as an example, actually disappearing as tight junctions begin to form. The most differentiated cultures of human RPE were derived from human fetal tissue.39–41
The hfRPE preparation exhibits the morphology and physiology of native RPE.41 It has been shown by gene microarray (Affymetrix) that adult, fetal (16 week), and cultured hfRPE cells express the same complement of mRNAs (Miller S, Maminishkis A, National Eye Institute, personal communication, 2009). Using RT-PCR, we found that, with a few exceptions, the microarrays accurately predicted which claudin mRNAs were the prominent ones expressed. The major exception was claudin-9 mRNA, which was detected only by RT-PCR. In addition, in some RPE preparations, claudin-1 and -2 could be detected with more cycles of PCR. Further, the expression of claudin-2 could be modulated by culture conditions (Rizzolo L and Peng S, unpublished data, 2009). This variability in expression is the focus of ongoing studies in our laboratory. Our observations and the Affymetrix microarray data differ substantially from the Eye SAGE database (http://neibank.nei.nih.gov/EyeSAGE/index.shtml; National Eye Institute, Bethesda, MD). This database includes only 10 of the 24 known claudins. In agreement with our RT-PCR findings, the SAGE database reports the presence of mRNAs for claudins-2, -3, and -15 and the absence of claudin-11. By contrast, it has failed to find evidence of claudin-10 mRNA, but detected claudin-7, -8, and -20. The SAGE database includes conflicting data regarding claudin-5 and -12. Clearly, there are wide discrepancies between the results from the SAGE and Affymetrix gene arrays, but the Affymetrix analysis is more consistent with the RT-PCR data presented herein. In a study of the chick RPE transcriptome, we also found a relatively small number of discrepancies between the Affymetrix microarrays and RT-PCR.42,43
Of the five mRNAs that were consistently expressed, the proteins for claudin-3, -10, and -19 were detected by immunoblot analysis and immunofluorescence. The absence of claudin-9 and -15 may reflect the sensitivity of the antibody preparations or regulation of protein translation or turnover and should be investigated further. Unlike claudin-3 and -19, claudin-10 was expressed in only a subset of cells. Therefore, cultured hfRPE maintains some of the regional heterogeneity of protein expression that has been described for RPE in vivo. Restricted expression of claudin-10 in vivo, would suggest that tight junctions in certain regions of RPE have a different ion selectivity than others.44 In turn, this would predict that regional differences may exist in the physiology of the outer retina. The immunofluorescent signal for claudin-10 was equally intense along tight junctions regardless of whether the neighboring cells both expressed claudin-10 or only one of the neighbors expressed it. This observation suggests that claudin-10 can participate in heterophilic interactions with claudins of the neighboring cell. Because hfRPE express highly functional tight junctions and the proper compliment of claudins, we believe this preparation best suited to evaluate the effects of VEGF and the anti-VEGF therapeutic antibodies, bevacizumab, and ranibizumab.
There is controversy in the literature regarding the polarized secretion of VEGF and which VEGF receptors may participate in trafficking.12,14,41,45 A study in which the ARPE19 cell line was used showed that most VEGF was secreted apically.45 However, those cells have a low TER. We confirmed earlier reports that equal concentrations of VEGF were observed in the apical and basal medium chambers of hfRPE after 24 hours of incubation.46 The volume of the basal medium chamber is three times larger than that of the apical chamber, which suggests that hfRPE secrets three times as much VEGF basally as apically. However, 24 hours is long enough for endocytosis followed by transcytosis or degradation to modulate the concentration of VEGF in the two medium chambers. When these processes were inhibited, we found that secretion was nonpolarized. Further, the apical membrane was more active in endocytosing and degrading VEGF in the apical medium chamber. When excess VEGF was added to the basal medium chamber, very little was degraded but some was transcytosed. By contrast, a significant fraction of VEGF added to the apical medium chamber was endocytosed and degraded. This finding was consistent with reports that most of the VEGF receptors localize to the apical membrane12 and describes the mechanism for bathing the photoreceptors and Müller cells with the VEGF they need27 without allowing excess VEGF to accumulate and stimulate neovascularization or increase the permeability of retinal capillaries. An inhibitor of receptor-mediated endocytic and transcytotic pathways suggested that VEGF trafficking was receptor mediated. This interpretation was supported by following a marker of non–receptor-mediated transcytosis, mPEG. There is no receptor-mediated transport for PEG, which makes it a useful tracer for examining diffusion across tight junctions.36 Diffusion across tight junctions would be bidirectional, but diffusion of mPEG in the apical-to-basal direction was significantly greater than that in the opposite direction. This observation suggests that there is a bulk phase transcytosis mechanism in which the apical-to-basal direction is predominant. Bulk fluid-phase transcytosis has been described in the MDCK cell line, where the apical-to-basal path is also predominant.47,48 We are unaware of previous descriptions of this pathway in RPE. The endocytosis and degradation of VEGF has been described in endothelial cells.49 A similar mechanism appears to exist in RPE, but mainly in the apical membrane.
It should be noted that the hfRPE cultures secrete nanogram quantities of VEGF into the culture medium. By contrast, the concentration of VEGF in the subretinal space has been estimated to be 0.5 to 1.2 ng/mL in patients with rhegmatogenous retinal detachment.50,51 Therefore, the concentration in our dose–response studies would be considered in the pathologic range and greater, except for those experiments that included bevacizumab or ranibizumab. We found no dose–response to VEGF in any of our assays from ∼0 VEGF (with drugs) to 1 to 300 ng/mL of VEGF-A165 added to the endogenous VEGF.
To our knowledge, the functional characteristics of the RPE tight junction have not been described. Like many epithelia, the RPE is cation selective, but this selectivity appears to be due to the permeability of K+ rather than that of Na+. Claudins determine ion selectivity by mechanisms still under investigation.17 The only claudins known to be associated with native or high-functioning RPE junctions were claudin-10 and -19.22,39,41 Mutations in claudin-19 are associated with renal disease and visual impairment. In the kidney, claudin-19 forms a complex with claudin-16 and decreases the permeability to Cl−. Claudin-16 increases the permeability to Na+, which further increases cation selectivity.52 We found that RPE lacked claudin-16, which raises the question of how claudin-19 functions in the RPE. Other claudins known to affect Na+ and K+ permeability are claudin-2, which also increases Na+ permeability,53 and claudin-9, which decreases K+ permeability.54 The expression of these claudins by hfRPE remains an open question until we can resolve the uncertainty about the antibodies and the variability of claudin-2 expression mentioned earlier. The presence of claudin-10 could increase selectivity for cations in the regions where it is expressed.55 On the other side of the equation, RPE lacked claudin-4 and -7, which increase Cl− permeability.53 Those authors found that claudin-3 had no effect on Na+/Cl− selectivity, but the effect on K+ was not examined. Taken together, we found claudins that are consistent with the known physiology that predicts a cation-selective junction. RPE expresses claudins that would preferentially decrease permeability to Cl−, but lacks claudins that would increase permeability to Na+. The reason for the relatively high K+ permeability requires further investigation, but the data conform to a higher-order Eisenman sequence for cation selectivity.35 The study of ion selectivity reported herein defines a baseline for explorations of how individual claudins fine-tune selectivity by manipulating claudin expression.
The effects of bevacizumab and ranibizumab proved to be minimal. By the more sensitive TER method, the drugs appear to increase the conductance of Na+ slightly, relative to K+. However, the increase was not corroborated by flux measurements. One reason may be the low sensitivity for detection of small changes. Another reason may be that TER is an instantaneous measurement, but flux is measured over time. Flux measurements would reflect the transient breaks and resealing of tight junctional strands that are used by small and large solutes to cross tight junctions. By contrast, TER would measure the ability of small solutes to cross unbroken strands.16,17,56
These studies demonstrate that hfRPE is an appropriate model for the study of the function of the outer blood–retinal barrier. The hfRPE express native claudins and form fully functional tight junctions. Culture models that express rudimentary tight junctions or functional tight junctions with non-native claudins complicate the interpretation of experimental data. Such models may be useful for developing therapies to restore an outer blood–retinal barrier, but not for determining the effects of drugs on normal barrier function. These findings complement the physiological studies of membrane transporters in this preparation and facilitate studies on the interplay of these two dimensions of the outer blood–retinal barrier.
Acknowledgments
The authors thank Sheldon Miller, PhD, and Arvydas Maminishkis, PhD, for helpful suggestions, for sharing genomic-analysis data in advance of publication, and for providing primary cultures of hfRPE.
Footnotes
Supported in part by the National Eye Institute Vision Core Grant EY000785 (Yale University), the Leir Foundation (RA), and the National Natural Science Foundation of China Grant NO 30772381 (SP).
Disclosure: S. Peng, None; R.A. Adelman, None; L.J. Rizzolo, None
References
- 1.Bressler NM. Age-related macular degeneration is the leading cause of blindness. JAMA 2004;291:1900–1901 [DOI] [PubMed] [Google Scholar]
- 2.Tranos PG, Wickremasinghe SS, Stangos NT, Topouzis F, Tsinopoulos I, Pavesio CE. Macular edema. Surv Ophthalmol 2004;49:470–490 [DOI] [PubMed] [Google Scholar]
- 3.Ferris FL, 3rd, Fine SL, Hyman L. Age-related macular degeneration and blindness due to neovascular maculopathy. Arch Ophthalmol 1984;102:1640–1642 [DOI] [PubMed] [Google Scholar]
- 4.Fleckenstein M, Charbel Issa P, Helb HM, et al. High-resolution spectral domain-OCT imaging in geographic atrophy associated with age-related macular degeneration. Invest Ophthalmol Vis Sci 2008;49:4137–4144 [DOI] [PubMed] [Google Scholar]
- 5.Grisanti S, Tatar O. The role of vascular endothelial growth factor and other endogenous interplayers in age-related macular degeneration. Prog Retin Eye Res 2008;27:372–390 [DOI] [PubMed] [Google Scholar]
- 6.Izumi-Nagai K, Nagai N, Ohgami K, et al. Inhibition of choroidal neovascularization with an anti-inflammatory carotenoid astaxanthin. Invest Ophthalmol Vis Sci 2008;49:1679–1685 [DOI] [PubMed] [Google Scholar]
- 7.Rosenfeld PJ, Brown DM, Heier JS, et al. Ranibizumab for neovascular age-related macular degeneration. N Engl J Med 2006;355:1419–1431 [DOI] [PubMed] [Google Scholar]
- 8.Zarbin MA. Current concepts in the pathogenesis of age-related macular degeneration. Arch Ophthalmol 2004;122:598–614 [DOI] [PubMed] [Google Scholar]
- 9.Korte GE, Burns MS, Bellhorn RV. Epithelium-capillary interactions in the eye: the retinal pigment epithelium and the choriocapillaris. Int Rev Cytol 1989;114:221–248 [DOI] [PubMed] [Google Scholar]
- 10.Yokomori H, Oda M, Yoshimura K, et al. Vascular endothelial growth factor increases fenestral permeability in hepatic sinusoidal endothelial cells. Liver Int 2003;23:467–475 [DOI] [PubMed] [Google Scholar]
- 11.Geisen P, McColm JR, King BM, Hartnett ME. Characterization of barrier properties and inducible VEGF expression of several types of retinal pigment epithelium in medium-term culture. Curr Eye Res 2006;31:739–748 [DOI] [PubMed] [Google Scholar]
- 12.Ablonczy Z, Crosson CE. VEGF modulation of retinal pigment epithelium resistance. Exp Eye Res 2007;85:762–771 [DOI] [PMC free article] [PubMed] [Google Scholar]
- 13.Ghassemifar R, Lai CM, Rakoczy PE. VEGF differentially regulates transcription and translation of ZO-1alpha+ and ZO-1alpha− and mediates trans-epithelial resistance in cultured endothelial and epithelial cells. Cell Tissue Res 2006;323:117–125 [DOI] [PubMed] [Google Scholar]
- 14.Miyamoto N, de Kozak Y, Normand N, et al. PlGF-1 and VEGFR-1 pathway regulation of the external epithelial hemato-ocular barrier. Ophthalmic Res 2008;40:203–207 [DOI] [PubMed] [Google Scholar]
- 15.Ida H, Tobe T, Nambu H, Matsumura M, Uyama M, Campochiaro PA. RPE cells modulate subretinal neovascularization, but do not cause regression in mice with sustained expression of VEGF. Invest Ophthalmol Vis Sci 2003;44:5430–5437 [DOI] [PubMed] [Google Scholar]
- 16.Rizzolo LJ. Development and role of tight junctions in the retinal pigment epithelium. Int Rev Cytol 2007;258:195–234 [DOI] [PubMed] [Google Scholar]
- 17.Van Itallie CM, Anderson JM. Claudins and epithelial paracellular transport. Annu Rev Physiol 2006;68:403–429 [DOI] [PubMed] [Google Scholar]
- 18.Powell DW. Barrier function of epithelia. Am J Physiol 1981;241:G275–G288 [DOI] [PubMed] [Google Scholar]
- 19.Strauss O. The retinal pigment epithelium in visual function. Physiol Rev 2005;85:845–881 [DOI] [PubMed] [Google Scholar]
- 20.Le Moellic C, Boulkroun S, Gonzalez-Nunez D, et al. Aldosterone and tight junctions: modulation of claudin-4 phosphorylation in renal collecting duct cells. Am J Physiol Cell Physiol 2005;289:C1513–C1521 [DOI] [PubMed] [Google Scholar]
- 21.Chen SY, Bhargava A, Mastroberardino L, et al. Epithelial sodium channel regulated by aldosterone-induced protein sgk. Proc Natl Acad Sci USA 1999;96:2514–2519 [DOI] [PMC free article] [PubMed] [Google Scholar]
- 22.Konrad M, Schaller A, Seelow D, et al. Mutations in the tight-junction gene claudin 19 (CLDN19) are associated with renal magnesium wasting, renal failure, and severe ocular involvement. Am J Hum Genet 2006;79:949–957 [DOI] [PMC free article] [PubMed] [Google Scholar]
- 23.Abe T, Sugano E, Saigo Y, Tamai M. Interleukin-1beta and barrier function of retinal pigment epithelial cells (ARPE-19): aberrant expression of junctional complex molecules. Invest Ophthalmol Vis Sci 2003;44:4097–4104 [DOI] [PubMed] [Google Scholar]
- 24.Luo Y, Zhuo Y, Fukuhara M, Rizzolo LJ. Effects of culture conditions on heterogeneity and the apical junctional complex of the ARPE-19 cell line. Invest Ophthalmol Vis Sci 2006;47:3644–3655 [DOI] [PubMed] [Google Scholar]
- 25.Brown DM, Kaiser PK, Michels M, et al. Ranibizumab versus verteporfin for neovascular age-related macular degeneration. N Engl J Med 2006;355:1432–1444 [DOI] [PubMed] [Google Scholar]
- 26.Moschos MM, Brouzas D, Apostolopoulos M, et al. Intravitreal use of bevacizumab (Avastin) for choroidal neovascularization due to ARMD: a preliminary multifocal-ERG and OCT study—multifocal-ERG after use of bevacizumab in ARMD. Doc Ophthalmol 2007;114:37–44 [DOI] [PubMed] [Google Scholar]
- 27.Saint-Geniez M, Maharaj AS, Walshe TE, et al. Endogenous VEGF is required for visual function: evidence for a survival role on Muller cells and photoreceptors. PLoS ONE 2008;3:e3554 [DOI] [PMC free article] [PubMed] [Google Scholar]
- 28.Heiduschka P, Fietz H, Hofmeister S, et al. Penetration of bevacizumab through the retina after intravitreal injection in the monkey. Invest Ophthalmol Vis Sci 2007;48:2814–2823 [DOI] [PubMed] [Google Scholar]
- 29.Peters S, Heiduschka P, Julien S, et al. Ultrastructural findings in the primate eye after intravitreal injection of bevacizumab. Am J Ophthalmol 2007;143:995–1002 [DOI] [PubMed] [Google Scholar]
- 30.Peng S, Rahner C, Rizzolo LJ. Apical and basal regulation of the permeability of the retinal pigment epithelium. Invest Ophthalmol Vis Sci 2003;44:808–817 [DOI] [PubMed] [Google Scholar]
- 31.Gonzalez-Mariscal L, Chavez de Ramirez B, Cereijido M. Effect of temperature on the occluding junctions of monolayers of epithelioid cells (MDCK). J Membr Biol 1984;79:175–184 [DOI] [PubMed] [Google Scholar]
- 32.Claude P. Morphological factors influencing transepithelial permeability: a model for the resistance of the zonula occludens. J Membr Biol 1978;39:219–232 [DOI] [PubMed] [Google Scholar]
- 33.Reuss L. Tight junction permeability to ions and water. In: Cereijido M, Anderson JM. eds. Tight Junctions 2nd ed Boca Raton, FL: CRC Press; 2001:61–88 [Google Scholar]
- 34.Tartakoff AM. Laboratory Methods in Vesicular and Vectorial Transport San Diego, CA: Academic Press; 1991. [Google Scholar]
- 35.Eisenman G, Horn R. Ionic selectivity revisited: the role of kinetic and equilibrium processes in ion permeation through channels. J Membr Biol 1983;76:197–225 [DOI] [PubMed] [Google Scholar]
- 36.Van Itallie CM, Holmes J, Bridges A, et al. The density of small tight junction pores varies among cell types and is increased by expression of claudin-2. J Cell Sci 2008;121:298–305 [DOI] [PubMed] [Google Scholar]
- 37.Conn G, Bayne ML, Soderman DD, et al. Amino acid and cDNA sequences of a vascular endothelial cell mitogen that is homologous to platelet-derived growth factor. Proc Natl Acad Sci USA 1990;87:2628–2632 [DOI] [PMC free article] [PubMed] [Google Scholar]
- 38.Keck PJ, Hauser SD, Krivi G, et al. Vascular permeability factor, an endothelial cell mitogen related to PDGF. Science 1989;246:1309–1312 [DOI] [PubMed] [Google Scholar]
- 39.Gamm DM, Melvan JN, Shearer RL, et al. A novel serum-free method for culturing human prenatal retinal pigment epithelial cells. Invest Ophthalmol Vis Sci 2008;49:788–799 [DOI] [PubMed] [Google Scholar]
- 40.Hu J, Bok D. A cell culture medium that supports the differentiation of human retinal pigment epithelium into functionally polarized monolayers. Mol Vis 2001;7:14–19 [PubMed] [Google Scholar]
- 41.Maminishkis A, Chen S, Jalickee S, et al. Confluent monolayers of cultured human fetal retinal pigment epithelium exhibit morphology and physiology of native tissue. Invest Ophthalmol Vis Sci 2006;47:3612–3624 [DOI] [PMC free article] [PubMed] [Google Scholar]
- 42.Rizzolo LJ, Chen X, Weitzman M, Sun R, Zhang H. Analysis of the RPE transcriptome reveals dynamic changes during the development of the outer blood-retinal barrier. Mol Vis 2007;13:1259–1273 [PubMed] [Google Scholar]
- 43.Sun R, Peng S, Chen X, Zhang H, Rizzolo LJ. Diffusible retinal secretions regulate the expression of tight junctions and other diverse functions of the retinal pigment epithelium. Mol Vis 2008;14:2237–2262 [PMC free article] [PubMed] [Google Scholar]
- 44.Gunzel D, Stuiver M, Kausalya PJ, et al. Claudin-10 exists in six alternatively spliced isoforms that exhibit distinct localization and function. J Cell Sci 2009;122:1507–1517 [DOI] [PubMed] [Google Scholar]
- 45.Kannan R, Zhang N, Sreekumar PG, et al. Stimulation of apical and basolateral VEGF-A and VEGF-C secretion by oxidative stress in polarized retinal pigment epithelial cells. Mol Vis 2006;12:1649–1659 [PubMed] [Google Scholar]
- 46.Shi G, Maminishkis A, Banzon T, et al. Control of chemokine gradients by the retinal pigment epithelium. Invest Ophthalmol Vis Sci 2008;49(10):4620–4630 [DOI] [PMC free article] [PubMed] [Google Scholar]
- 47.Bomsel M, Prydz K, Parton RG, Gruenberg J, Simons K. Endocytosis in filter-grown Madin-Darby canine kidney cells. J Cell Biol 1989;109:3243–3258 [DOI] [PMC free article] [PubMed] [Google Scholar]
- 48.Prydz K, Hansen SH, Sandvig K, van Deurs B. Effects of brefeldin A on endocytosis, transcytosis and transport to the Golgi complex in polarized MDCK cells. J Cell Biol 1992;119:259–272 [DOI] [PMC free article] [PubMed] [Google Scholar]
- 49.Wang D, Lehman RE, Donner DB, Matli MR, Warren RS, Welton ML. Expression and endocytosis of VEGF and its receptors in human colonic vascular endothelial cells. Am J Physiol Gastrointest Liver Physiol 2002;282:G1088–G1096 [DOI] [PubMed] [Google Scholar]
- 50.Moromizato Y, Hayashi H, Kato H, Ozaki H, Oshima K. Concentration of vascular endothelial growth factor within the subretinal space and vitreous fluid in rhegmatogenous retinal detachment (in Japanese). Nippon Ganka Gakkai Zasshi 1997;101:498–502 [PubMed] [Google Scholar]
- 51.Su CY, Chen MT, Wu WS, Wu WC. Concentration of vascular endothelial growth factor in the subretinal fluid of retinal detachment. J Ocul Pharmacol Ther 2000;16:463–469 [DOI] [PubMed] [Google Scholar]
- 52.Hou J, Renigunta A, Konrad M, et al. Claudin-16 and claudin-19 interact and form a cation-selective tight junction complex. J Clin Invest 2008;118:619–628 [DOI] [PMC free article] [PubMed] [Google Scholar]
- 53.Hou J, Gomes AS, Paul DL, Goodenough DA. Study of claudin function by RNA interference. J Biol Chem 2006;281:36117–36123 [DOI] [PubMed] [Google Scholar]
- 54.Nakano Y, Kim SH, Kim HM, et al. A claudin-9-based ion permeability barrier is essential for hearing. PLoS Genet 2009;5:e1000610 [DOI] [PMC free article] [PubMed] [Google Scholar]
- 55.Van Itallie CM, Rogan S, Yu A, Vidal LS, Holmes J, Anderson JM. Two splice variants of claudin-10 in the kidney create paracellular pores with different ion selectivities. Am J Physiol Renal Physiol 2006;291:F1288–F1299 [DOI] [PubMed] [Google Scholar]
- 56.Balda MS, Whitney JA, Flores C, González S, Cereijido M, Matter K. Functional dissociation of paracellular permeability and transepithelial electrical resistance and disruption of the apical-basolateral intramembrane diffusion barrier by expression of a mutant tight junction membrane protein. J Cell Biol 1996;134:1031–1049 [DOI] [PMC free article] [PubMed] [Google Scholar]