The accommodation system of 2- to 4-month-old infants compensates for small changes in defocus relative to the typical amounts of hyperopic refractive error found at that age.
Abstract
Purpose.
The goal of this study was to compare objectively the sensitivity of the accommodation system in human infants and adults under binocular and monocular viewing conditions.
Methods.
Full-term infants from 2 to 4 months of age and pre-presbyopic adults were presented with a high-contrast cartoon stimulus moving sinusoidally in diopters around a mean position of 2 D (50 cm). Three stimulus amplitudes were used in one trial (0.25, 0.50, and 0.75 D), with unpredictable stimulus motion during each amplitude change. Eccentric photorefraction was used to record accommodative responses at 25 Hz. The stimulus was made monocular by placing an infrared filter over the right eye, to block visible light but pass the near-infrared wavelength of the photorefractor and allow responses to be recorded from both eyes.
Results.
Fourier analysis was used to determine the accommodative response at the frequency of the stimulus. Significant signal-to-noise ratios indicated that, on average, the 2- to 4-month-old infants generated an accommodative response to at least the 0.75 D amplitude monocular stimulus and the 0.75 and 0.50 D binocular stimuli. Adults responded to the 0.25 D amplitude both binocularly and monocularly.
Conclusions.
In infants 2 to 4 months of age, the developing visual system compensates for small changes in defocus relative to the typical amounts of hyperopic refractive error found at that age.
Many infants are hyperopic1 and, in daily dynamic life, accommodation is therefore necessary to eliminate defocus and improve retinal image quality. Without high spatial frequencies in the retinal image, chronic defocus has the potential to disrupt cortical development,2,3 whereas animal models suggest that it is actually a useful cue for emmetropization.4 Accommodative performance, therefore, has a key role in defining the postnatal visual experience of many infants, and the impact of any experience-dependent developmental processes.
Young infants can accommodate, although their accommodation response is not as accurate as that of adults. Infants less than 2 months of age tend to focus at approximately 30 to 50 cm, irrespective of the target distance, but then start to adjust their response over a range of distances during their third month.5–11 At 2 to 4 months of age, when viewing a static stimulus, they demonstrate accommodative fluctuations with a standard deviation of approximately 0.3 D12 (compared with the adult value of 0.12 D), whereas for binocular dynamic stimuli, they typically initiate an accommodative response within 1 second and are able to track stimuli of different velocities13,14 (compared with typical adult latencies of less than 500 ms15,16).
The visual system's sensitivity to target distance is central to generating accurate accommodation responses and so understanding this sensitivity is central to understanding normal visual experience and clinical abnormalities. Although the adult accommodative system has been shown to be sensitive to a change of approximately 0.1 D in blur,17,18 few studies have been undertaken to explore infants' sensitivity to blur. Atkinson et al.19 showed that 1- to 3-month-old infants could discriminate behaviorally between blurred and sharp images. Two other studies also demonstrated that infants' visual acuity could be reduced by introducing lenses of as little as 1 to 2 D.20,21 These studies are limited in the context of analyses of accommodative performance, however, in that they did not control or measure accommodation, and therefore the data cannot be interpreted in the terms of sensitivity to absolute change in retinal defocus.
For the purposes of this study, the threshold sensitivity of the accommodative system is defined as the smallest change in dioptric distance of a target that results in an accommodative response. The cues used to drive this response could include any information available in the stimulus, for example blur, disparity, proximity, or looming,
Because there is evidence of coupling between accommodation and vergence in infants,14,22–24 disparity cues could play an important role in infants' accommodative activity through the neural cross-link. Hainline et al.10 found that convergence developed before accommodation in a large sample of infants, and Currie and Manny,9 studying accommodative responses in binocular and monocular viewing, suggested that retinal disparity cues may help refine accommodative responses in infants (through vergence; see also Ref. 25).
The goal of our study was to measure the sensitivity of the accommodation system of 2- to 4-month old human infants in both binocular and monocular viewing conditions, to determine their sensitivity in the presence and absence of binocular cues.
Methods
Subjects
Full-term, healthy infants from 2 to 4 months of age (mean, 3.12 months), and pre-presbyopic adults with emmetropia or low myopia (≤1D) were recruited from the local community. None of the subjects had any clinically significant ocular abnormalities. Informed consent was gathered from parents for their infants and from the adults, after the study had been reviewed and approved by the Indiana University Institutional Review Board. The study adhered to the tenets of the Declaration of Helsinki.
Apparatus
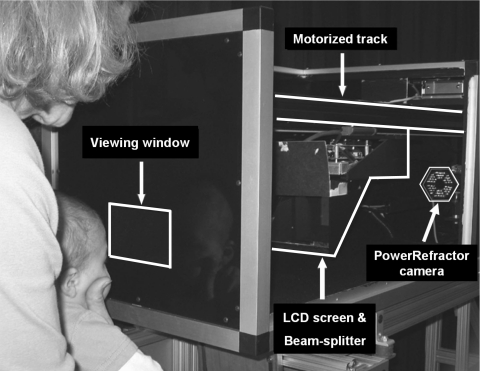
Figure 1 shows a photograph of the apparatus. The infants' accommodative responses were collected with a video-based eccentric photorefractor (PowerRefractor; Multi Channel Systems, Reutlingen, Germany), at a sampling rate of 25 Hz.26,27 Its camera was mounted at a 1-m viewing distance from the subject in a long black box. The subjects were aligned with the box, viewing through a window, and the target was presented to them on an LCD screen (13 × 10 cm) mounted horizontally above the camera axis. The image of this target was reflected to the viewing window with a beamsplitter centered on the camera axis. The sensitivity of the accommodation system was measured by moving the target along a track between the photorefractor camera and the subject, using a motor system that moved the target at velocities defined in diopters per second. The photorefractor recorded eye alignment by Purkinje image eye tracking and the binocular refractive state by eccentric photorefraction. The photorefractor was synchronized with the stimulus motor system to permit simultaneous recording of target position with the eyes' focus and alignment.
Figure 1.
The photorefractor camera was mounted 1 m from the eyes of the subject. An LCD screen and infrared transmitting beamsplitter was moved by a motor system over a range of dioptric distances from 1.1 to 5 D. The target on the LCD screen was presented to the subject by reflection at the beamsplitter.
Stimulus
A high-contrast cartoon picture was used as the target. It subtended 2.3° of visual angle at a 2 D distance (50 cm). The accommodative performance of adults depends on the spatial frequency content of the target,28 and this target had a broadband amplitude spectrum with a slope of −1.48. It was presented at high contrast in an attempt to generate a highly visible naturalistic target containing the spatial information typically available to the accommodative system.29,30 This may not be the truly ideal spatial stimulus to drive an infant's accommodation maximally—the spatial contrast sensitivity function of the infant accommodation system is yet to be understood—but it represents the typical information that the system would be presented with in a naturalistic setting. Presumably, the infants could perform at this level or better when presented with an ideal stimulus.
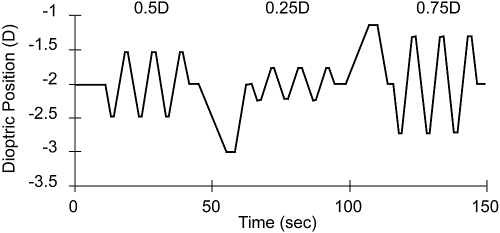
The target started at the baseline 2 D distance from the subject in each trial (i.e., at a 50 cm viewing distance). It remained in that position for a few seconds and was then moved quasisinusoidally with amplitudes of 0.25, 0.5, and 0.75 D (Fig. 2). Each stimulus amplitude was presented for three cycles. The amplitudes were presented in the order 0.5, 0.25, and 0.75 D, and the baseline 2 D distance was chosen to center the stimulus in a typical range for infant activities and behavior. An unpredictable aperiodic stimulus movement was inserted between amplitudes to disturb any responses based on prediction.31 The temporal response function of the adult accommodative system is low-pass, with a cutoff of approximately 1 Hz.32 Using the data of Tondel and Candy13 and assuming that infant accommodation has similar characteristics, we chose a low temporal frequency of 0.1 Hz for the stimulus, but, to explore the influence of temporal frequency, a small amount of data were also collected at 0.4 Hz.
Figure 2.
The accommodative stimulus as a function of time. Three cycles each of three quasisinusoidal amplitudes (0.25, 0.5, and 0.75 D) were presented at 0.1 Hz in each trial. Aperiodic sections were inserted between the different amplitudes to make the stimulus unpredictable and to confirm that the subjects were maintaining active tracking. The stimulus duration at each amplitude was 30 seconds, and the total duration was approximately 135 seconds.
Procedures
Data were collected in a dimly lit room, to reduce the influence of distractions. The mean luminance of the LCD screen was 40 cd/m2. The infant's eyes were aligned with the photorefractor at the correct viewing distance by an experimenter who gently supported the chin to reduce head movements (see Fig. 1).
Experiment 1.
Accommodative responses were measured from 38 infants and 11 adults under binocular viewing conditions.
Control Experiment A for Experiment 1: Binocular Viewing Conditions with a Static Target.
In this control experiment, eight infants and four adults viewed the target binocularly at 50 cm for 30 seconds. This duration was the same as three cycles of the dynamic stimulus and was designed to confirm that infants do not show a response at 0.1 Hz in the absence of the stimulus.
Control Experiment B for Experiment 1: Binocular Viewing Conditions with a Different Stimulus Order.
Although an aperiodic stimulus was inserted between the different stimulus amplitudes to eliminate the influence of the prior amplitude, a few infants (n = 8) completed the same protocol with a shifted stimulus order (0.25, 0.5, and 0.75 D), to determine whether the order of the amplitudes affected the results.
Experiment 2.
Accommodative responses were measured from 34 infants and 9 adults under monocular viewing conditions, for target motion at 0.1 Hz. The monocular viewing condition was created by covering the subject's right eye with an infrared filter (no. 87; Edmund Optics, Barrington, NJ). The infrared filter blocked visible light and passed the near-infrared wavelengths (>760 nm) of the photorefractor light source (>790 nm). In this way, cues dependent on binocular vision were excluded, and their potential contribution to the binocular accommodative response could be assessed by comparing the data to those recorded in experiment 1.
Experiment 3.
A small number of subjects provided data collected binocularly or monocularly for target motion at 0.4 Hz. This experiment was conducted for three reasons: First, the temporal tuning of the 2- to 4-month-old infant accommodation system is unknown, although they do respond to both ramp and step stimuli.13 For adults, performance decreases with increasing temporal frequency.32 Second, the largest amplitude microfluctuations occur at low frequencies (<0.5 Hz, especially around 0.1–0.2 Hz). Collecting data at 0.4 Hz, where microfluctuations are relatively reduced, may decrease their impact on the data.12,33 Third, Schor and Kotulak34 demonstrated that adult subjects do not respond well to low temporal frequencies (0.05 Hz) in monocular viewing.
During the 0.4-Hz trials, only two stimulus amplitudes (0.25 and 0.5 D or 0.5 and 0.75 D) were presented because of limitations of the equipment. Twelve cycles were included at each amplitude so that 30 seconds of data were collected, to be consistent with the 0.1 Hz condition.
Data Analysis
Typically infant data were collected for one condition per visit, due to their short attention span. It was possible for raw data samples to be missing from the photorefractor data, if the pupil size was too small (the photorefractor does not collect data below a 3-mm pupil size) or if an infant subject lost fixation. In addition, individual raw data points were excluded if they fell out of the linear operating range of the photorefractor (−6 to +4 D) or the eye position was greater than ±15° eccentricity from the pupillary axis (to avoid changes in refraction caused by peripheral optics). If less than one third of the possible samples were usable in any condition (750/3 = 250), the full set of data were automatically excluded. Ultimately, binocular data from 33 infants and monocular data from 26 infants were included in the analyses. Similarly, binocular data from 10 adults and monocular data from 8 adults were included (as a result of the pupil size criterion).
The target was moved between 80 and 36 cm (1.25 and 2.75 D), which, if tracked accurately, corresponded to ocular rotations of 2° for a 45 mm interpupillary distance (typical of a 3-month-old, as measured in our laboratory) or 2.7° for a typical adult interpupillary distance of 62 mm. Although the change in refraction with change in eccentricity of the infant eye is currently unknown, these rotations are relatively small.
The data collected for each 30-second stimulus were extracted so that they could be interpreted as a function of stimulus amplitude (0.25, 0.5, or 0.75 D) for each subject. There was no smoothing procedure applied to the data.
Fourier analysis was then conducted on both the stimulus and the response (Fig. 3). The goal was to determine whether the accommodative response amplitude at the stimulus frequency (e.g., 0.1 Hz) was significantly different from the amplitude at other frequencies, indicating a response to the motion of the target.
Figure 3.
Data collected from a 13-week-old infant in the binocular viewing condition. The stimulus amplitude was 0.75 D and its frequency was 0.1 Hz. (A) The 0.75 D stimulus and accommodative response of the left eye. The corresponding amplitude spectra are plotted in (B). The stimulus amplitude and the response amplitude of the left eye are represented.
The significance of an apparent response at the stimulus frequency was evaluated using an estimate of the signal-to-noise ratio (SNR). The response at the stimulus frequency was treated as the signal and responses at adjacent frequencies were used to estimate the noise. For example, for the data collected in experiments 1 and 2, the SNR was defined as the ratio of the amplitude of the accommodative response at 0.1 Hz to the mean amplitude of the responses at the two neighboring frequencies (0.067 and 0.133 Hz).
The criterion for a significant SNR was developed using the data from experiment 1, control experiment A, based on an approach used with VEP data by Norcia and Tyler.35 The data were analyzed by FFT, and the SNR for each subject was calculated for the static target, with no change in accommodative stimulus. The mean log(SNR) of the left eye's response at 0.1 Hz in the absence of the sinusoidal stimulus was −0.05 (SD 0.30) for infants and −0.36 (SD 0.47) for adults. Assuming the log(SNR) is normally distributed, a one-tailed 95% confidence interval provides an SNR criterion for infants of 2.8 (log(SNR) + 1.65 · SD is 0.447; 100.447 = 2.80) and an adult criterion SNR of 2.5 (log(SNR) + 1.65 · SD is 0.406; 100.406 = 2.5). Therefore, an SNR ≥2.8 was used as the criterion to define a significant accommodative response at 0.1 Hz in the presence of the stimulus in the infants, and 2.5 was used for adults. The corresponding values at 0.4 Hz were 2.8 for infants and 3.0 for adults.
Results
Data were collected from 38 infants, and usable data were provided by 33 of them in the binocular viewing condition (0.1 Hz) in experiment 1. Data were collected from 34 infants, and usable data were collected from 26 of them in the monocular viewing condition (0.1 Hz) in experiment 2. Only data from left eyes will be reported, as the right eye was occluded in the monocular viewing condition.
In Figure 3A, it can be seen that a sample infant (JD) responded with changes in accommodation to the motion of the 0.75-D stimulus presented at 0.1 Hz. The response shown in the figure was typical of all subjects, in that it followed the stimulus with a tracking profile and short latency. The SNR at 0.1 Hz was 3.8 in the left eye and 4.6 in the right eye, which were both larger than the criterion of 2.8. These accommodative responses were therefore viewed as significant.
Experiment 1: Binocular Viewing Conditions at 0.1 Hz
The back-transformed mean log(SNR) for individual infants' left eyes was 1.3 (mean −1 SD = 0.7, mean +1 SD = 2.2) for the 0.25 D stimulus, 2.1 (mean –1 SD = 0.9, mean +1 SD = 5.2) for the 0.5 D stimulus, and 2.8 (mean −1 SD = 1.3, mean +1 SD = 5.9) for the 0.75 D stimulus, in the binocular viewing condition. The back-transformed mean log(SNR) for individual adults' left eyes was 4.2 (mean −1 SD = 2.4, mean +1 SD = 7.3) for the 0.25 D stimulus, 9.4 (mean – 1 SD = 5.0, mean +1 SD = 17.7) for the 0.5 D stimulus, and 11.7 (mean −1 SD = 7.2, mean +1 SD = 19.0) for the 0.75 D stimulus, in the binocular viewing condition.
The SNRs of the individual subjects were also examined as a function of stimulus amplitude. Five infants generated nonsignificant SNRs at all stimulus amplitudes, and nine infants produced nonmonotonic functions in that their responses did not remain above the 2.8-threshold criterion with increase in stimulus amplitude. In the group that produced SNRs that remained above criterion once the threshold was reached, 1 infant achieved it at 0.25 D, 8 reached it at 0.50 D, and 10 reached it at 0.75 D. These numbers are shown in parentheses in each cell in Table 1. There were no adults who produced nonmonotonic functions and they all generated SNRs that met the criterion. Nine responses reached threshold at 0.25 D, and the other one reached it at 0.5 D.
Table 1.
Summary of the SNRs from the FFT Analyses
| Viewing Condition | Group (Number of Subjects) | OS |
||
|---|---|---|---|---|
| 0.25 D | 0.50 D | 0.75 D | ||
| Binocular (0.1 Hz) | Infant (n = 33) | 1.3 (0) | 3.5 (8)* | 10.5 (10)* |
| Adult (n = 10) | 11.9 (7)* | 19.9 (2)* | 21.0 (1)* | |
| Monocular (0.1 Hz) | Infant (n = 26) | 0.9 (0) | 1.2 (0) | 7.3 (3)* |
| Adult (n = 8) | 8.4 (4)* | 16.9 (2)* | 17.5 (1)* | |
| Binocular (0.4 Hz) | Infant (n = 5) | 5.0 (1)* | 8.15 (4)* | NA |
| Adult (n = 4) | 4.3 (3)* | 6.4 (1)* | NA | |
| Monocular (0.4 Hz) | Infant (n = 6) | NA | 2.2 (0) | 4.4 (2)* |
| Adult (n = 4) | 5.45 (4)* | 6.6 (0)* | NA | |
The first value in each cell is the SNR for the averaged group raw data under binocular or monocular viewing conditions. The second value, in parentheses, is the number of individuals who reached a significant response at each stimulus amplitude (these subjects also maintained significant responses at the larger stimulus amplitudes). NA, no data available.
Significant response, based on the static data criteria of 2.8 for infants and 2.5 for adults at 0.1 Hz, and 2.8 for infants and 3.0 for adults at 0.4 Hz.
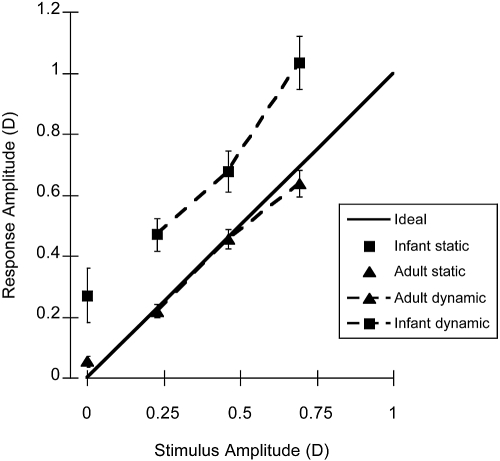
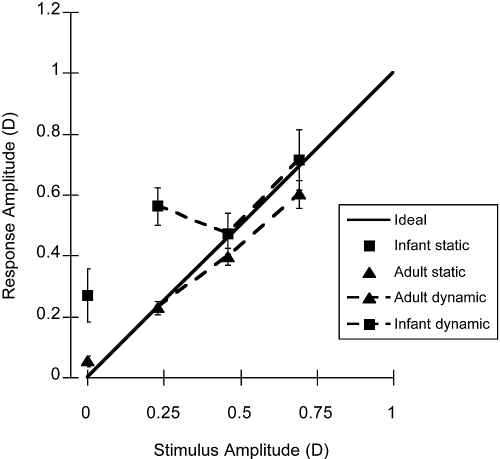
A summary of the amplitude at 0.1 Hz from the FFT analyses of the individual data during binocular viewing is presented in Figure 4. It demonstrates that the mean infant response amplitude was larger than the stimulus amplitude, unlike that of the adults, whose responses were relatively well matched to the stimulus. This difference could be related in part to the calibration of the photorefractor, as the instrument was not calibrated for each individual in this study. Our previous work suggests that the infant calibration slopes may have been higher for the infant group than the adult group.36
Figure 4.
The mean amplitudes at 0.1 Hz from the FFTs of the individual raw infant and adult data collected in binocular viewing conditions. Solid line: a response that equals the stimulus, an accurate response. The symbols plotted at a stimulus amplitude of 0 show the data collected in the static target control condition (experiment 1A). Error bars, SEM.
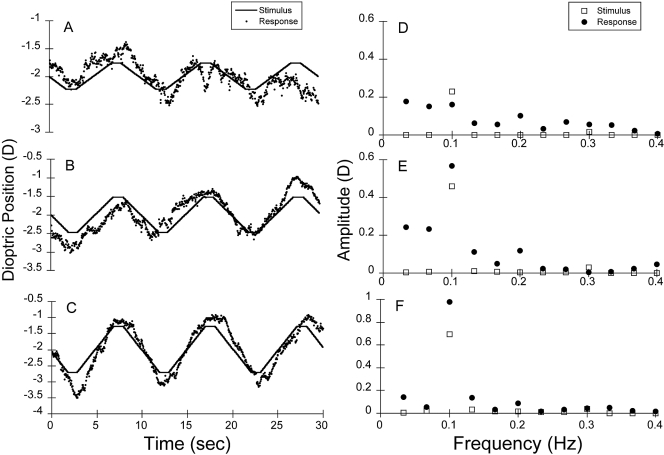
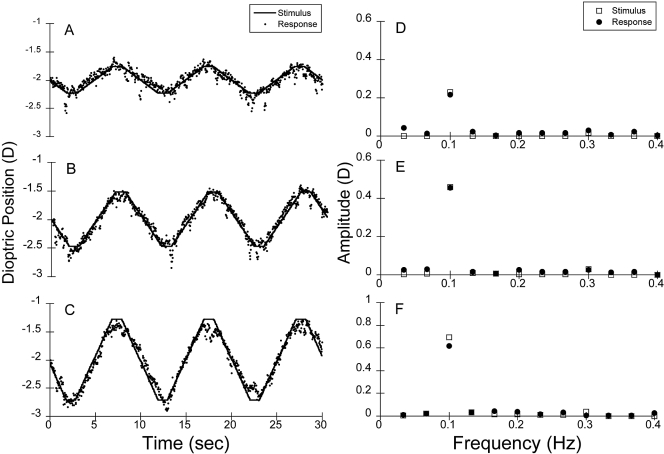
Figure 3B, demonstrates that the data from individual infants were noisy, with energy distributed over a range of frequencies (including higher harmonics of the stimulus frequency). Therefore, an additional analysis was performed for each stimulus amplitude, as follows: The infants' raw data were averaged across individuals for each amplitude, with the individual's mean value adjusted to −2 D and no compensation for any phase differences (as shown in Figs. 5A–C for infants and Figs. 6A–C for adults). An FFT was then performed on the averaged data (as shown in Figs. 5D–F for infants and Figs. 6D–F for adults) and the SNRs calculated. These pooled group data SNRs are summarized in Table 1. The SNR of the pooled raw infant data were greater than 2.8 for the 0.5 and 0.75 D amplitude stimuli, but not for the 0.25 D stimulus. The right eye data showed the same effect. The corresponding adult values were greater than 2.5 for all the stimulus amplitudes (see Table 1).
Figure 5.
Pooled infant raw data at (A) 0.25, (B) 0.50, and (C) 0.75 D from the left eyes of all the infant subjects (n = 33) for the binocular stimulus presented at 0.1 Hz. (D–F) The corresponding amplitude spectra from the FFT analyses. The stimulus is plotted in each case for comparison. The SNRs were 1.3, 3.5, and 10.5, respectively, for the 0.25, 0.5, and 0.75 D stimuli.
Figure 6.
Pooled adult raw data at (A) 0.25 (B) 0.50, (C) 0.75 D from the left eyes of all the adult subjects (n = 10) for the binocular stimulus presented at 0.1 Hz. (D–F) Corresponding amplitude spectra from the FFT analysis. The stimulus is plotted in each case for comparison. The SNRs were 11.9, 19.9, and 21.0, respectively, for the 0.25, 0.5, and 0.75 D stimuli.
Control Experiment B: Binocular Viewing Conditions with a Different Stimulus Order
For the adjusted stimulus order, the back-transformed mean log(SNR) for individual infants' left eyes was 0.6 (mean −1 SD = 0.2, mean +1 SD = 1.7) for the 0.25 D stimulus, 1.5 (mean −1 SD = 0.7, mean +1 SD = 3.5) for the 0.5 D stimulus, and 2.1 (mean −1 SD = 0.6, mean +1 SD = 7.3) for the 0.75 D stimulus, in the binocular viewing condition. The FFT performed on the pooled raw data provided significant responses to the 0.5 D (SNR = 3.3) and 0.75 D (SNR = 6.7) stimuli. The response to 0.25 D (SNR = 1.0) was not significant. These data are consistent with the data in Figure 5. Thus, the manipulation of the order of the stimulus levels had a minimal effect on the results.
Experiment 2: Monocular Viewing Conditions at 0.1 Hz
Binocular cues, including disparity, were uninformative about the stimulus when the subjects were placed in monocular viewing conditions. Data collection was typically more difficult than in binocular viewing conditions, as many infants objected to having one eye covered.
The back-transformed mean log(SNR) for individual infants' left eyes was 0.9 (mean −1 SD = 0.5, mean +1 SD = 1.5) for the 0.25 D stimulus, 0.8 (mean −1 SD = 0.5, mean +1 SD = 1.5) for the 0.5 D stimulus, and 1.1 (mean −1 SD = 0.4, mean +1 SD = 3.1) for the 0.75 D stimulus in these conditions. The back-transformed mean log(SNR) for individual adults' left eyes was 5.0 (mean −1 SD = 3.3, mean +1 SD = 7.5) for the 0.25 D stimulus, 6.9 (mean −1 SD = 3.0, mean +1 SD = 15.9) for the 0.5 D stimulus, and 9.4 (mean −1 SD = 5.8, mean +1 SD = 15.2) for the 0.75 D stimulus.
With regard to the individual subjects' functions, 19 infants produced no response above the criterion, 1 was nonmonotonic, and 6 reached the threshold at 0.75 D. In the adult group, there were no subjects without suprathreshold responses, one with a nonmonotonic function, and seven who reached an SNR of at least 2.5 at 0.25 D.
A summary of the FFT amplitudes of individual subjects at 0.1 Hz in the monocular viewing condition is shown in Figure 7 and demonstrates that the infant and adult values are typically close to the stimulus amplitude, except for the infants at 0.25 D.
Figure 7.
Mean FFT amplitudes at 0.1 Hz for the infant and adult individual data in monocular viewing conditions. Solid line: a response that equals the stimulus. The symbols plotted at a stimulus amplitude of 0 show the data collected when the target was static in the control experiment in binocular viewing (experiment 1A). Error bars, SEM.
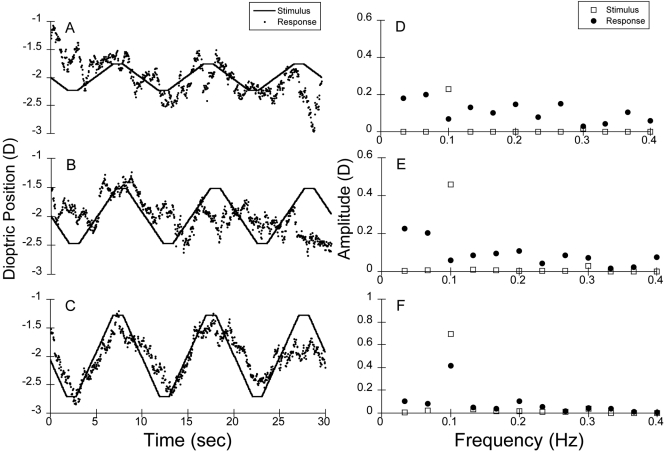
The results of the pooled raw data group-based analysis for infant monocular viewing are shown in Figure 8. As demonstrated by the SNRs presented in Table 1, the group-based infant response to the 0.75-D stimulus was significant, whereas their responses to 0.25 and 0.5 D were not. In comparison, the adult subjects responded to all the stimulus levels significantly.
Figure 8.
Pooled raw data for the monocular viewing condition at (A) 0.25, (B) 0.50, and (C) 0.75 D from the left eyes of the infant subjects (n = 26), compared with the stimulus. (D–F) Corresponding amplitude spectra from the FFT analyses compared with the stimuli. The SNRs were 0.9, 1.2, and 7.3, respectively, for 0.25, 0.5, and 0.75 D stimulus amplitudes.
Experiment 3: Data Collected at 0.4 Hz
Data from 11 infants and 4 adults were collected at 0.4 Hz. Data from five infants and four adult subjects were collected in binocular viewing conditions, and data from six infants and four adults were collected in monocular viewing conditions. FFT analyses were performed on the group-averaged raw data, similar to the analyses of the data collected at 0.1 Hz. The resulting SNRs are shown in Table 1. The infant binocular 0.4 Hz SNRs were higher than those in the 0.1 Hz condition, and the response was significant at the 0.25 D stimulus level. The monocular data are consistent with the 0.1 Hz data, however, and only 0.75 D reached significance. The adults demonstrated significant responses to both stimulus levels (0.25 and 0.5 D) under both binocular and monocular viewing conditions. The number of subjects reaching the threshold criteria of 2.8 for infants and 3.0 for adults, as a function of stimulus amplitude, is shown in parentheses in Table 1.
Discussion
When compared with the static target condition, adults generated significant responses to all the stimulus amplitudes at 0.1 Hz in both binocular and monocular conditions. Consistent with the literature, the subjects showed accommodative responses to stimuli of ≥ ±0.25 D (Winn et al.18: ±0.1 D; Schor and Kotulak,34: ±0.12–0.14 D). The group-averaged raw data and individual functions suggest that, at the group level, by 2 to 4 months, infants can respond to the 0.5 and 0.75 D stimulus amplitudes binocularly, but they may not be able to track the ±0.25 D stimulus modulation at 0.1 Hz. Also, based on the group-averaged raw data, the infants responded to the 0.75 D stimulus amplitude monocularly. Thus, these results indicate that the infant accommodative sensitivity is on the order of ±0.5 D or better binocularly and ±0.75 D monocularly. Although the noise in the individual functions may have masked small responses, and the group-averaged data may have reduced the apparent noise to levels below that experienced by any individual subject, the fact that the individual infants were capable of discriminating the finer structure of the stimulus profile (e.g., Fig. 3) suggests that they were, in fact, capable of responding to smaller changes in the stimuli than the full amplitude of the stimulus sinusoid. The infants also demonstrated finer discrimination in the 0.4 Hz condition in that the group average SNR was significant at 0.25 D for binocular viewing. Without careful individual calibration, it was not possible to confirm that the infants were responding to precisely these levels of defocus in the absolute sense. They could have had a small constant mean bias or error relative to the stimulus, for example. However, the data do demonstrate discrimination of blur on the scale provided by these stimuli.
In addition, the infant binocular response amplitude was larger than that found in monocular viewing conditions. This result agrees with the observation that accommodation in uninstructed adults is reduced in gain if one eye is occluded24 and with the findings in two studies showing the same result in infants.24,25 The increased noise and apparently reduced signal amplitude both had the effect of reducing the SNR in monocular viewing conditions.
Generally, the infants' data were noisier than the adults'. The infants' amplitudes at the stimulus frequency were also more variable than those of adults (the SD of the infant data were approximately four times that of adults). There are several possible sources of this noise beyond instrument noise in the photorefractor estimates, which has a power of approximately 0.2 D2 at low frequencies.12 First, the infants' responses to the static stimulus were also more variable than that of the adults (the SD of the infants' amplitude at 0.1 Hz (0.27) was five times of that of adults (0.045) even after being calibrated with the mean slopes (infant, 1.1; adult, 0.92).36 This result could be due to the elevated accommodative microfluctuations of infants compared with that of adults.12 Second, it is feasible that infants attended to the target less frequently than adults, and therefore the data may include measurements of peripheral optics, although all data collected beyond 15° eccentricity were excluded.
Empirical Data Compared with Theoretical Prediction
A study of visual acuity as a function of changing target viewing distance found that 1- to 2-month-old infants' visual acuity did not change with target distance.37 This result suggested that infants either changed their accommodation, or they had a large depth of focus (DOF) over which their acuity was constant.37 Green et al.,38 after noting that the slope of infants' accommodative response functions are shallow, explored the DOF question. They predicted infants' accommodative behavior based on assumptions that (1) infants' accommodative DOF depends on their FPL (forced-choice preferential-looking) visual acuity and (2) the just-detectable blur circle diameter on the retina equals eight tenths of the stripe width at their FPL acuity. The equation was as follows:
 |
where ΔD is depth of focus in diopters, P is pupil diameter in mm, and V is visual acuity in cycles per degree. Based on this equation, the DOF of younger infants should be larger than that of adults, due to their smaller pupil size and poorer visual acuity.
DOF predictions, based on the equation of Green et al.38 are given in Table 2 and compared with the results from the present study. The predictions are in relatively good agreement with the stimulus amplitudes that resulted in significant SNRs and also as noted by Green et al.,38 with estimates of 3-month-olds' accommodative lags measured with objective retinal reflection techniques such as retinoscopy.
Table 2.
Predictions for the DOF of 3-Month-Old Infants
| FPL Visual Acuity (cpd) | Mean pupil Size (mm) | DOF Prediction (D) | DOF Measured (D) |
||
|---|---|---|---|---|---|
| 0.1 Hz | 0.4 Hz | ||||
| Monocular infant (2.5 mo) | 2.16 ± 0.4339 | 5.4 ± 0.5 | 0.6 | 0.75 | 0.5 |
| Monocular infant (4 mo) | 2.68 ± 0.4739 | 5.4 ± 0.5 | 0.5 | 0.75 | 0.5 |
| Binocular infant (3 mo) | 4–4.540 | 4.8 ± 0.7 | 0.4 | 0.5 | 0.25 |
| Adult | 3040 | 5.7 ± 1.0 | 0.04 | 0.25 | 0.25 |
Based on the equation of Green et al.38
The agreement between these datasets does not address the finer structure of the infants' responses in the present study, however. Individual infants demonstrated sensitivity to changes in the stimulus that are smaller than the stimulus amplitude, at the reversal of stimulus direction for example (Fig. 3). It is feasible that the blur discrimination of the infant accommodation system is greater than that predicted by Green et al.38 for several reasons. The validity of the first assumption of Green et al.38 about the dependence on FPL acuity depends on the sensitivity or maturity of the sensory pathway into the accommodative system. If the accommodative system receives sensory information from earlier stages of processing than those limiting the FPL acuity estimates, it would be possible for the accommodative system to be more sensitive than represented in FPL acuity data.41–43 Also, the infants' performance in this study could reflect the contribution of any cue capable of driving the accommodative system, such as disparity or looming, for example. Thus, the present study suggests that the prediction of Green et al.38 may be a conservative estimate of the sensitivity of the infant accommodative system.
Effects of Accommodative Sensitivity on Retinal Image Quality
The data collected in our study suggest that 2- to 4-month-old infants' accommodative sensitivity is 0.5 D or better in binocular viewing and 0.75 D or better in monocular viewing. Although this difference in SNR could result from increased noise in the monocular condition, it may also reiterate that binocular cues play an important role in refining the accommodative response and consequently that retinal image quality in binocular conditions may be better than in monocular viewing.
Infants are typically hyperopic,1 with a mean value near birth of approximately 2 D (SD ±2 D). Therefore, the results of this study of naturalistic binocular viewing conditions suggest that the 2- to 4-month-old accommodative system can largely eliminate the retinal defocus resulting from typical refractive errors and viewing distances and that these infants are typically not obliged to experience prolonged periods of defocus.
Acknowledgments
The authors thank Diane Goss for assistance with subject recruitment; Bill Monette for building the equipment; Kate Gray, OD, Shrikant Bharadwaj, BS Optom, PhD, and Pamela Blade for helping with data collection; Geoffrey P. Bingham, PhD, for helpful discussion about the stimulus design; and the Visual Optics Group at Indiana University for general discussions.
Footnotes
Supported by National Institutes of Health Grant EY-014460 (TRC).
Disclosure: J. Wang, None; T.R. Candy, None
References
- 1.Mayer DL, Hansen RM, Moore BD, Kim S, Fulton AB. Cycloplegic refractions in healthy children aged 1 through 48 months. Arch Ophthalmol 2001;119:1625–1628 [DOI] [PubMed] [Google Scholar]
- 2.Hubel DH, Wiesel TN. Effects of monocular deprivation in kittens. Naunyn Schmiedebergs Arch Exp Pathol Pharmakol 1964;248:492–497 [DOI] [PubMed] [Google Scholar]
- 3.Smith EL, 3rd, Hung LF, Harwerth RS. The degree of image degradation and the depth of amblyopia. Invest Ophthalmol Vis Sci 2000;41:3775–3781 [PubMed] [Google Scholar]
- 4.Hung LF, Crawford ML, Smith EL. Spectacle lenses alter eye growth and the refractive status of young monkeys. Nat Med 1995;1:761–765 [DOI] [PubMed] [Google Scholar]
- 5.Aslin RN, Shea SL, Metz HS. Use of the Canon R-1 Autorefractor to measure refractive errors and accommodative responses in infants. Clin Vis Sci 1990;5:61–70 [Google Scholar]
- 6.Banks MS. The development of visual accommodation during early infancy. Child Dev 1980;51:646–666 [PubMed] [Google Scholar]
- 7.Braddick O, Atkinson J, French J, Howland HC. A photorefractive study of infant accommodation. Vision Res 1979;19:1319–1330 [DOI] [PubMed] [Google Scholar]
- 8.Brookman KE. Ocular accommodation in human infants. Am J Optom Physiol Opt 1983;60:91–99 [DOI] [PubMed] [Google Scholar]
- 9.Currie DC, Manny RE. The development of accommodation. Vision Res 1997;37:1525–1533 [DOI] [PubMed] [Google Scholar]
- 10.Hainline L, Riddell P, Grose-Fifer J, Abramov I. Development of accommodation and convergence in infancy. Behav Brain Res 1992;49:33–50 [DOI] [PubMed] [Google Scholar]
- 11.Haynes H, White BL, Held R. Visual accommodation in human infants. Science 1965;148:528–530 [DOI] [PubMed] [Google Scholar]
- 12.Candy TR, Bharadwaj SR. The stability of steady state accommodation in human infants. J Vision 2007;7:1–16 [DOI] [PMC free article] [PubMed] [Google Scholar]
- 13.Tondel GM, Candy TR. Human infants' accommodation responses to dynamic stimuli. Invest Ophthalmol Vis Sci 2007;48:949–956 [DOI] [PMC free article] [PubMed] [Google Scholar]
- 14.Tondel GM, Candy TR. Accommodation and vergence latencies in human infants. Vision Res 2008;48:564–576 [DOI] [PMC free article] [PubMed] [Google Scholar]
- 15.Campbell FW, Westheimer G. Dynamics of accommodation responses of the human eye. J Physiol 1960;151:285–295 [DOI] [PMC free article] [PubMed] [Google Scholar]
- 16.Shirachi D, Liu J, Lee M, Jang J, Wong J, Stark L. Accommodation dynamics: I, range nonlinearity. Am J Optom Physiol Opt 1978;55:631–641 [DOI] [PubMed] [Google Scholar]
- 17.Kotulak JC, Schor CM. The accommodative response to subthreshold blur and to perceptual fading during the Troxler phenomenon. Perception 1986;15:7–15 [DOI] [PubMed] [Google Scholar]
- 18.Winn B, Charman WN, Pugh JR, Heron G, Eadie AS. Perceptual detectability of ocular accommodation microfluctuations. J Opt Soc Am A 1989;6:459–462 [DOI] [PubMed] [Google Scholar]
- 19.Atkinson J, Braddick O, Moar K. Infants' detection of image defocus. Vision Res 1977;17:1125–1126 [DOI] [PubMed] [Google Scholar]
- 20.Boltz RL, Manny RE, Katz BJ. Effects of induced optical blur on infant visual acuity. Am J Optom Physiol Opt 1983;60:100–105 [DOI] [PubMed] [Google Scholar]
- 21.Powers MK, Dobson V. Effect of focus on visual acuity of human infants. Vision Res 1982;22:521–528 [DOI] [PubMed] [Google Scholar]
- 22.Aslin RN, Jackson RW. Accommodative-convergence in young infants: development of a synergistic sensory-motor system. Can J Psychol 1979;33:222–231 [DOI] [PubMed] [Google Scholar]
- 23.Bobier WR, Guinta A, Kurtz S, Howland HC. Prism induced accommodation in infants 3 to 6 months of age. Vision Res 2000;40:529–537 [DOI] [PubMed] [Google Scholar]
- 24.Turner JE, Horwood AM, Houston SM, Riddell PM. Development of the response AC/A ratio over the first year of life. Vision Res 2002;42:2521–2532 [DOI] [PubMed] [Google Scholar]
- 25.Bharadwaj SR, Candy TR. Cues for the control of ocular accommodation and vergence during postnatal human development. J Vision 2008;8:14 11–16 [DOI] [PMC free article] [PubMed] [Google Scholar]
- 26.Choi M, Weiss S, Schaeffel F, et al. Laboratory, clinical, and kindergarten test of a new eccentric infrared photorefractor (PowerRefractor). Optom Vis Sci 2000;77:537–548 [DOI] [PubMed] [Google Scholar]
- 27.Schaeffel F, Wilhelm H, Zrenner E. Inter-individual variability in the dynamics of natural accommodation in humans: relation to age and refractive errors. J Physiol 1993;461:301–320 [DOI] [PMC free article] [PubMed] [Google Scholar]
- 28.Charman WN, Tucker J. Accommodation as a function of object form. Am J Optom Physiol Opt 1978;55:84–92 [DOI] [PubMed] [Google Scholar]
- 29.Ciuffreda KJ. The Glenn A. Fry invited lecture: accommodation to gratings and more naturalistic stimuli. Optom Vis Sci 1991;68:243–260 [DOI] [PubMed] [Google Scholar]
- 30.Charman WN, Tucker J. Dependence of accommodation response on the spatial frequency spectrum of the observed object. Vision Res 1977;17:129–139 [DOI] [PubMed] [Google Scholar]
- 31.van der Wildt GJ, Bouman MA, van de Kraats J. The effect of anticipation on the transfer function of the human lens system. Optica Acta 1974;21843–860 [Google Scholar]
- 32.Kruger PB, Pola J. Stimuli for accommodation: blur, chromatic aberration and size. Vision Res 1986;26:957–971 [DOI] [PubMed] [Google Scholar]
- 33.Charman WN, Heron G. Fluctuations in accommodation: a review. Ophthalmic Physiol Opt 1988;8:153–164 [DOI] [PubMed] [Google Scholar]
- 34.Schor CM, Kotulak JC. Dynamic interactions between accommodation and convergence are velocity sensitive. Vision Res 1986;26:927–942 [DOI] [PubMed] [Google Scholar]
- 35.Norcia AM, Tyler CW. Spatial frequency sweep VEP: visual acuity during the first year of life. Vision Res 1985;25:1399–1408 [DOI] [PubMed] [Google Scholar]
- 36.Blade PJ, Candy TR. Validation of the Photorefractor for measuring human infant refraction. Optom Vis Sci 2006;83:346–353 [DOI] [PMC free article] [PubMed] [Google Scholar]
- 37.Salapatek P, Bechtold AG, Bushnell EW. Infant visual acuity as a function of viewing distance. Child Dev 1976;47:860–863 [PubMed] [Google Scholar]
- 38.Green DG, Powers MK, Banks MS. Depth of focus, eye size and visual acuity. Vision Res 1980;20:827–835 [DOI] [PubMed] [Google Scholar]
- 39.Mayer DL, Beiser AS, Warner AF, Pratt EM, Raye KN, Lang JM. Monocular acuity norms for the Teller Acuity Cards between ages one month and four years. Invest Ophthalmol Vis Sci 1995;36:671–685 [PubMed] [Google Scholar]
- 40.Banks MS, Salapatek P. Acuity and contrast sensitivity in 1-, 2-, and 3-month-old human infants. Invest Ophthalmol Vis Sci 1978;17:361–365 [PubMed] [Google Scholar]
- 41.Banks MS, Bennett PJ. Optical and photoreceptor immaturities limit the spatial and chromatic vision of human neonates. J Opt Soc Am A 1988;5:2059–2079 [DOI] [PubMed] [Google Scholar]
- 42.Brown AM, Dobson V, Maier J. Visual acuity of human infants at scotopic, mesopic and photopic luminances. Vision Res 1987;27:1845–1858 [DOI] [PubMed] [Google Scholar]
- 43.Wilson HR. Development of spatiotemporal mechanisms in infant vision. Vision Res 1988;28:611–628 [DOI] [PubMed] [Google Scholar]


