The accuracy achieved in single-pulse pump-probe Laue experiments at beamline 14-ID at APS is estimated to be 3–4%.
Keywords: single-pulse diffraction, accuracy, Laue method, RATIO method, photo-crystallography
Abstract
The accuracy that can be achieved in single-pulse pump-probe Laue experiments is discussed. It is shown that with careful tuning of the experimental conditions a reproducibility of the intensity ratios of equivalent intensities obtained in different measurements of 3–4% can be achieved. The single-pulse experiments maximize the time resolution that can be achieved and, unlike stroboscopic techniques in which the pump-probe cycle is rapidly repeated, minimize the temperature increase due to the laser exposure of the sample.
1. Introduction
Time-resolved diffraction is a prime technique for elucidating the geometry of very short-lived species. Whereas for states with lifetimes of microseconds or longer monochromatic techniques can be employed, flux limitations dictate a more efficient use of the available photons for species with shorter lifetimes. This means that polychromatic techniques must be employed at synchrotron sources as has commonly been the practice in time-resolved studies of macromolecular complexes even at lower time-resolution (Bourgeois et al., 2007 ▶; Moffat, 2001 ▶). Laue techniques suffer from certain drawbacks related to the need for taking into account the wavelength dependence of scattering processes and the often extended spot shapes. As accuracy requirements are more severe for the detailed study of chemical processes at atomic resolution, optimization of data collection and processing methods is of prime importance.
In an earlier publication we have discussed use of the RATIO method in which synchrotron-collected intensity ratios are combined with an accurate monochromatic data set to eliminate the dependence of the final data on the spectral distribution and long-term fluctuations in the X-ray intensity at the crystal (Coppens et al., 2009 ▶). We describe here an assessment of the reproducibility of data collected with a carefully tuned beam and processed with the RATIO method combined with the seed-skewness technique for spot integration (Bolotovsky & Coppens, 1997 ▶; Bolotovsky et al., 1995 ▶).
2. Experimental
2.1. The Laue experiments
Experiments were performed at the 14-ID BioCARS beamline at the Advanced Photon Source (APS) (Graber et al., 2009 ▶) using the first harmonic of the undulator beamline, tuned to a peak wavelength of 16 keV. X-ray exposure for each frame was limited to a single pulse of length 100 ps applied with a delay time of 100 ps after the laser pulse. The data were collected in ϕ-scan mode, starting from 0° with increments of 1° from frame to frame. The second harmonic of a picosecond Ti:sapphire laser with λ = 390 nm was focused on the crystal, giving an incident energy on the crystal of 3–4.8 mJ mm−2. The laser pulse was stretched to 35 ps to reduce radiation damage in the crystal.
The laser-ON/laser-OFF frame sequences for each of the two 100 K experiments reported here are summarized in Table 1 ▶, in which ON and OFF represent laser light-ON and -OFF frames. In some additional experiments, not reported here, the crystal quality deteriorated before a sufficient number of frames could be collected.
Table 1. Laser-ON/laser-OFF sequences and number of acceptable frames for the data collections (OFF, light-OFF frame; ON, light-ON frame).
| Experiment number | Sequence | Number of good frames |
|---|---|---|
| 1 | OFF1/OFF2/ON1/ON2/OFF3/OFF4 | 70 |
| 2 | OFF1/ON1/OFF2/ON2/OFF3/ON3/OFF4 | 181 |
After the first series of experiments, extra care was taken in aligning the crystal center of mass to the peak of the vertical focus of the X-ray beam, leading to a significant improvement in data collection accuracy as discussed below. The maximum linear dimension of the samples varied between 40 and 60 µm.
2.2. Check of beam stability
At the heart of single-pulse isolation at BioCARS is the ‘Jülich’ chopper. Within the chopper housing, a rotor spins in vacuum at a rate of 59244 r.p.m. and produces opening times as short as 200 ns which modulate the incoming X-ray beam. Details regarding the overall design of the chopper and, specifically, the rotor can be found in Wulff et al. (2002 ▶) and Cammarata et al. (2009 ▶). Because the temporal width of an X-ray pulse at the APS is ∼100 ps, the rotor tip, which is moving at a tangential velocity of 520 m s−1, travels only 52 nm in 100 ps. Therefore, during the time a pulse passes through it, the chopper can be considered as a stationary slit with 100 µm vertical width. A slit located downstream of the chopper is typically set to 70 µm vertically to clean up scatter from the rotor. This slit size is somewhat larger than the ∼40 µm vertical size of the X-ray beam at this point. In the measurements described below, this clean-up slit was used to determine intensity fluctuation owing to jitter in the spatial position and profile of the X-ray beam as a function of slit and beam size. Since the slit is the limiting aperture, intensity fluctuations caused by the chopper should be minimal. We have verified that no leakage radiation from adjacent electron bunches is present during the measurements.
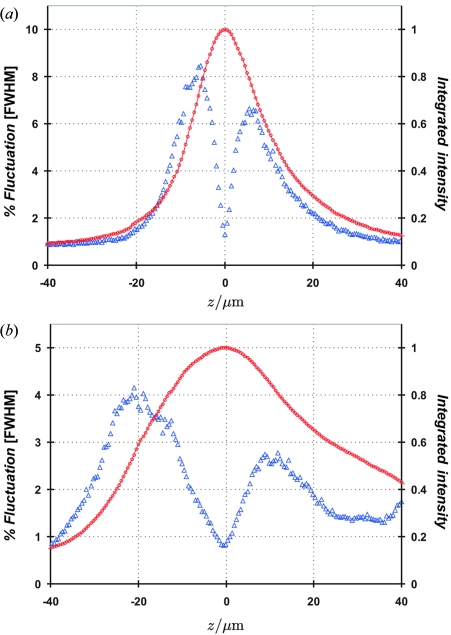
Fig. 1 ▶ shows the results of two scans in which the vertical position of the X-ray beam was scanned over the clean-up slit which was set at fixed vertical widths of 10 µm and 40 µm in two different runs. The beam rather than the slit was scanned since moving the slit would allow large-angle X-ray scatter caused by the chopper to reach the detector. For these measurements, 100 X-ray pulses were recorded and integrated for each point of the scan, using a LeCroy Wave Surfer digital oscilloscope. Twelve such scans were repeated and added together to improve counting statistics. The value of each integrated pulse is proportional to the charge collected in a diode detector and hence to the number of photons in a single 100 ps X-ray pulse. A statistical package on the oscilloscope internally calculates the standard deviation in the mean intensity for a series of pulses which is read out by computer. This number is divided by the peak beam intensity and multiplied by 2(2ln2)1/2 ≃ 2.355 (FWHM conversion) yielding a measure of the percent fluctuation in intensity as a function of beam mis-alignment from the slit center. The red line in Fig. 1 ▶ shows the mean value of the intensity averaged over 1200 pulses (right ordinate), plotted against the peak position of the X-ray beam. The FWHM intensity fluctuation (left ordinate) measured for 1200 pulses is plotted with solid blue circles. Panel (a) shows an X-ray beam with a vertical width of 18 µm FWHM scanned through a 10 µm vertical slit opening and panel (b) shows the same scan taken with a 40 µm FWHM beam through a vertical slit opening of 40 µm. The 40 µm slit size was chosen to match the diameter of a typical crystal such that intensity fluctuations measured after the slit would be similar to those in the diffracted intensity from a crystal. In this way, these tests simulated the experimental conditions assuming a 40 µm crystal and a 40 µm X-ray beam size.
Figure 1.
Two scans of beam position are shown for a vertical X-ray beam width of 18 µm FWHM scanned through a 10 µm vertical slit opening (a) and a 40 µm FWHM beam width through a vertical slit opening of 40 µm (b). The right-hand ordinate gives the mean intensity and is shown by the small red circles. The left-hand ordinate shows the FWHM intensity fluctuation and is plotted with blue triangles.
The two most prominent features in these plots are that the curves are bimodal and the slope near the minimum (located at z = 0) is greater than that on the tail side of the peaks. The difference in amplitude of the two peaks arises from the asymmetry in the vertical focus of the X-ray beam. For a symmetric beam profile such as a Gaussian they would have equal amplitude. The local minimum at z = 0 gives the minimum in intensity fluctuation for a perfectly centered beam and is 1.3% for panel (a) and 0.82% for the 40 µm beam in panel (b). A maximum of 8% on the left-hand side of the curve in panel (a) occurs at approximately 5 µm displacement.
Shot-to-shot intensity fluctuations of the order of a few percent become important for single-pulse time-resolved crystallography measurements when the change in Bragg spot intensity induced by photolysis is of the same order. Therefore, it is critical to make sure that the beam and the crystal are aligned such that intensity fluctuations are minimized. It should be noted that a cryostream can induce crystal vibrations with an amplitude of several micrometers if the mounting pin is not sufficiently rigid. A vibration of this kind will cause intensity fluctuations which are indistinguishable from that caused by beam jitter.
3. Complex used in the analysis
The photochemistry of the polynuclear adducts of cuprous halides and organic bases with general formula Cu4 X 4 L 4, where X is halide and L is an N-coordinated organic ligand, has been studied extensively by Ford and co-workers (Ford et al., 1999 ▶; Vitale & Ford, 2001 ▶). The compound selected for this study, Cu4I4(pip)4 (pip = piperidine, C5H10NH), has a dominant emission with a solid-state lifetime of 12.3 µs at room temperature (Ford et al., 1999 ▶) and 19.3 µs recorded with crystals at 19 K (Benedict et al., unpublished). As the piperidine base is fully saturated, the excitation is cluster-based, a conclusion confirmed by our theoretical calculations (Benedict & Coppens, 2010 ▶).
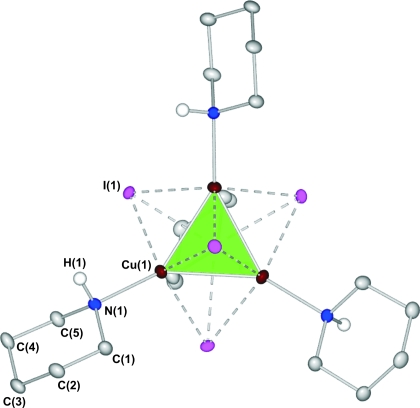
One of the reasons for the selection of Cu4I4(pip)4 is that it crystallizes in the tetragonal space group P42/n and therefore has a diffraction pattern with many symmetry-equivalent reflections. The molecule is located in a special position on the four-fold inversion axis with Z′ = 1/4. Its structure and atomic labeling are shown in Fig. 2 ▶, while crystallographic information is summarized in Table 2 ▶ 1. The copper atoms are in a tetrahedral arrangement, as illustrated in Figs. 2 ▶ and 3 ▶. Iodine atoms are located above each of the triangular faces of the tetrahedron, forming three bonds of different lengths to the adjacent Cu atoms.
Figure 2.
Labeling of atoms of Cu4I4(pip)4 together with anisotropic displacement parameter ellipsoids at a 50% probability level. The Cu4 core is represented as a green polyhedron. Most H atoms are omitted for clarity.
Table 2. Crystal data for Cu4I4(pip)4 (measured with monochromatic radiation on a conventional source).
Full details can be found in the CIF file (see supplementary information).
| Formula | C20H44Cu4I4N4 |
| Molecular mass | 2204.70 a.u. |
| Measurement temperature (T) | 90 (2) K |
| Crystal system | Tetragonal |
| Space group | P42/n |
| Unit-cell parameters | |
| a | 14.6049 (12) Å |
| b | 14.6049 (12) Å |
| c | 7.5464 (12) Å |
| α | 90° |
| β | 90° |
| γ | 90° |
| Volume (V) | 1609.7 (3) Å3 |
| Z | 2 |
| Calculated density | 2.274 g cm−3 |
| R1/wR2 [for I > 2σ(I)] | 2.39%/5.49% |
| R1/wR2 [for all data] | 3.10%/6.02% |
| Largest residual density peak and hole | +0.595 e Å−3/−1.506 e Å−3 |
Figure 3.
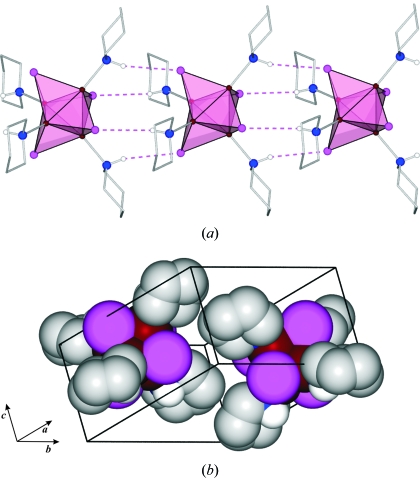
(a) Chains of molecules parallel to the c-axis connected by weak N—H⋯I interactions. The pink polyhedra represent Cu3I units; (b) packing of the molecules in the unit cell. Color coding of the atoms is the same as in Fig. 2 ▶. Some H atoms are omitted for clarity.
4. Analysis of experimental reproducibility
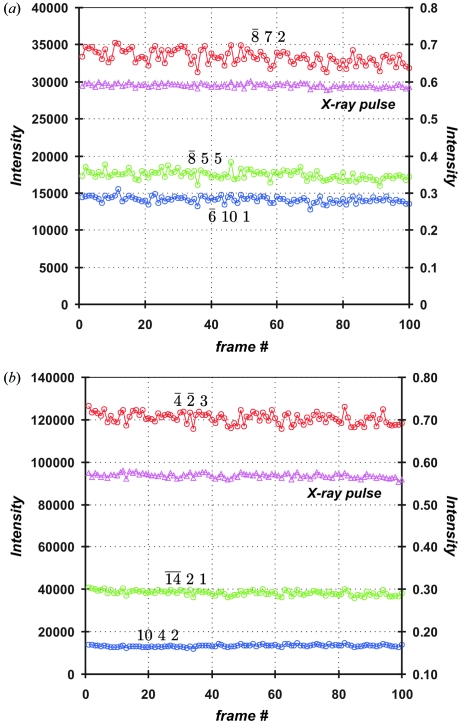
For direct comparison with the beam stability measurements described in §2, a single frame was measured 100 times at the same crystal orientation (angle ϕ = 0°). The beam intensity was monitored with a photodiode detecting the X-ray scatter from a Be window mounted ∼250 mm upstream from the sample position. Integrated intensities of the reflections were obtained using the LAUEGUI program (Messerschmidt & Tschentscher, 2008 ▶; Peters, 2003 ▶) after indexing and orientation matrix refinement using the PRECOGNITION suite (Renz Research), modified for small molecules. The intensity fluctuations of selected strong reflections and the measured beam power are shown in Fig. 4 ▶, whereas intensity statistics are shown in Table 3 ▶.
Figure 4.
Intensity of repeated measurements of selected reflections (small circles, axis on left) and normalized X-ray beam intensity from the photodiode (small triangles in magenta color, axis on right) for measurements 1 (a) and 2 (b).
Table 3. Intensity statistics of selected reflections measured multiple times at ϕ = 0° for both experiments.
〈I〉: mean integrated intensity. σ: standard deviation. ΔI = |I − 〈I〉|.
| Exp. No. | Reflection | 〈I〉 | σ | σ/〈I〉 | 〈ΔI〉/〈I〉 |
|---|---|---|---|---|---|
| 1 |  |
14134 | 433 | 3.07% | 2.46% |
 |
17454 | 587 | 3.36% | 2.67% | |
 |
33313 | 952 | 2.86% | 2.33% | |
| 2 |  |
13401 | 479 | 3.58% | 2.88% |
 |
38354 | 1135 | 2.96% | 2.46% | |
 |
120744 | 2642 | 2.19% | 1.85% |
The standard deviation of the distribution is listed in the fourth column of Table 3 ▶. It clearly exceeds the statistical standard deviation of the measurements assuming a Poisson distribution, indicating other contributions from, for example, beam instabilities or integration uncertainties. The relative standard deviations of each of the reflections is given in the fifth column, while the sixth column shows the mean deviation divided by the mean intensity.
Both experiments indicate the reproducibility of the intensities to fall in the 2–3% range. Slight differences between the two sets of three reflections may be attributed to a difference in crystal orientation, crystal quality and size. We note that the results are qualitatively compatible with the beam stability test discussed in §2.2, indicating adequate centering of the beam position on the crystal.
Further analyses are based on the intensity ratios after merging over symmetry equivalents and multiple measurements of the same reflection, which correspond to the quantities used in the analysis of the pump-probe data (Coppens et al., 2009 ▶). For each pair of consecutively collected OFF frames the ratios ( =
=  =
=  ) of the integrated intensities were calculated.
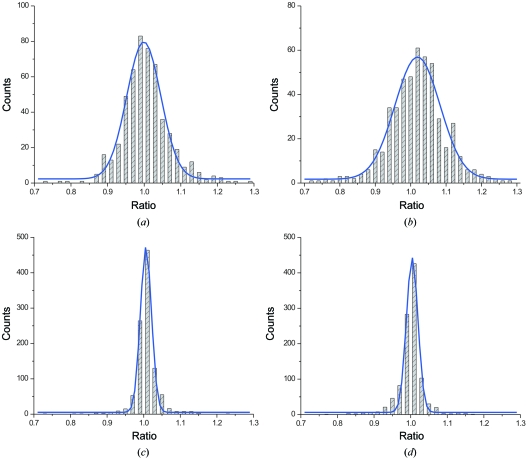
The number of occurrences of the averaged intensity ratios (R) in the two data sets are compared in Fig. 5 ▶. Averaging here and elsewhere in this study was performed using the program SORTAV (Blessing, 1997 ▶). In Fig. 5(a ▶) two successive OFF measurements are compared, whereas in Figs. 5(b)–5(d) ▶ the OFF measurements are interspersed with light-ON frames. Improvement of ratios in 2 relative to 1 is evident from the width of the curves and the numerical values listed in Table 4 ▶, especially when the widths of the distributions are compared. Averaged mean differences values (〈|R 1 − R 2|〉) are equal to ∼12.0% for 1, and ∼3.5% for 2. It is also worth mentioning that all distributions are centered close to unity, indicating that even though measurements of 2 are more precise the average value of the ratios is little affected. The improvement between sets 1 and 2 is not reflected in the individual reflections considered in Table 3 ▶. However, it should be kept in mind that the comparison of the ratios involves a global average over all frames and over all symmetry-equivalent and repeatedly measured ratios, rather than selected individual reflections. Figs. 5(b)–5(d) ▶, which show comparisons of OFF measurements interspersed with ON measurements, are further discussed in §6.
Figure 5.
Histograms showing the number of occurrences of OFF/OFF ratios together with fitted Gaussian curves for selected data sets: (a) data set 1: OFF1/OFF2 (no interspersed ON); (b) data set 1: OFF2/OFF3 (two interspersed ON measurements, 31 µJ pulse−1); (c) data set 2: OFF1/OFF2 (one interspersed ON, 25 µJ pulse−1); (d) data set 2: OFF2/OFF3 (one interspersed ON, 25 µJ pulse−1).
Table 4. Selected numerical parameters for Gaussian functions fitted to the histograms in Fig. 5 ▶ .
C 0: center of the distribution. σ: standard deviation. FWHM = σ2(2ln2)1/2: full width at half-maximum.
| OFF1/OFF2 | OFF2/OFF3 | |||
|---|---|---|---|---|
| Exp. No. | C0 | σ/FWHM | C0 | σ/FWHM |
| 1 | 0.999 | 0.042/0.098 | 1.019 | 0.054/0.127 |
| 2 | 1.006 | 0.013/0.030 | 1.004 | 0.014/0.032 |
5. Evidence for laser damage
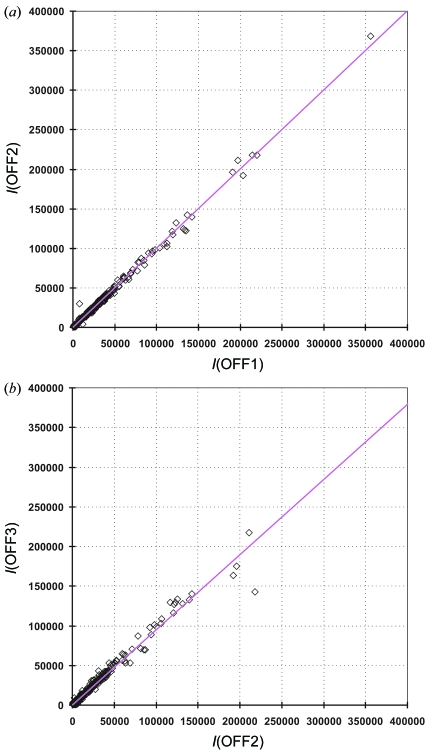
To analyze the reproducibility of the OFF measurements before and after laser exposure, intensity-correlation plots and histograms showing the deviations from average values are employed. An example of a correlation plot is shown in Fig. 6(a) ▶. In the OFF1/OFF2 plot shown, the majority of the reflections are well correlated with each other, as indicated by the values of the determination coefficients, r 2, which are close to 1.0. The OFF2/OFF3 plot for this data set is less satisfactory, however, as shown in Fig. 6(b) ▶.
Figure 6.
Integrated intensity correlations plots together with fitted linear functions and their coefficients of determination (r 2) for data set 1, comparing two consecutively measured frames: (a) I(OFF1) versus I(OFF2) (r 2 = 0.996); (b) I(OFF2) versus I(OFF3) (r 2 = 0.981) (two ON frames collected between the ON frames).
Like Fig. 5(b) ▶, Fig. 6(b) ▶ compares frames collected before (OFF2) and after (OFF3) collection of two ON frames at 31 µJ pulse−1 (ON1, ON2, see Table 1 ▶). The broadening of the histogram may be attributed to sample damage owing to laser exposure. This damage appears to anneal in a short time as the data collection sequence involves OFF1/ON/ON/OFF2 measurements for a crystal orientation before OFF/ON/ON/OFF data are collected at a subsequent step in the scan. In Figs. 5(c) and 5(d) ▶ the ratios collected before and after collection of a single frame of ON at a laser power of 25 µJ pulse−1 are compared. Here the effect on broadening of each of the histograms seems minimal, presumably because of the lower laser power and the single interspersed ON frame compared with the two interspersed ON frames in data set 1 (Fig. 5b ▶).
6. Comparison of ON/OFF ratios
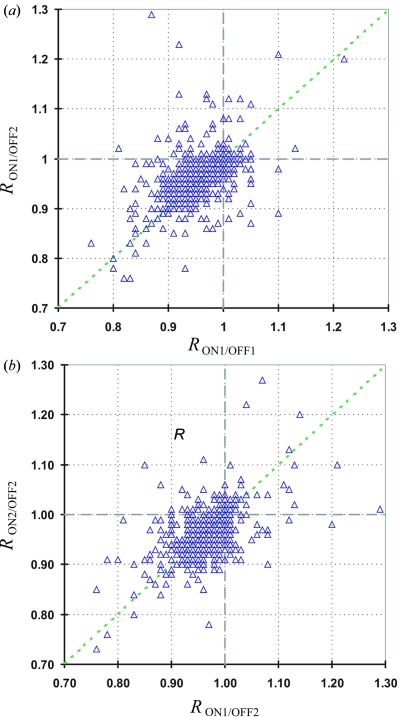
The calculated ON/OFF ratios were merged using the program SORTAV, taking into account the space-group symmetry. The correlation between different sets of ON/OFF pairs is shown in Fig. 7 ▶. Intensity changes on exposure accumulate in the southwest quadrant of the correlation plots which is typical when a second species is photo-generated in the crystal (Vorontsov et al., 2009 ▶).
Figure 7.
Selected correlation plots of ON/OFF ratios for data set 2: (a) ON1/OFF1 − ON1/OFF2 and (b) ON1/OFF2 − ON2/OFF2.
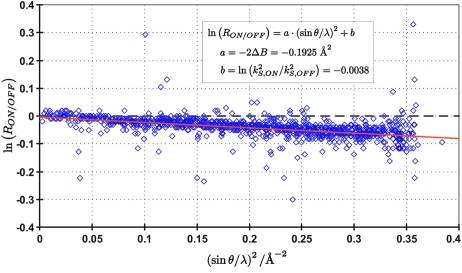
A ln(R ON/OFF) versus (sinθ/λ)2 Wilson-type plot is shown in Fig. 8 ▶. The slope of the line equals −2ΔB, whereas the intercept corresponds to the natural logarithm of the relative scale of the two data sets. As the intercept is very close to zero, there is no scale difference between the two sets, as may be expected. The value of ΔB equals 0.0963 Å2. Together with a value of 〈U eq〉 of 0.0124 Å2, derived from the anisotropic displacement parameters of the heavier Cu and I atoms, this gives a temperature scale factor k B (k B = 1 + ΔB/8π2〈U eq〉) of 1.098. However, the true value of the temperature scale factor k B is likely to be smaller as the estimate from the Wilson-like plot accounts for both the temperature change and the existence of photo-introduced species in the crystal. According to test calculations (Vorontsov & Coppens, 2005 ▶), the former may account for about 20% of the increase above the value of 1. Assuming an experimental temperature of 100 K, the k B value thus corresponds to a temperature increase of about 8 K, a modest increase as may be expected for single-pulse experiments.
Figure 8.
Wilson-type plot [ln(R ON/OFF) versus (sinθ/λ)2] for all merged data for measurement 2.
The conversion percentages in these experiments turned out to be small, in part because of a reversible blackening of the crystals during exposure. Details will be reported separately.
7. Conclusions
The single-pulse Laue technique is required to extract the best possible time-resolution in crystallographic pump-probe experiments at synchrotron sources. The experiments indicate that with careful experimental alignment a reproducibility of 2–3% intensities and 3–4% in the ratios of equivalent intensities obtained in a full data collection can be obtained. A great advantage of the single-pulse technique is that temperature changes owing to laser exposure are minimized. Very small crystals are needed to ensure adequate light penetration in the crystals, but when the sample size approaches 10 µm and narrow focused beams are used the experiment becomes extremely sensitive to instabilities in the sample and beam positions.
Supplementary Material
Crystal structure: contains datablocks global, Cu4I4pip4. DOI: 10.1107/S0909049510019710/kv5081sup1.cif
Acknowledgments
We would like to thank Renske van der Veen for participation in the synchrotron measurements. This work was funded by the Division of Chemical Sciences, Geosciences, and Biosciences, Office of Basic Energy Sciences of the US Department of Energy through grant DEFG02-ER15372. Use of the BioCARS Sector 14 was supported by the National Institutes of Health, National Center for Research Resources, under grant number RR007707. The time-resolved facility at Sector 14 was funded in part through a collaboration with Philip Anfinrud (NIH/NIDDK). The Advanced Photon Source is supported by the US Department of Energy, Office of Basic Energy Sciences, under Contract No.W-31-109-ENG-38. RK would also thank the Foundation for Polish Science for financial support within the ‘International PhD Projects’ program.
Footnotes
Supplementary data for this paper are available from the IUCr electronic archives (Reference: KV5081). Services for accessing these data are described at the back of the journal.
References
- Benedict, J. B. & Coppens, P. (2010). In preparation.
- Blessing, R. H. (1997). J. Appl. Cryst.30, 421–426.
- Bolotovsky, R. & Coppens, P. (1997). J. Appl. Cryst.30, 244–253.
- Bolotovsky, R., White, M. A., Darovsky, A. & Coppens, P. (1995). J. Appl. Cryst.28, 86–95.
- Bourgeois, D., Schotte, F., Brunori, M. & Vallone, B. (2007). Photochem. Photobiol. Sci.6, 1047–1056. [DOI] [PubMed]
- Cammarata, M., Eybert, L., Ewald, F., Reichenbach, W., Wulff, M., Anfinrud, P., Schotte, F., Plech, A., Kong, O., Lorenc, M., Lindenau, B., Räbiger, J. & Polachowski, S. (2009). Rev. Sci. Instrum.80, 015101. [DOI] [PubMed]
- Coppens, P., Pitak, M., Gembicky, M., Messerschmidt, M., Scheins, S., Benedict, J., Adachi, S., Sato, T., Nozawa, S., Ichiyanagi, K., Chollet, M. & Koshihara, S. (2009). J. Synchrotron Rad.16, 226–230. [DOI] [PMC free article] [PubMed]
- Ford, P. C., Cariati, E. & Bourassa, J. (1999). Chem. Rev.99, 3625–3648. [DOI] [PubMed]
- Graber, T., Henning, R. W., Kosheleva, I., Ren, Z., Srajer, V., Moffat, K., Cho, H.-S., Dashdorj, N., Schotte, F. & Anfinrud, P. (2009). Annual Meeting of the American Crystallographic Association, Toronto, Canada. Abstract 6.10.12.
- Messerschmidt, M. & Tschentscher, T. (2008). Acta Cryst. A64, C611.
- Moffat, K. (2001). Chem. Rev.101, 1569–1582. [DOI] [PubMed]
- Peters, J. (2003). J. Appl. Cryst.36, 1475–1479.
- Vitale, M. & Ford, P. C. (2001). Coord. Chem. Rev.219–221, 3–16.
- Vorontsov, I. I. & Coppens, P. (2005). J. Synchrotron Rad.12, 488–493. [DOI] [PubMed]
- Vorontsov, I. I, Graber, T., Kovalevsky, A. Yu., Novozhilova, I. V., Gembicky, M., Chen, Y.-S. & Coppens, P. (2009). J. Am. Chem. Soc.131, 6566–6573. [DOI] [PubMed]
- Wulff, M., Plech, A., Eybert, L., Randler, R., Schotte, F. & Anfinrud, P. (2002). Faraday Discuss.122, 13–26. [DOI] [PubMed]
Associated Data
This section collects any data citations, data availability statements, or supplementary materials included in this article.
Supplementary Materials
Crystal structure: contains datablocks global, Cu4I4pip4. DOI: 10.1107/S0909049510019710/kv5081sup1.cif


