

Summary
The production of H2O2 by isolated mitochondria is frequently used as a measure of mitochondrial superoxide formation. Matrix superoxide dismutase quantitatively converts matrix superoxide to H2O2. However, matrix enzymes such as the glutathione peroxidases can consume H2O2 and compete with efflux of H2O2, causing an underestimate of superoxide production. To assess this underestimate we depleted matrix glutathione in rat skeletal muscle mitochondria by more than 90% by pretreatment with 1-chloro-2,4-dintrobenzene (CDNB). The pretreatment protocol strongly diminished the mitochondrial capacity to consume exogenous H2O2, consistent with decreased peroxidase capacity, but avoided direct stimulation of superoxide production from complex I. It elevated the observed rates of H2O2 formation from matrix-directed superoxide up to two-fold from several sites of production, defined by substrates and electron transport inhibitors, over a wide range of control rates, from 0.2 to 2.5 nmol H2O2 • min−1 • mg protein−1. Similar results were obtained when glutathione was depleted using monochlorobimane or when soluble matrix peroxidase activity was removed by preparation of submitochondrial particles. The data indicate that the increased H2O2 efflux observed with CDNB pretreatment was a result of glutathione depletion and compromised peroxidase activity. A hyperbolic correction curve was constructed, making H2O2 efflux a more quantitative measure of matrix superoxide production. For rat muscle mitochondria, the correction equation was: [CDNB pretreated rate = control rate + (1.43*(control rate))/(0.55+control rate)]. These results have significant ramifications for the rates and topology of superoxide production by isolated mitochondria.
Keywords: complex I; complex III; reactive oxygen species (ROS); 1-chloro-2,4-dinitrobenzene; peroxidase
Introduction
The production of mitochondrial reactive oxygen species (ROS) has been implicated in cellular signaling [1], aging [2], and many pathologies including diabetes [3], non-alcoholic steatosis [4] and neurodegenerative diseases [5;6]. Despite such apparent biological significance, remarkably little is known about the mechanism or regulation of ROS production in mitochondria.
Measurement of H2O2 efflux from intact isolated mitochondria provided one of the earliest demonstrations that mitochondria produce ROS [7-9]. This technique continues to be widely utilized in studies exploring the sites, mechanism and regulation of mitochondrial ROS production (for example [10-18]). The basic premise of the assay is straightforward. Superoxide is the initial product formed by reduction of O2 by single electrons from the mitochondrial electron transport chain. Superoxide in aqueous solution is predominantly anionic at physiological pH (its pKa is 4.9) and does not readily diffuse across membranes, therefore superoxide formed in the matrix is not detected directly in the suspending medium. Instead, superoxide formed in the matrix is rapidly dismutated to H2O2 by matrix manganese-dependent superoxide dismutase (Mn-SOD [EC 1.15.1.1]). The resulting H2O2 can readily diffuse across membranes. The addition of an H2O2 detection system to the medium allows the efflux of H2O2 from mitochondria to be used as a measure of superoxide production in the matrix. An additional consideration should also be, and generally is, incorporated, some superoxide-producing enzyme complexes of the mitochondrial inner membrane also release superoxide to the intermembrane space [14;19-21]. The addition of exogenous superoxide dismutase (SOD) to the assay prevents underestimation of this ROS production by dismutating outwardly directed superoxide into H2O2 [14;20].
There are significant antioxidant processes within the mitochondria, especially the decomposition of H2O2 by glutathione (GSH) peroxidase [2]. Compartmentalization of intact mitochondria means that any matrix antioxidant systems that retain function in vitro may have preferential access to H2O2 prior to its diffusion out into the medium where the detection system is present. Thus, the use of H2O2 production by mitochondria as a quantitative measure of superoxide formation requires the assumption that mitochondrial antioxidant systems are not a significant source of interference. While this assumption is generally made, it has rarely been tested [11;22].
Matrix GSH-peroxidase (EC 1.11.1.9) can decompose H2O2 to H2O, using GSH and forming GSSG (oxidized glutathione disulfide). Glutathione reductase (EC 1.8.1.7) uses NADPH to reduce GSSG back to GSH. Since GSH is central to this peroxidase system, GSH-depleting agents should compromise the capacity of glutathione peroxidase to decompose matrix H2O2. 1-chloro-2,4-dinitrobenzene (CDNB) is such an agent; in a reaction catalyzed by glutathione-S transferase (EC 2.5.1.18), CDNB depletes GSH by irreversible conjugation with GSH [11;22;23]. Pretreatment of mitochondria with CDNB to lower the content of GSH increases the observed rate of mitochondrial H2O2 production [11;22;23], suggesting that glutathione peroxidase is a significant sink for matrix H2O2 and potentially may cause significant underestimation of matrix superoxide production when this is measured as extramitochondrial H2O2.
An important caveat on the interpretation of experiments with CDNB treatment of mitochondria is that CDNB can also markedly increase ROS production independently of GSH depletion. For example, superoxide production by complex I measured directly in submitochondrial particles, which are already GSH depleted, is increased fourfold on the addition of CDNB to the assay [23]. The mechanism by which CDNB directly activates ROS production by complex I is not known. In contrast to complex I, the antimycin A-dependent superoxide production by complex III in submitochondrial particles is not activated directly by CDNB [23] indicating that effects of CDNB on ROS production by complex III can be used in intact mitochondria to assess the importance of glutathione peroxidase in compromising the assay of mitochondrial ROS production. Using rat heart mitochondria, Han et al. [11] demonstrated a correlation between the degree of GSH depletion with CDNB and increased rates of mitochondrial H2O2 production from the Qo site of complex III, providing qualitative evidence for the underestimation of matrix superoxide production by the extramitochondrial H2O2 assay.
The experiments reported in the present paper were developed to test the hypothesis that the intramitochondrial GSH-dependent antioxidant system interferes significantly with the extramitochondrial H2O2 assay, and that depletion of GSH using CDNB can be used to assess the extent of the problem and provide a single quantitative correction for all superoxide-producing sites in the matrix. To minimize interference from other competing H2O2 consuming processes, rat muscle mitochondria were used because of their lack of catalase activity and low level of contaminating peroxisomes [24]. To minimize complications from direct effects of CDNB at complex I, we limited the exposure of the mitochondria to CDNB. We find that the observed increase in H2O2 production by GSH-depleted muscle mitochondria can be described by a single equation, over a wide range of rates from multiple sites of ROS production, including the CDNB-insensitive complex III Qo site. These results allow correction of observed H2O2 production by intact mitochondria to give a more quantitative measure of superoxide production that is not compromised by matrix glutathione-dependent peroxidase activities.
Results
Sites of ROS production
Several sites of mitochondrial superoxide production have been recognized and defined by the selective use of specific substrates and inhibitors. The four major sites of importance to the present study, the substrates used to feed electrons to these sites, and the effects of inhibitors are illustrated in Figure 1. In the present study the rates of superoxide production from different sites were defined as follows. Site IF: rate from the flavin site of complex I in the presence of malate (to reduce NAD+ to NADH), maximized by addition of rotenone (to block exit of electrons from complex I and fully reduce the active site FMN, and to collapse protonmotive force). Site IF plus αKGDH: rate in the presence of malate plus glutamate, also maximized by addition of rotenone due to the full reduction of FMN and of NAD+. Addition of glutamate allows production of α–ketoglutarate, which, together with low NAD+ and high NADH, gives high ROS production from the αKGDH complex [15]. It should be noted that the αKGDH complex produces superoxide, which can be measured directly as the SOD-sensitive reduction of acetylated cytochrome c [15]. The data in Starkov et al. [15] indicate that this superoxide can account for about 75% of the H2O2 produced by the isolated complex in the presence of SOD and an H2O2 detection system. Thus, some of the product of this complex is likely to be H2O2 produced directly by αKGDH and not superoxide that has been dismutated by SOD2. Site IQ: rate from the quinone-binding site of complex I in the presence of succinate (to reduce Q to QH2 and generate protonmotive force to drive reverse electron transport) that is abolished by addition of rotenone (to block the Q-reducing site of complex I) [13]. Site IIIQo: rate from the outer quinone-oxidizing site of complex III in the presence of rotenone (to prevent complex I superoxide production at site IQ), succinate (to reduce Q to QH2) and antimycin A, which is a Qi site inhibitor (to prevent exit of electrons from complex III and build up the concentration of QH. at site IIIQo, and to collapse protonmotive force). Stigmatellin is a Qo site inhibitor that prevents electron entry into complex III. The difference in the rate of H2O2 production following the addition of a Qo site inhibitor, such as stigmatellin, can be used to define the contribution by site IIIQo to the antimycin A-stimulated rate of superoxide production [20].
Figure 1. The sites, topology and effect of inhibitors on mitochondria superoxide production.

Only sites of importance to the current study are included. Sites include the flavin of complex I (IF), the high rate involving interaction between complex I and QH2 (IQ), the outer Q-binding site of complex III (IIIQo) and the α-ketoglutarate dehydrogenase complex (αKGDH). The direct and indirect effects of inhibitors at specific sites of superoxide production are indicated for each site, with upward and downward arrows indicating increasing and decreasing rates respectively. The mitochondrial inner membrane is indicated by the double dotted line and is considered an impermeable barrier to matrix directed superoxide, which is dismutated to H2O2 by Mn-SOD. Note, some substrates and cofactors are omitted for clarity. Substrates of importance are indicated in bold, but only NADH and succinate facilitate electron entry into the electron transport chain in the current study. Abbreviations: αKG, α-ketoglutarate; AA, antimycin A; ASP, aspartate; Fum, fumarate; GOT, glutamate oxaloacetate transaminase; MDH, malate dehydrogenase; Stig, stigmatellin; Rot, rotenone.
CDNB pretreatment decreases mitochondrial GSH content and H2O2 consumption
The GSH content of rat muscle mitochondria was 1.6 nmol • mg protein−1 (Table 1), similar to the level in isolated guinea-pig cerebral cortex mitochondria [22] and lower than the levels in isolated rodent liver, kidney or heart mitochondria ([25-28]). Pretreatment of mitochondria with CDNB depleted GSH by about 95% (Table 1), confirming that CDNB was effective at removing glutathione in our hands.
Table 1.
CDNB treatment depletes GSH and reduces peroxidase capacity in isolated rat muscle mitochondria
| Control | CDNB-pretreated | % decrease | |
|---|---|---|---|
|
GSH (nmol • mg protein−1) |
1.58 ± 0.07 | 0.10 ± 0.06* | 93.0 ± 3.9 |
|
H2O2 consumption (nmol • min • mg protein−1) |
1.53 ± 0.16 | 0.42 ± 0.10* | 73.3 ± 4.6 |
Data are mean ± SEM (n = 4),
different from control (p < 0.05, paired t-test).
The mitochondria had substantial capacity to consume H2O2. The initial rate of depletion of 1.5 μM added H2O2 was 1.5 nmol H2O2 • min− • mg protein− in control mitochondria (Table 1). Pretreatment of mitochondria with CDNB resulted in a large decrease, about 75%, in this rate (Table 1). These results are consistent with significant GSH peroxidase activity in rat muscle mitochondria [29], which is highly compromised when GSH is depleted by CDNB-pretreatment. Because of its high rate, this activity has the potential to cause underestimation of H2O2 efflux from mitochondria, and hence underestimation of superoxide production in the matrix using assays based on the extramitochondrial detection of H2O2. CDNB-pretreatment may be a way to prevent this underestimation.
CDNB acutely activates superoxide production by complex I but not by complex III; CDNB pretreatment does not cause this effect
Acute exposure to CDNB is known to result in direct activation of superoxide production by complex I, while superoxide production by complex III is not affected [23]. These observations were confirmed in the present study using CDNB in great excess compared to our standard CDNB pretreatment and washing protocol for GSH depletion. Figure 2 shows that acute CDNB treatment doubled superoxide production from site IF (Figure 2A) but not site IIIQo (Figure 2B) in membrane fragments. Membranes from control and CDNB pretreated mitochondria were disrupted by freeze-thawing and sonication. Superoxide production was monitored as H2O2 production with exogenous SOD added.
Figure 2. CDNB pretreatment does not affect superoxide production from either site IF or IIIQo but addition of 35 μM CDNB activates superoxide production by site IF.

(A) The rate of superoxide production by disrupted mitochondrial membranes with 0.5 mM NADH as a substrate for complex I, in the presence of 4 μM rotenone. (B) Stigmatellin-sensitive (100 nM) component of the antimycin A-dependent superoxide production by disrupted mitochondrial membranes incubated with 5 mM succinate plus 4 μM rotenone to block complex I ROS formation. Membranes from control and CDNB-pretreated mitochondria were disrupted by freeze-thaw and sonication. Superoxide was monitored as H2O2 production in the presence of 50 μM Amplex Ultrared, 5 U · ml−1 horseradish peroxidise and either 100 or 25 U·ml−1 of Cu/Zn-SOD for site IF and IIIQo respectively. Note, although 25 U·ml−1 of SOD is sufficient for superoxide detection, 100 U·ml−1 of SOD was found to substantially decrease the endogenous background reaction that occurs between NADH and the H2O2 detection system. Data are means ± SEM; n = 3, * p < 0.05 (t-test) from membranes prepared from control and CDNB-pretreated mitochondria.
In contrast, CDNB pretreatment had no effect on either site in membrane fragments, and acute CDNB treatment still stimulated superoxide production from site IF in pretreated membranes. There was no difference in the rate of superoxide production between control and CDNB pretreated membranes from either site IF (in the presence of NADH and rotenone, Figure 2A) or site IIIQo (succinate, rotenone and antimycin A, Figure 2B). However, the acute addition of 35 μM CDNB to the assay resulted in a marked activation of superoxide production from site IF but was without effect on superoxide production from site IIIQo. The amount by which CDNB increased superoxide production from site IF was the same for membranes prepared from control and CDNB pretreated mitochondria (Figure 2A), indicating that it is unlikely the CDNB pretreatment alters complex I in a way that makes the complex more prone to superoxide production.
CDNB-pretreatment increases observed H2O2 production from multiple sites
Using intact mitochondria, CDNB-pretreatment more than doubled the observed rate of H2O2 production from site IF with malate or site IF plus αKGDH with malate plus glutamate as substrates (Figure 3). This was true for both the native rates without rotenone and the maximum rates in the presence of rotenone. To confirm that this effect was general (caused by inhibition of the competing GSH peroxidase reaction in the matrix) and not specific (caused by direct activation of complex I superoxide production), we asked i) whether CDNB-pretreatment increased the observed rate of H2O2 production only from complex I, or more generally from several different sites of production including complex III, and ii) whether increases in measured H2O2 production in CDNB-pretreated mitochondria showed the same consistent and unique pattern over a range of rates of superoxide production from two different sites.
- The observed rates of H2O2 production with all substrate and inhibitor combinations examined were higher in mitochondria that had been pretreated with CDNB than they were in control mitochondria (Figure 3). All data fell on the same line, fitting a hyperbola, consistent with a general effect of GSH peroxidase activity causing an underestimate of matrix H2O2 production and inconsistent with a specific effect of CDNB-pretreatment on complex I alone. The singular exception was the rate with succinate plus rotenone and antimycin, corresponding to site IIIQo. However, this site produces superoxide to both sides of the mitochondrial inner membrane [11;14;21;30]. H2O2 production from site IIIQo by muscle mitochondria from mice lacking SOD1 (which is localized in the cytosol and the intermembrane space) is doubled by addition of exogenous SOD [14], indicating that approximately 50% of the measured superoxide is directed to the intermembrane space. Assuming this value, the corrected rate for superoxide generated specifically in the matrix can be determined using the formula:
After this correction was applied, the matrix component of superoxide production from site IIIQo fell on the same line as all other data (Figure 3). Thus, pretreatment with CDNB enhanced measured H2O2 production from several different sites to give a single relationship, consistent with a general effect on the assay of matrix superoxide rather than a specific effect on any one site. That a hyperbola was a strong fit for the observed increase in H2O2 production with CDNB-pretreatment may be anticipated a priori for a saturable intramitochondrial enzyme-catalyzed process competing with H2O2 diffusion out of the matrix. The second approach further characterized the effect of CDNB-pretreatment by using site-specific inhibitors to vary superoxide production from two single sites (IQ and IIIQo) from maximal to low rate (Figure 4). This approach generated a range of H2O2 production rates similar to that found with multiple different substrates (Figure 3). However, generation of a range of rates from a single inhibitor-defined site tested whether the overall effect of CDNB-pretreatment was a unique function of the rate of production and not a fortuitous mixed response from several different sites of production. H2O2 production from both complex I and complex III was titrated to ensure the results were a general phenomenon of impaired matrix capacity to consume H2O2 and not simply a result of complex I sensitivity to CDNB.
Figure 3. Comparison of rates of H2O2 production by control and CDNB-pretreated mitochondria incubated with different substrates.

All substrates were present at 5 mM, rotenone was present at 4 μM where indicated. Data are mean ± SEM (n = 3-4). H2O2 production in the presence of succinate, rotenone and Antimycin A (AA, 100 nM) is plotted as the raw uncorrected rate (light grey triangle), and as matrix-directed superoxide (black triangle), corrected assuming a 50% sidedness of superoxide production (see the text). The dashed line indicates a 1:1 relationship; the dotted line, a hyperbolic fit to (CDNB-pretreated rate – Control rate) for all points except uncorrected succinate+rotenone+AA. The rate with CDNB-pretreated mitochondria was significantly greater than control (p < 0.05, t-test for all values).
Figure 4. Comparison of rates of H2O2 production from different inhibitor-defined sites by control and CDNB-pretreated mitochondria.

Site IQ: succinate was 5 mM. This rate was more than 60% sensitive to rotenone indicating that it was predominantly from site IQ. Superoxide derived from site IQ was titrated down with submaximal to maximal concentrations of rotenone (0-4.6 μM). Site IIIQo: succinate (5 mM), rotenone (4 μM) and Antimycin A (AA) at 100 nM were present. This rate was almost fully sensitive to stigmatellin indicating that it was predominantly from site IIIQo. The rate of matrix-directed superoxide (triangles) was calculated as described in the text, and was titrated down with stigmatellin from 0 to 200 nM. The dashed line indicates a 1:1 relationship; the dotted line shows the hyperbola from Figure 1 derived from multiple sites of production (for comparison). Data are means ± SEM for n = 3 independent experiments. Error bars that are not visible are obscured by the symbol.
Superoxide production by site IIIQo was stimulated by the addition of antimycin A and titrated down by the potent Qo site inhibitor, stigmatellin. The results were corrected to give matrix-directed superoxide production as described above. Figure 4 shows that CDNB-pretreatment increased apparent matrix superoxide production to the same extent as it did from multiple sites of production (Figure 3). When apparent superoxide production by site IQ was titrated progressively with rotenone, the resulting curve also fitted a similar line (Figure 4). Thus measured H2O2 production in mitochondria pretreated with CDNB show the same hyperbolic increase over a range of rates of superoxide production by specific single sites as it did more generally from several sites.
Comparison of superoxide production from site IIIQo using intact mitochondria and submitochondrial particles
We compared H2O2 production from intact mitochondria and submitochondrial particles (SMP) to further examine whether measurement of H2O2 diffusion from intact mitochondria under-reports true superoxide production. The process of making submitochondrial particles washes away both soluble matrix antioxidant enzymes and endogenous small molecule matrix antioxidants like GSH. In addition, once the matrix is exposed, the horseradish peroxidase in the assay system can compete directly with any residual peroxidase activities in SMP. Therefore, unlike intact mitochondria, little H2O2 should be lost during the assay of superoxide production in SMP. Because proteins are also lost during preparation of SMP, we normalized data not to total protein content, but to complex I FMN content. Submitochondrial particles made from rat muscle respired on succinate at comparable rates to intact mitochondria when normalized to FMN content (Figure 5A), validating this normalization.
Figure 5. SMP have higher observed superoxide production from complex III than intact mitochondria.

(A) Similar maximal respiration rates with 5 mM succinate of mitochondria in state 3 (0.2 mM ADP added) and uncoupled SMPs (2 μM FCCP added) when normalized to FMN content. (B) H2O2 production with 5 mM succinate (in the presence of 4 μM rotenone and 100 nM antimycin A) in control mitochondria and SMP. Data are means ± SEM (n = 3-6); * p < 0.05, t-test between mitochondria and SMP.
The rate of H2O2 production from site IIIQo, measured in the presence of succinate, rotenone and antimycin A, was 58% greater from submitochondrial particles than from intact control mitochondria (Figure 5B), supporting the contention that matrix components (presumably mainly GSH peroxidase) cause an underestimation of the rate in intact mitochondria. This value agrees fairly well with the 39% increase in measured H2O2 production from site IIIQo caused by pretreatment with CDNB (Figure 3, succinate + rotenone + AA uncorrected), supporting the contention that CDNB pretreatment corrects for most of the effects of these matrix components in intact mitochondria.
Effect of monochlorobimane on mitochondria H2O2 production
The capacity of a second GSH-depleting compound, MCB, to increase the observed rate of H2O2 production by intact mitochondria was also tested. Since both MCB and CDNB are substrates for glutathione S-transferase, the mechanism of GSH depletion is similar. However, pretreatment with MCB depleted GSH by only about 50% (Figure 6). Although less effective at removing GSH, MCB-pretreatment of mitochondria increased the rate of H2O2 production using succinate plus rotenone by 22% (Figure 6), compared to 39% with nearly complete GSH depletion using CDNB (Figure 3, uncorrected for sidedness).
Figure 6. Monochlorobimane pretreatment depletes GSH and increases observed H2O2 production from complex III.

GSH content and rates of H2O2 production from site IIIQo (with 5 mM succinate, 4 μM rotenone and 100 nM antimycin) were measured in mitochondria preincubated with 500 μM monochlorobimane and washed as described in the experimental section. Data are means ± SEM (n = 3); * p < 0.05 relative to control mitochondria (t-test).
An increase in the rate of H2O2 production remarkably similar to the one we observed with MCB was found with CDNB in guinea-pig cerebral cortex mitochondria depleted of GSH to a similar extent [22]. Guinea-pig cerebral cortex mitochondria have similar GSH content (1.98 nmol • mg protein−1 [22]) to rat muscle mitochondria (Table 1). Depletion of GSH by 50% using CDNB in guinea pig cerebral cortex mitochondria increased the observed rate of H2O2 production from site IIIQo, as defined above, by approximately 20% [22], in good agreement with our results with 50% GSH depletion of muscle mitochondria using MCB pretreatment. Importantly, acute addition of MCB significantly inhibited complex I superoxide production, both during forward electron transport with NADH-generating substrates and during reverse electron transport with succinate (data not shown). This inhibitory effect of MCB was in stark contrast to the acute effect of CDNB, which activated complex I superoxide production (Figure 2). Thus, the increase in the rate of H2O2 efflux following MCB-pretreatment was not a result of directly increased complex I superoxide production. The experiments in this section plus the submitochondrial particle data, although not ‘correction values’ themselves, support the contention that H2O2 efflux from intact mitochondria significantly underestimates matrix superoxide production when the glutathione peroxidase system is present and active.
Increased H2O2 production from site IF is not due to impaired NADH utilization
Site IF was further characterized in control and CDNB-pretreated mitochondria to test whether putative effects of CDNB on NADH oxidation could affect H2O2 production. To avoid production of ROS by pyruvate or α-ketoglutarate dehydrogenase complexes [15], superoxide production from site IF was established using malate alone to generate NADH. Superoxide production was increased by titration of the quinone-binding site of complex I with rotenone to inhibit reoxidation of the flavin. As described in Figure 3, control mitochondria produced H2O2 at much lower rates than CDNB-pretreated mitochondria both in the absence and presence of excess rotenone. Figure 7A shows that H2O2 production from CDNB-pretreated mitochondria displayed a typical inhibitor-response curve with increasing rotenone concentration, but this relationship appeared to be more complex in control mitochondria.
Figure 7. CDNB pretreatment of mitochondria alters observed H2O2 production from site IF, but not NAD(P)H reduction.
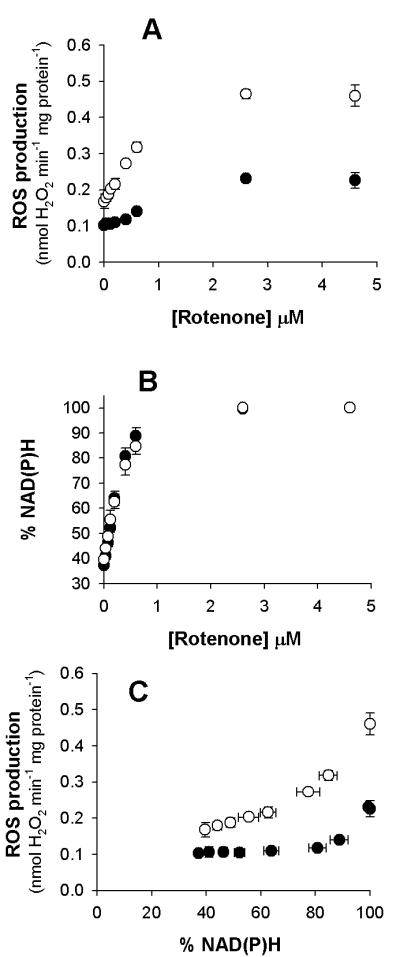
(A) H2O2 production in the presence of 5 mM malate in CDNB-pretreated (open circles ○) and control (closed circles ●) mitochondria at different concentrations of rotenone (added sequentially). In all cases rates were higher in CDNB-pretreated mitochondria (p < 0.05, t-test). (B) Steady-state reduction level of NADH, measured by the NAD(P)H autofluorescence, during the same titrations. Symbols are overlapping for highest [rotenone]. (C) Relationship between H2O2 production rate and % NAD(P)H. Data are means ± SEM (n=3). When not visible, error bars are obscured by the symbol.
Mitochondrial matrix NADH/NAD+ was measured by NAD(P)H autofluorescence. Although this technique measures contributions from both the mitochondrial NADH and NADPH, the content of NAD+ plus NADH in skeletal mitochondria is much greater than the combined NADP+ and NADPH [31]. Moreover, the enhancement of NADH fluorescence in mitochondria is 2-4 times greater than it is for mitochondrial NADPH [32]. The higher content and greater fluorescent enhancement of NADH makes our autofluorescence signal predominantly a measure of NADH. However, it should be appreciated that a small contribution from NADPH will also be a component of the measurement. The NADPH contribution is approximately 6% or less of the maximally reduced NAD(P)H signal. Control and CDNB-pretreated mitochondria had the same NADH/NAD+ ratio at each rotenone concentration (Figure 7B). Since steady-state cofactor reduction depends on NADH generation from malate oxidation and NADH removal by complex I, Figure 7B illustrates that CDNB-pretreatment does not impair NADH utilization by complex I under these conditions. Therefore, it is unlikely that either the increased rate of H2O2 production or the different curve shapes in Figure 7A are due to effects of CDNB-pretreatment on NADH utilization by complex I.
The rate of superoxide production by site IF in isolated complex I can be set by the NADH/NAD+ ratio [33;34]. Figure 7C shows H2O2 production (Figure 7A) plotted against cofactor reduction (Figure 7B). H2O2 production by CDNB-pretreated mitochondria depended strongly on the apparent NADH/NAD+ ratio (Figure 7C). However, H2O2 production by control mitochondria was insensitive to large changes in the ratio, requiring a highly reduced cofactor pool before the observed rate of H2O2 production increased above that found with 5 mM malate alone (Figure 7C). Based on the experiments described above, the relationship in CDNB-pretreated mitochondria better reflects the true dependence of superoxide production by site IF on the NADH/NAD+ ratio in isolated mitochondria.
Discussion
Pretreatment of rat skeletal muscle mitochondria with the GSH-depleting agent CDNB followed by washing to remove excess CDNB had no direct effect on complex I ROS production (Figure 2) or NADH oxidase activity (Figure 7). However, it greatly inhibited mitochondrial H2O2 removal (Table 1) by preventing the activity of glutathione peroxidase and other GSH-dependent peroxidases. It clearly increased the observed rate of H2O2 production from all sites of mitochondrial superoxide formation examined in this study (Figures 3, 4 and 7), rather than having a specific effect at any one site.
We interpret these findings to mean that the standard assay of matrix superoxide production, as measured by extramitochondrial H2O2 detection systems such as the horseradish peroxidase/Amplex UltraRed method, significantly underestimate the true rate of superoxide production. The increase in observed H2O2 production with CDNB-pretreatment was a hyperbolic function of the control rate. The equation for this hyperbola is given in Figure 3. This equation corrects for the underestimate in H2O2 production rate caused by glutathione peroxidase activity. It can be used to predict the H2O2 production rate (and hence the superoxide production rate) in the matrix of isolated rat skeletal muscle mitochondria at any measured rate of matrix H2O2 production in control mitochondria. The measured peroxidase activity of isolated mitochondria (Table 1) is very similar to the maximal observed underestimation of H2O2 production rate (1.5 and 1.4 nmol • min−1 • mg protein−1 respectively), although this similarity may be coincidental.
The use of CDNB-pretreatment to provide a correction algorithm for the quantitative assay of superoxide production by H2O2 efflux from intact mitochondria needs to be developed carefully because CDNB can acutely alter complex I ROS production by an uncharacterized mechanism. Consistent with previous data [23], acute addition of CDNB markedly increased ROS production by complex I (Figure 2A) but not complex III (Figure 2B). In the current study, there are several lines of evidence that support the interpretation that CDNB-pretreatment improves detection of superoxide production and does not simply acutely activate complex I ROS production.
First, acute treatment with CDNB increased complex I ROS production in disrupted membranes, but CDNB-pretreatment followed by washing did not (Figure 2). Acute activation by CDNB was still observed in CDNB-pretreated membranes, showing that pretreatment did not preactivate complex I.
Second, measured H2O2 efflux increased from multiple sites of mitochondrial superoxide production, including sites IF and IQ of complex I, αKGDH, and site IIIQo of complex III, following CDNB pretreatment. Furthermore, all data indicated the same unique pattern of underestimation, which was saturable and dependent on the control rate of matrix-directed superoxide production (Figure 3).
Third, titrations of two distinct inhibitor-defined sites of superoxide production, site IQ of complex I and site IIIQo of complex III, fell on the same line as the data from multiple sites (Figure 4). A range of superoxide production rates generated from each single site gave the same response as production from several sites, indicating that this relationship was unlikely to be a fortuitous coincidence. Instead, the data in Figure 4 support the contention that the observed underestimation of rates is a saturable function of matrix-directed superoxide production.
Fourth, multiple lines of evidence demonstrate that H2O2 efflux from intact rat muscle mitochondria underestimates superoxide production. These include CDNB-pretreatment, comparison of submitochondrial particles with intact mitochondria, and GSH depletion with a second agent (MCB-pretreatment). The similarities in the underestimates using submitochondiral particles and MCB-pretreatment are strong support for the contention that the increased rate with CDNB- pretreatment is not simply a result of altered superoxide production by complex I, or other complexes. Taken together, these data all support a similar underestimation of site IIIQo superoxide production when it is measured as H2O2 production by intact mitochondria (Figures 3-6).
The mechanism of the acute stimulation of complex I ROS production by CDNB is not clear [23], but our data show that activation is not due simply to GSH depletion, since neither pretreatment with CDNB nor MCB addition or pretreatment caused such activation. Presumably activation involves a direct, acute effect of CDNB itself on complex I.
Use of the correction described here has a number of ramifications. It implies that previous values for the rate of superoxide production by isolated rat skeletal muscle mitochondria using assays of H2O2 production are substantial underestimates, by approximately 50-60% at moderate rates of superoxide production (control rates of around 0.5-1.0 nmol H2O2 • min−1 • mg protein−1), and by an even greater factor at lower rates (a control rate of 0.25 nmol H2O2 • min−1 • mg protein−1 is a 64% underestimation of the CDNB-pretreated rate). The same is probably true for superoxide production by mitochondria from other sources, although the extent of the correction for other mitochondria has yet to be determined. It also affects calculations of the topology of superoxide production. St Pierre et al. [20] found that there was a significant enhancement of H2O2 production from site IIIQo by exogenous SOD, and concluded that this site produced superoxide exclusively or mainly to the intermembrane space. The raw data showed that about 25% of the superoxide was directed to the matrix in rat skeletal muscle mitochondria, and about 45% had this topology in rat heart mitochondria. Similarly, 75% [35] or 70% [19] was matrix-directed in Drosophila mitochondria. Muller et al. [14] found that 65% was matrix-directed in wild-type mouse skeletal muscle mitochondria, and 50% in skeletal muscle mitochondria from SOD1-knockout mice. All of these values are probably underestimates. Our current experiments give an empirical value of about 65% matrix-directed superoxide in wild-type rat skeletal muscle mitochondria (not shown), effectively the same as that reported for wild type mice muscle [14]. This may be an overestimate because of Cu/Zn-SOD (product of the SOD1 gene) activity outside the inner membrane. If we take the empirical value of 50% matrix-directed from Muller et al. [14] measured in SOD1 knockout mice and apply it to rat skeletal muscle mitochondria, then correction for matrix peroxidase activity using the equation in Figure 3 raises this value to 63% matrix-directed superoxide production, which now becomes the best estimate of the topology of site IIIQo currently available for intact mitochondria.
Next, we turn to the relationship between ROS production by site IF and the degree of NAD(P)H reduction, a proxy for matrix NADH/NAD+. In isolated complex I, the rate of superoxide production from site IF depends on the NADH/NAD+ ratio [33;34]. In isolated mitochondria, there was no difference between control and CDNB-pretreatment in the % reduction of NAD(P)H, measured by autofluorescence, in response to increasing amounts of rotenone with 5 mM malate as substrate (Figure 7B). CDNB-pretreated mitochondria displayed the anticipated strong relationship between H2O2 efflux and cofactor reduction over the entire range of measured NAD(P)H autofluorescence. In contrast, control mitochondria showed a marked lack of responsiveness in H2O2 efflux over a large range of cofactor reduction (Figure 7C). This point indicates that only in the CDNB-pretreated mitochondria did we recapitulate the characterized response between NADH/NAD+ ratio and superoxide production by the flavin of isolated complex I [33;34].
We conclude that in intact mitochondria, endogenous H2O2-consuming processes scavenge significant amounts of H2O2 before it diffuses out of the matrix and is detected by assays designed to report matrix superoxide production. Comparison of the increases in ROS production by CDNB-pretreated mitochondria and SMPs (Figure 3, Figure 5) suggests that CDNB pretreatment largely overcomes the effects of soluble matrix peroxidase activities, and the rates in intact mitochondria after CDNB pretreatment are not greatly compromised by further unidentified peroxidase activities. Additionally, although skeletal muscle mitochondria lack catalase [24], the presence of mitochondrial catalase, as in rat heart, may not be a limitation to the CDNB-pretreatment. This is because the contribution to H2O2 decomposition by mitochondrial catalase is small compared to glutathione peroxidase [36].
Despite the experimental caveats that come with CDNB-pretreatment, by limiting the amount of CDNB exposure to that needed for GSH depletion, followed by washing to remove unreacted CDNB, H2O2 losses by H2O2-consuming processes can be minimized. CDNB-pretreatment can greatly improve the resolution and sensitivity of the assay, particularly at very low rates of production. This may be of critical importance to understanding the mechanism of ROS production (Figure 7C). Furthermore, CDNB-pretreatment makes it possible to derive a correction equation, at least for the major endogenous H2O2-consuming process that compromise the use of the extramitochondrial detection system. This equation is given in Figure 3 for rat muscle mitochondria under the current experimental conditions. Because of the non-linear nature of the correction, it should be applied to raw data before subtraction of inhibitor-sensitive or insensitive rates – such subtraction should only be carried out after correction. The correction was robust from approximately 0.2 to > 2.5 nmol H2O2 • min−1 • mg protein−1 from several sites of production. It is important to stress that this correction curve is likely to be tissue- and species-specific because of differences in matrix levels of GSH and GSH-metabolizing enzymes [22;25-29], and the correction will need to be re-measured for each new experimental situation.
Experimental Procedures
Animals and reagents
Female Wistar rats, aged between 5-8 weeks, were purchased from Harlan Laboratories and allowed ad libitum access to chow and water. Animal housing, husbandry and sampling procedures were approved by the Buck Institute Animal Care Committee. All reagents were purchased from Sigma or EMD Bioscience except Amplex UltraRed, which was from Invitrogen. A Pierce BCA kit was used for protein quantification following disruption of mitochondria by addition of deoxycholate to 0.1% w/v.
Mitochondrial isolation
Animals were anaesthetized with CO2 and killed by cervical dislocation. Both rear hind limbs, as well as the musculature lateral to the spine, were dissected out and rinsed in ice-cold Chappell-Perry buffer (CP1; 100 mM KCl, 50 mM Tris, 2 mM EGTA, pH 7.1 at 25°C). Muscle was treated and homogenized according to [37] and mitochondria were prepared by standard differential centrifugation, resuspended in CP1 and kept on ice until used.
Treatment of mitochondria with CDNB and monochlorobimane (MCB)
Treatment of mitochondria with 1-chloro-2,4-dinitrobenzene was based on [11]. Muscle mitochondria were incubated for 5 min at 20-25°C at 5 mg protein·ml−1 in CP1 with 35 μM CDNB, or ethanol control. Mitochondria were then mixed with an equal volume of ice-cold CP1 and centrifuged for 5 min at 15 000 g (at 2-4°C). The pellet was washed twice by resuspending in ice-cold CP1 and centrifuging as above to remove residual CDNB. The final pellet was resuspended at approximately 20 mg protein·ml−1.
Treatment of mitochondria with monochlorobimane (MCB) as a GSH-depleting agent was the same, but incubation was for 30 min at 20-25°C with 500 μM MCB, or ethanol control.
GSH content
Mitochondrial GSH content was measured fluorometrically in a Shimadzu RF-5301PC spectrofluorophotometer by an enzymatic glutathione S-transferase-linked MCB assay [38;39]. Mitochondria were extracted for at least 10 min on ice in 1% (v/v) trichloroacetic acid. The suspension was centrifuged at 15 000 g for 5 min and the supernatant was neutralized to about pH 7 with 0.5 M Tris (pH 7.4 at 25°C). Neither increasing the concentration of trichloroacetic acid nor sonication increased the amount of mitochondrial GSH extracted. 100 μM MCB (in ethanol) was added to the neutralized extract, or similarly prepared GSH standards, and the GSH concentration was determined as the increase in fluorescence (excitation 390 nm, emission 478 nm) following the addition of 1 U·ml−1 glutathione S-transferase and incubation at 20-25°C in the dark for 30 min.
Superoxide production
The rate of superoxide production was measured indirectly by coupling the dismutation of superoxide to H2O2, which was detected by its reaction with exogenous horseradish peroxidase and subsequent reaction with Amplex UltraRed, forming a stable, highly fluorescent product. The assay buffer contained 120 mM KCl, 5 mM Hepes, 1 mM EGTA, 0.1 μg·ml−1 oligomycin and 0.3 % (w/v) BSA (pH 7.0 at 37 °C). The assay system included the following as an H2O2 detection system: 5 U·ml−1 horseradish peroxidase, 25 U·ml−1 SOD and 50 μM Amplex UltraRed. Exogenous SOD was added to ensure that any superoxide released to the intermembrane space was rapidly to converted to H2O2 to ensure detection and prevent direct interaction with horseradish peroxidase [14]. Reactions were monitored fluorometrically (excitation 563 nm, emission 587 nm) at 37°C with constant stirring and were generally started by the addition of substrate, rather than mitochondria, because addition of mitochondria (approximately 0.1-0.35 mg protein·ml−1) to the assay medium without exogenous substrate caused a small but detectable rate of fluorescence change, which was subtracted from all other rates. Rates of change in relative fluorescence units were converted to molar rates of change by standard curves produced by the addition of known amounts of H2O2.
Mitochondrial H2O2 consumption
To assess the effect of CDNB treatment on the mitochondrial capacity for H2O2 removal, an assay based on the H2O2 detection assay was used. Mitochondria were added (0.2 mg protein·ml−1) to the same assay buffer and reaction constituents as the superoxide detection assay, at 37°C, but with the omission of horseradish peroxidase. Hydrogen peroxide was added (3 nmol in 2 ml final volume) to a mixing cuvette with 5 U·ml−1 horseradish peroxidase already present, to determine the initial fluorescent signal, or to cuvettes where 5 U·ml−1 horseradish peroxidase was added after incubation for 1-3 min to determine the H2O2 remaining.
NAD(P)H autofluorescence
The degree of reduction of the NAD(P)H mitochondrial cofactor pool was measured in the same assay buffer as used for superoxide production (the presence of the H2O2 detection system had negligible effect and was omitted for most autofluorescence experiments). Detailed explanation of the autofluorescence protocol can be found in Supplementary figure 1, and the associated legend. Briefly, the autofluorescence of the NAD(P)H pool was monitored using excitation at 365 nm and emission at 450 nm. Mitochondria (generally 0.3 mg protein·ml−1) were added and left mixing in a de-energized state at 37°C for 3 min and the fluorescence value was taken as 0% reduction of the nicotinamide cofactors. The fluorescence value obtained following the addition of 5 mM malate and 4 μM rotenone was taken as the signal from the fully reduced cofactor pool. All other values were determined as % NAD(P)H relative to the determined 0 and 100% values.
Submitochondrial particles and flavin mononucleotide (FMN)
Muscle mitochondrial were isolated and frozen (−80°C) until used. Submitochondrial particles were prepared from freeze-thawed muscle mitochondria according to [40] and used directly or, in some cases for FMN and protein quantification only, frozen for later analysis. For comparison of the rates of respiration and superoxide production between intact muscle mitochondria and SMPs, data were normalized to the amount of complex I. Complex I was determined by measuring the FMN content in each preparation fluorometrically (excitation 450 nm, emission 525 nm) following trichloroacetic acid extraction as described by Burch [41]. An initial FAD contribution of 15% fluorescence on a mole-to-mole basis at the assay pH was assumed and riboflavin was used as the fluorescent standard [41].
Respiration
Oxygen consumption was measured in a water-jacketed cell, fitted with a Clark-type oxygen electrode (Rank Brothers, Bottisham, Cambridge, UK), maintained at 37°C using a circulating water bath. Respiration medium contained 120 mM KCl, 3 mM Hepes, 5 mM potassium phosphate, 1 mM EGTA and 0.3% (w/v) BSA (pH 7.0 at 37°C).
Statistics and data presentation
All data are presented as mean ± SEM unless otherwise stated. Means were compared by t-test (paired when appropriate) assuming 2-tailed distribution with p < 0.05 being considered significant. Curves were fit by non-linear regression. The correction curve for the CDNB-pretreated mitochondria was determined using a hyperbola fitted to the following:
Where A is the maximal increase in observed H2O2 production with CDNB-pretreatment and B is the control H2O2 production rate that corresponds to half the maximal increase with CDNB-pretreatment. This curve was fitted using least-squares nonlinear regression.
Supplementary Material
Acknowledgements
Supported by grants from the National Institutes of Health (P01 AG025901, PL1 AG032118, P30 AG025708 and R01 AG033542) and The Ellison Medical Foundation (AG-SS-2288-09).
Abbreviations
- αKG
α-ketoglutarate
- αKGDH
α-ketoglutarate dehydrogenase complex
- AA
antimycin A
- ASP
aspartate
- CDNB
1-chloro-2,4-dinitrobenzene
- CP1
Chappell-Perry buffer
- FCCP
carbonylcyanide-p-trifluoromethoxyphenylhydrazone
- FMN
flavin mononucleotide
- Fum
fumarate
- GOT
glutamate-oxaloacetate transaminase
- MCB
monochlorobimane
- MDH
malate dehydrogenase
- Q
ubiquinone
- QH2
ubiquinol
- Qo
outer Q binding site of complex III
- Qi
inner Q binding site of complex III
- ROS
reactive oxygen species
- Rot
rotenone
- Site IF
the superoxide forming site of complex I associated with the flavin moiety
- Site IQ
the superoxide forming site of complex I associated with the ubiquinone binding region
- SOD
superoxide dismutase
- SMP
submitochondrial particles
- Stig
stigmatellin
References
- 1.Fleury C, Mignotte B, Vayssiere JL. Mitochondrial reactive oxygen species in cell death signaling. Biochimie. 2002;84:131–141. doi: 10.1016/s0300-9084(02)01369-x. [DOI] [PubMed] [Google Scholar]
- 2.Balaban RS, Nemoto S, Finkel T. Mitochondria, oxidants, and aging. Cell. 2005;120:483–495. doi: 10.1016/j.cell.2005.02.001. [DOI] [PubMed] [Google Scholar]
- 3.Newsholme P, Haber EP, Hirabara SM, Rebelato EL, Procopio J, Morgan D, Oliveira-Emilio HC, Carpinelli AR, Curi R. Diabetes associated cell stress and dysfunction: role of mitochondrial and non-mitochondrial ROS production and activity. J Physiol. 2007;583:9–24. doi: 10.1113/jphysiol.2007.135871. [DOI] [PMC free article] [PubMed] [Google Scholar]
- 4.Guo WX, Pye QN, Williamson KS, Stewart CA, Hensley KL, Kotake Y, Floyd RA, Broyles RH. Reactive oxygen species in choline deficiency-induced apoptosis in rat hepatocytes. Free Radic. Biol Med. 2004;37:1081–1089. doi: 10.1016/j.freeradbiomed.2004.06.036. [DOI] [PubMed] [Google Scholar]
- 5.Beal MF. Mitochondria take center stage in aging and neurodegeneration. Ann. Neurol. 2005;58:495–505. doi: 10.1002/ana.20624. [DOI] [PubMed] [Google Scholar]
- 6.Lin MT, Beal MF. Mitochondrial dysfunction and oxidative stress in neurodegenerative diseases. Nature. 2006;443:787–795. doi: 10.1038/nature05292. [DOI] [PubMed] [Google Scholar]
- 7.Boveris A, Oshino N, Chance B. The cellular production of hydrogen peroxide. Biochem J. 1972;128:617–630. doi: 10.1042/bj1280617. [DOI] [PMC free article] [PubMed] [Google Scholar]
- 8.Loschen G, Flohe L, Chance B. Respiratory chain linked H(2)O(2) production in pigeon heart mitochondria. FEBS Lett. 1971;18:261–264. doi: 10.1016/0014-5793(71)80459-3. [DOI] [PubMed] [Google Scholar]
- 9.Loschen G, Azzi A, Flohe L. Mitochondrial H2O2 formation: relationship with energy conservation. FEBS Lett. 1973;33:84–87. doi: 10.1016/0014-5793(73)80165-6. [DOI] [PubMed] [Google Scholar]
- 10.Chinta SJ, Rane A, Yadava N, Andersen JK, Nicholls DG, Polster BM. Reactive oxygen species regulation by AIF-and complex I-depleted brain mitochondria. Free Radic. Biol Med. 2009 doi: 10.1016/j.freeradbiomed.2009.01.010. [DOI] [PMC free article] [PubMed] [Google Scholar]
- 11.Han D, Canali R, Rettori D, Kaplowitz N. Effect of glutathione depletion on sites and topology of superoxide and hydrogen peroxide production in mitochondria. Mol Pharmacol. 2003;64:1136–1144. doi: 10.1124/mol.64.5.1136. [DOI] [PubMed] [Google Scholar]
- 12.Lambert AJ, Brand MD. Inhibitors of the quinone-binding site allow rapid superoxide production from mitochondrial NADH:ubiquinone oxidoreductase (complex I) J Biol. Chem. 2004;279:39414–39420. doi: 10.1074/jbc.M406576200. [DOI] [PubMed] [Google Scholar]
- 13.Lambert AJ, Brand MD. Superoxide production by NADH:ubiquinone oxidoreductase (complex I) depends on the pH gradient across the mitochondrial inner membrane. Biochem J. 2004;382:511–517. doi: 10.1042/BJ20040485. [DOI] [PMC free article] [PubMed] [Google Scholar]
- 14.Muller FL, Liu Y, Van Remmen H. Complex III releases superoxide to both sides of the inner mitochondrial membrane. J Biol Chem. 2004;279:49064–49073. doi: 10.1074/jbc.M407715200. [DOI] [PubMed] [Google Scholar]
- 15.Starkov AA, Fiskum G, Chinopoulos C, Lorenzo BJ, Browne SE, Patel MS, Beal MF. Mitochondrial alpha-ketoglutarate dehydrogenase complex generates reactive oxygen species. J Neurosci. 2004;24:7779–7788. doi: 10.1523/JNEUROSCI.1899-04.2004. [DOI] [PMC free article] [PubMed] [Google Scholar]
- 16.Starkov AA, Fiskum G. Regulation of brain mitochondrial H2O2 production by membrane potential and NAD(P)H redox state. J Neurochem. 2003;86:1101–1107. doi: 10.1046/j.1471-4159.2003.01908.x. [DOI] [PubMed] [Google Scholar]
- 17.Drose S, Brandt U. The mechanism of mitochondrial superoxide production by the cytochrome bc1 complex. J Biol Chem. 2008;283:21649–21654. doi: 10.1074/jbc.M803236200. [DOI] [PubMed] [Google Scholar]
- 18.Gyulkhandanyan AV, Pennefather PS. Shift in the localization of sites of hydrogen peroxide production in brain mitochondria by mitochondrial stress. J Neurochem. 2004;90:405–421. doi: 10.1111/j.1471-4159.2004.02489.x. [DOI] [PubMed] [Google Scholar]
- 19.Miwa S, Brand MD. The topology of superoxide production by complex III and glycerol 3-phosphate dehydrogenase in Drosophila mitochondria. Biochim. Biophys. Acta. 2005;1709:214–219. doi: 10.1016/j.bbabio.2005.08.003. [DOI] [PubMed] [Google Scholar]
- 20.St Pierre J, Buckingham JA, Roebuck SJ, Brand MD. Topology of superoxide production from different sites in the mitochondrial electron transport chain. J Biol Chem. 2002;277:44784–44790. doi: 10.1074/jbc.M207217200. [DOI] [PubMed] [Google Scholar]
- 21.Han D, Williams E, Cadenas E. Mitochondrial respiratory chain-dependent generation of superoxide anion and its release into the intermembrane space. Biochem J. 2001;353:411–416. doi: 10.1042/0264-6021:3530411. [DOI] [PMC free article] [PubMed] [Google Scholar]
- 22.Zoccarato F, Cavallini L, Deana R, Alexandre A. Pathways of hydrogen peroxide generation in guinea pig cerebral cortex mitochondria. Biochem Biophys. Res. Commun. 1988;154:727–734. doi: 10.1016/0006-291x(88)90200-8. [DOI] [PubMed] [Google Scholar]
- 23.Liu Y, Fiskum G, Schubert D. Generation of reactive oxygen species by the mitochondrial electron transport chain. J Neurochem. 2002;80:780–787. doi: 10.1046/j.0022-3042.2002.00744.x. [DOI] [PubMed] [Google Scholar]
- 24.Phung CD, Ezieme JA, Turrens JF. Hydrogen peroxide metabolism in skeletal muscle mitochondria. Arch. Biochem Biophys. 1994;315:479–482. doi: 10.1006/abbi.1994.1528. [DOI] [PubMed] [Google Scholar]
- 25.McKernan TB, Woods EB, Lash LH. Uptake of glutathione by renal cortical mitochondria. Archives of Biochemistry and Biophysics. 1991;288:653–663. doi: 10.1016/0003-9861(91)90248-h. [DOI] [PubMed] [Google Scholar]
- 26.Griffith OW, Meister A. Origin and turnover of mitochondrial glutathione. Proc. Natl. Acad. Sci. U. S. A. 1985;82:4668–4672. doi: 10.1073/pnas.82.14.4668. [DOI] [PMC free article] [PubMed] [Google Scholar]
- 27.Colell A, Garcia-Ruiz C, Morales A, Ballesta A, Ookhtens M, Rodes J, Kaplowitz N, Fernandez-Checa JC. Transport of reduced glutathione in hepatic mitochondria and mitoplasts from ethanol-treated rats: effect of membrane physical properties and S-adenosyl-L-methionine. Hepatology. 1997;26:699–708. doi: 10.1002/hep.510260323. [DOI] [PubMed] [Google Scholar]
- 28.Martensson J, Meister A. Mitochondrial damage in muscle occurs after marked depletion of glutathione and is prevented by giving glutathione monoester. Proc. Natl. Acad. Sci. U. S. A. 1989;86:471–475. doi: 10.1073/pnas.86.2.471. [DOI] [PMC free article] [PubMed] [Google Scholar]
- 29.Ji LL, Dillon D, Wu E. Alteration of antioxidant enzymes with aging in rat skeletal muscle and liver. Am J Physiol Regul Integr Comp Physiol. 1990;258:R918–R923. doi: 10.1152/ajpregu.1990.258.4.R918. [DOI] [PubMed] [Google Scholar]
- 30.Han D, Antunes F, Canali R, Rettori D, Cadenas E. Voltage-dependent anion channels control the release of the superoxide anion from mitochondria to cytosol. J Biol Chem. 2003;278:5557–5563. doi: 10.1074/jbc.M210269200. [DOI] [PubMed] [Google Scholar]
- 31.KLINGENBERG M, PETTE D. Proportions of mitochondrial enzymes and pyridine nucleotides. Biochem Biophys. Res. Commun. 1962;7:430–432. doi: 10.1016/0006-291x(62)90329-7. [DOI] [PubMed] [Google Scholar]
- 32.ESTABROOK RW. Fluorometric measurement of reduced pyridine nucleotide in cellular and subcellular particles. Anal Biochem. 1962;4:231–245. doi: 10.1016/0003-2697(62)90006-4. [DOI] [PubMed] [Google Scholar]
- 33.Hirst J, King MS, Pryde KR. The production of reactive oxygen species by complex I. Biochem Soc. Trans. 2008;36:976–980. doi: 10.1042/BST0360976. [DOI] [PubMed] [Google Scholar]
- 34.Kussmaul L, Hirst J. The mechanism of superoxide production by NADH:ubiquinone oxidoreductase (complex I) from bovine heart mitochondria. Proc. Natl. Acad. Sci. U. S. A. 2006;103:7607–7612. doi: 10.1073/pnas.0510977103. [DOI] [PMC free article] [PubMed] [Google Scholar]
- 35.Miwa S, St Pierre J, Partridge L, Brand MD. Superoxide and hydrogen peroxide production by Drosophila mitochondria. Free Radic. Biol Med. 2003;35:938–948. doi: 10.1016/s0891-5849(03)00464-7. [DOI] [PubMed] [Google Scholar]
- 36.Antunes F, Han D, Cadenas E. Relative contributions of heart mitochondria glutathione peroxidase and catalase to H2O2 detoxification in in vivo conditions. Free Radical Biology and Medicine. 2002;33:1260–1267. doi: 10.1016/s0891-5849(02)01016-x. [DOI] [PubMed] [Google Scholar]
- 37.Rolfe DFS, Hulbert AJ, Brand MD. Characteristics of mitochondrial proton leak and control of oxidative phosphorylation in the major oxygen-consuming tissues of the rat. Biochim. Biophys. Acta. 1994;1188:405–416. doi: 10.1016/0005-2728(94)90062-0. [DOI] [PubMed] [Google Scholar]
- 38.Fernández-Checa JCKN. The use of monochlorobimane to determine hepatic GSH levels and synthesis. Anal Biochem. 1990;190:212–219. doi: 10.1016/0003-2697(90)90183-a. [DOI] [PubMed] [Google Scholar]
- 39.Kamencic HLAPPJBH. Monochlorobimane fluorometric method to measure tissue glutathione. Anal Biochem. 2000;286:35–37. doi: 10.1006/abio.2000.4765. [DOI] [PubMed] [Google Scholar]
- 40.Harmon HJ. Isolation of totally inverted submitochondrial particles by sonication of beef heart mitochondria. J Bioenerg. Biomembr. 1982;14:377–386. doi: 10.1007/BF00743065. [DOI] [PubMed] [Google Scholar]
- 41.Burch HB. Fluorimetric assay of FAD, FMN and riboflavin. Meth. Enzym. 1957;3:960–963. [Google Scholar]
Associated Data
This section collects any data citations, data availability statements, or supplementary materials included in this article.