

Abstract
The degree of synchronization in electroencephalography (EEG) signals is commonly characterized by the time-series measures, namely, correlation, phase synchrony, and magnitude squared coherence (MSC). However, it is now well established that the interpretation of the results from these measures are confounded by the recording reference signal and that this problem is not mitigated by the use of other EEG montages, such as bipolar and average reference. In this paper, we analyze the impact of reference signal amplitude and power on EEG signal correlation, phase synchrony, and MSC. We show that, first, when two nonreferential signals have negative correlation, the phase synchrony and the absolute value of the correlation of the two referential signals may have two regions of behavior characterized by a monotonic decrease to zero and then a monotonic increase to one as the amplitude of the reference signal varies in [0, +∞). It is notable that even a small change of the amplitude may lead to significant impact on these two measures. Second, when two nonreferential signals have positive correlation, the correlation and phase-synchrony values of the two referential signals can monotonically increase to one (or monotonically decrease to some positive value and then monotonically increase to one) as the amplitude of the reference signal varies in [0, +∞). Third, when two nonreferential signals have negative cross-power, the MSC of the two referential signals can monotonically decrease to zero and then monotonically increase to one as reference signal power varies in [0, +∞). Fourth, when two nonreferential signals have positive cross-power, the MSC of the two referential signals can monotonically increase to one as the reference signal power varies in [0, +∞). In general, the reference signal with small amplitude or power relative to the signals of interest may decrease or increase the values of correlation, phase synchrony, and MSC. However, the reference signal with high relative amplitude or power will always increase each of the three measures. In our previous paper, we developed a method to identify and extract the reference signal contribution to intracranial EEG (iEEG) recordings. In this paper, we apply this approach to referential iEEG recorded from human subjects and directly investigate the contribution of recording reference on correlation, phase synchrony, and MSC. The experimental results demonstrate the significant impact that the recording reference may have on these bivariate measures.
Keywords: Bipolar electroencephalography (EEG), coherence, corrected EEG, correlation, phase synchrony, referential EEG, scalp reference signal, spectral power
I. Introduction
THE UNSURPASSED temporal resolution and connection to brain function have led to the widespread use of electroencephalography (EEG) in medical practice and scientific research [2]–[5]. The neuronal mechanism underlying EEG and the local field potentials recorded with intracranial EEG (iEEG) using intracranial electrodes (Fig. 2) are largely related to the synchronization of neuronal assemblies and their synaptic currents [6]. There is strong evidence that one of the fundamental neural mechanisms underlying normal and pathological brain activity is the synchronization of neuronal assemblies [7]–[9]. This has led to widespread interest in quantitative measures of EEG synchronization [7]. It has been noted that neuronal assemblies are characterized by the synchronous activity of their constituent neurons, and different EEG frequency components also reveal synchronies relating to different perceptual, motor, or cognitive states [7], [10]–[20].
Fig. 2.
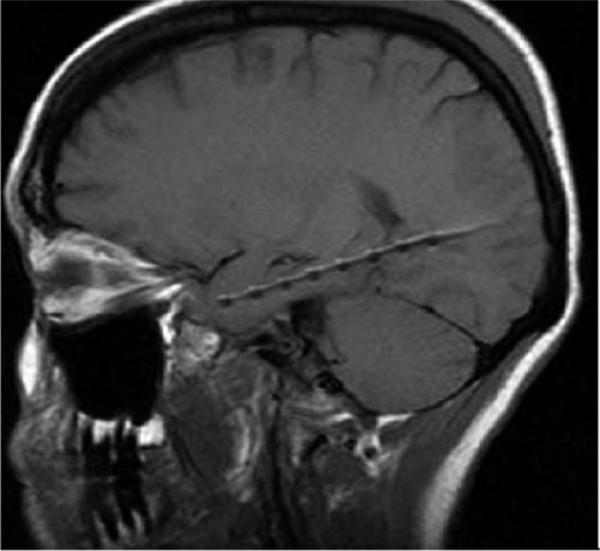
MRI shows depth electrode (Adtech, Inc.) implanted along the longitudinal axis of the hippocampus using a posterior burr hole.
The synchronization of neuronal assemblies has been widely studied using the following three measures: correlation (such as cross correlation), phase synchrony (such as mean phase coherence), and coherence [such as magnitude squared coherence (MSC)]. Cross correlation measures the linear correlation between two signals in the time domain [21]. Phase synchrony is a direct index of neural synchrony and is defined by a phase locking value, ranging from zero (no synchronization) to one (perfect synchronization). Coherence identifies the synchrony of neuronal assemblies as a function of the correlation of EEG frequency components. For iEEG, the neural generators are the local assemblies of coherent neurons with common spectral properties. Each of these measures have been used extensively to assess neural synchrony in human electrophysiological studies of brain function and disease. The typical finding is that, in a given pathological state or in a perceptual, cognitive, or motor task, the EEG correlation, coherence, or synchrony increases (or decreases) [7], [13], [19], [22]–[31].
Recently, the difficulties associated with using common referential EEG recordings for correlation analysis [32], coherence analysis [29], [33], [34], and phase-synchrony analysis [22], [32], [35] have been raised and are now well established. Unfortunately, all the aforementioned references investigating neuronal synchronization have used either common referential EEG recordings or common reference-free EEG recordings, such as bipolar EEG, average common reference EEG, and Laplacian EEG.
The confounding effect of a common reference is not entirely resolved with what are called reference-free recordings. The bipolar EEG, obtained by subtracting the potentials of two nearby electrodes, will remove all signals common to the two channels, including the common reference. In addition, a given bipolar montage will completely miss dipoles with certain locations and tangential orientations, and not all signals common to the two electrodes are from the reference. Caution against the use of bipolar EEG for coherence analysis was given [36], [37]. Although the average reference EEG and Laplacian EEG are reference free, caution against their use for synchronization analysis was given [32].
In our recent work [1], we proposed two methods to extract the scalp reference signal from clinical multichannel iEEG recordings based on independent component analysis [38], [39] and stated why the obtained signal is a “good” estimation of the real reference signal. The corrected EEG, or true reference-free EEG, can now be obtained by removing the reference signal.
II. Methods and Material
Given two time series x(t) and y(t), the correlation of x(t) and y(t) is defined as
| (1) |
where x and y are assumed to have zero mean and E[·] is the expected value of one random variable.
Phase synchrony, or mean phase coherence [40], of x(t) and y(t) is defined as
| (2) |
where ϕx(t) and ϕy(t) denote the phase variables of x(t) and y(t), N is the window sample size, and
| (3) |
for an arbitrary signal s(t) using the Hilbert transform
| (4) |
(p.v. denoting the Cauchy principle value).
The coherence of x(t) and y(t) is defined as
where Sxx(w) and Syy(w) are auto-power spectral densities (PSDs) of x(t) and y(t), respectively, and Sxy(w) is their cross-power spectrum. Therefore, the MSC of x(t) and y(t) is defined as
| (5) |
In the following, we investigate the effect of recording reference on the aforementioned measures of neural synchronization. Let R(t) = Ar(t) denote the potential signal at the reference electrode where coefficient A > 0, and let bi be the potential signal at the ith intracranial or scalp electrode, where i = 1, 2. Now, let xi(t) denote bi(t) referenced to R(t), i.e., xi(t) = R(t) – bi(t), i = 1, 2. Now, we aim to discuss the effect of R(t) on the correlation, phase synchrony, and MSC of nonreferential signals b1(t) and b2(t) as measured from referential signals x1(t) and x2(t). To do so, next, we obtain analytical expressions for the three measures and establish the relationship among R(= Ar), b1, b2, x1, and x2.
A. Correlation
For simplicity, we assume that r, b1, and b2 have a mean of zero and a variance of one. From (1), it follows that
| (6) |
| (7) |
Thus, is a function of coefficient A, where A > 0. Based on (7), it is easy to see that as A → +∞. Therefore, and as expected when A is large enough, the correlation of two referential signals x1 and x2 will be larger than that of nonreferential signals b1 and b2. In general, it is not easy to discuss the critical points for because these points depend on the values of E[rb1], E[rb2], and E[b1b2]. For simplicity, we further assume E[rb1] = E[rb2] = c. Obviously, –1 ≤ c ≤ 1 and –1 ≤ E[b1b2] ≤ 1 by noting that r, b1, and b2 have a mean of zero and a variance of one. Then, (7) becomes
| (8) |
Since A2–2cA+1 has a minimum value at A = c, one can see that, when –1 ≤ c ≤ 0, monotonically increases as A(> 0) increases. Fig. 1(A) and (B)(b) show examples of the function according to negative and positive correlations of nonreferential signals b1 and b2, respectively. When 0 ≤ c ≤ 1, monotonically decreases from to as A varies in [0, c] and then start to monotonically increase to one as A varies in [c, +∞]. Fig. 1(B)(a) shows examples of the function according to positive correlations of nonreferential signals b1 and b2. It should be pointed out that the resulting curve from the absolute values of each curve in Fig. 1(A) decreases to zero and then starts to increase to one when A varies in [0, +∞). Moreover, even a small change of coefficient A may lead to a significant impact on correlation values [for example, see the curve corresponding to in Fig. 1(A)].
Fig. 1.

(A) Correlation of two referential signals as a function of coefficient A where nonreferential signals have negative correlation. (B) Correlation of two referential signals as a function of coefficient A where nonreferential signals have positive correlation. Each curve in (A) and (B) was evaluated based on (6), where r, b1, and b2 were generated randomly with zero mean and r is not uncorrelated with b1 and b2. (C) Mean phase coherence of two referential signals as a function of coefficient A where nonreferential signals have negative correlation. (D) Mean phase coherence of two referential signals as a function of coefficient A where nonreferential signals have positive correlation. Each curve in (C) and (D) was evaluated based on (2), where r, b1, and b2 were generated randomly with zero means and r is not uncorrelated with b1 and b2. (E) MSC of two referential signals as a function of reference signal power where nonreferential signals have negative cross-power ranging from –0.1 to –1.0 in steps of –0.1. (F) MSC of two referential signals as a function of reference signal power where nonreferential signals have positive cross-power ranging from 0.1 to 1.0 in steps of 0.1. Each curve in (E) and (F) was evaluated based on (13).
B. Phase Synchrony (i.e., Mean Phase Coherence)
From (3) and (4), it follows that
| (9) |
Combining (2) and (9), we see that phase synchrony between x1 and x2 is a function of A and defined as . From (9), we can get
| (10) |
Thus, we have
As a result, from (2), we obtain
Therefore, when coefficient A is large enough, the phase synchrony of two referential signals x1 and x2 will be larger than that of nonreferential signals b1 and b2.
In general, it is difficult to get the critical points for . Here, we performed simulations for based on nonreferential signals b1 and b2 having negative and positive correlations. The simulation results show that, first, may monotonically increase as A (> 0) increases when nonreferential signals b1 and b2 have positive correlations [see Fig. 1(D)(b)]. Second, may monotonically decrease to zero and then monotonically increase to one as A (> 0) increases when nonreferential signals b1 and b2 have negative correlations [see Fig. 1(C)]. Third, may monotonically decrease to some positive values and then monotonically increase to one as A (> 0) increases when nonreferential signals b1 and b2 have positive correlations [see Fig. 1(D)(a)]. Similar to the results for correlation, it should be noted that even a small change of coefficient A may lead to significant impact on phase-synchrony values [for example, see the curve corresponding to in Fig. 1(C)].
C. MSC
We assume that both of the nonreferential signals b1(t) and b2(t) are not correlated with the reference signal R(t). In this case, based on (5), we can write the MSC of referential signals x1 and x2 as
| (11) |
(see [34] and [36] for details). From (11), an upper bound can be derived as follows:
| (12) |
which has been previously reported [36]. The authors [36] employed this bound to examine the effect of the reference signal R(t) on the MSC of nonreferential signals b1(t) and b2(t) and argue that, under the assumption that the scalp reference signal is not correlated with the iEEGs being studied, the reference signal will have a limited impact upon coherence measurements when the power of the reference signal is smaller than the power of the intracranial signals at every frequency. However, in the following, we show that the conclusion is true only for positive cross correlations in (11). The reason is that the cross-power may be negative, and in (12), only the absolute value of the cross-power is used. In (11), if we further assume that , which is similarly assumed in [36], (11) becomes
| (13) |
Therefore, given , is a function of SRR(w) (> 0). If , then the right-hand side of (13) is the same as the upper bound in (12) and monotonically increases to one as SRR(w) increases in [0, +∞), which is discussed in [36]. In Fig. 1(F), one can see that is a monotonic increasing function of reference signal power for each given positive cross-power . Hence, in this case, the MSC value of two referential signals x1 and x2 is always greater than that of nonreferential signals b1 and b2, i.e., the reference signal always increases MSC in this case, and only in this case is the conclusion in [36] true. If , then it is easy to get the critical point at from (13). In this case, monotonically decreases to zero as SRR(w) varies in and monotonically increases to one as SRR(w) varies in . Fig. 1(E) shows that the reference signal may actually decrease or increase MSC. The following should be pointed out: 1) Reference signal power may have a significant impact on MSC (for example, see the curve corresponding to in Fig. 1(E). In this case, from the curve when reference signal power = 0.5 = 0.5× the power of nonreferential signal b1 or b2, the value is sharply changed from 1 to a value below 0.1), and 2) even if reference signal power is greater than the power of nonreferential signals b1 and b2, the effect at a given frequency may not be considerable (for example, see the curve corresponding to in Fig. 1(E). In this case, from the curve when reference signal power = 5 = 5× the power of nonreferential signal b1 or b2, the value is not much different from ).
D. Experimental Studies
In this section, we describe the application of the aforementioned measures of neuronal synchrony to iEEG from a patient undergoing evaluation for epilepsy surgery. The patient underwent implantation of right and left temporal depth electrodes (RTD and LTD, Fig. 2). The depth electrodes were placed via a posterior burr hole and implanted along the long axes of the hippocampus, with contact 1 targeted at the amygdala. The patient had 20 scalp electrodes placed according to the international 10–20-configuration gold 1-cm disks adhered to the scalp with glue and filled with a conductive salt gel and confirmed to have lower than 2.0-kΩ impedance at 1 kHz.
The iEEG and scalp EEG were acquired using a stainless steel suture placed in the vertex region of the scalp, midline between the Cz and Fz electrode positions (international 10–20) as a common reference. The scalp suture electrode is relatively isolated from the intracranial electrodes by the intervening layers of cerebrospinal fluid, bone, muscle, and scalp. These layers serve to distribute and attenuate the signal in such a way that approximately 7 cm2 of coordinated cortical activity is required to produce a clear detectable deflection on the scalp [41]. In practice, the reference electrode serves the purpose primarily of rejecting common-mode potentials generated by muscular contraction and body movement, which are conducted to the intracranial vault. Unfortunately, it also introduces artifacts unique to the scalp site.
The data were acquired on an XLTek EEG 128 system that digitizes each channel at 500 Hz using a predigitization analog high-pass filter at 0.01 Hz and a low-pass filter at 125 Hz. The time-series measures estimated were the PSD, correlation, phase synchrony (mean phase coherence in this paper), and MSC. The PSD and MSC were estimated using Welch's method and a 512-sample Hamming window with a 256-sample overlap.
The raw data used for analysis were filtered using a finite-impulse-response filter in the frequency band from 1–70 Hz for iEEG and 1–50 Hz for scalp EEG. For the calculation of the correlation, a 1-s sliding window was advanced by one sample point, and at each point, the average value of the correlation was calculated for 100 points. For the mean phase coherence, a 10-s sliding window with half-overlap was used. A range of windows, 1–10 s, and overlaps were tested without a significant change in the results.
III. Results
The patient underwent iEEG monitoring using eight contact depth electrodes placed within the right and left medial temporal lobes and 20 surface electrodes at F7, T7, P7, Fp1, F3, C3, P3, O1, Fpz, Fz, Cz, Pz, Oz, Fp2, F4, C4, P4, F8, T8, and P8 (international 10–20) recorded from the same vertex reference electrode all sampled at 500 Hz. Each data segment analyzed contains 50 000 samples (100 s) and was obtained in the quite awake resting state. See patient 2 in [1] for details.
Four representative left and right adjacent channels from iEEG recordings (LTD3–LTD6 and RTD3–RTD6) are shown in Fig. 3, where only 10 of 100 s are shown representatively. The reference signal (R2) in Fig. 3(A) was calculated based on the second method in [1] by using the entire time period (100 s) and all 16 iEEG channels (where we want to point out that the equivalence between Models (1) and (3) in [1] plays an important role in the R2 method and is usually true for real EEG data). In Fig. 3(A), the second eight channels (LTD3–LTD6 and RTD3–RTD6) are the corrected iEEG and were obtained by subtracting the calculated reference signal (R2) from the original referential iEEG. It is easy to see that each referential iEEG channel was contaminated by muscle artifacts that are removed in the corrected iEEG. This shows the following: 1) Muscle artifacts in the referential iEEG come from the reference signal in this case, and 2) the reference signal was mostly removed using the approach described in [1]. Four bipolar montage iEEGs (LTD3–LTD4, LTD5–LTD6, RTD3–RTD4, and RTD5–RTD6) are also shown in Fig. 3(A) and are all muscle artifact free. This further verifies that, in this example, the artifacts are from the common reference signal and therefore removed in the bipolar montage. Four representative scalp EEG channel recordings (F7, T7, Cz, and Pz) are shown in Fig. 3(B), where electrodes Cz and Pz are close to the scalp reference electrode so that the recordings from Cz (or Pz) reflecting the difference between two electrical potentials measured at the scalp reference electrode and Cz (or Pz) are rather small at most time points. The second four scalp EEG channel recordings (F7, T7, Cz, and Pz) are corrected scalp EEGs of the first four scalp channel recordings (F7, T7, Cz, and Pz). One can see the brain activity in the corrected Cz and Pz. Moreover, muscle artifacts in the referential F7 and T7 were reduced compared with that in the corrected F7 and T7. The reference signal is the same as that in Fig. 3(A). Considerable muscle artifacts can still be seen in bipolar F7–T7, illustrating that these artifacts are not from the reference signal.
Fig. 3.

(A) Ten-second sample of iEEG recorded from the four-contact left and right depth electrodes using a scalp reference (the uppermost eight channels labeled LTD3–LTD6 and RTD3–RTD6). The segment is remarkable for the large muscle artifacts due to the patient chewing between 75 and 80 s. The corrected EEG (channels 9–16 labeled LTD3–LTD6 and RTD3–RTD6) show that the muscle artifacts have been removed. The reference signal (channel 17) was calculated by using the second method [1]. The bottom four channels are bipolar iEEGs which have no muscle artifacts (channels 18–21 and labeled LTD3–LTD4, LTD5–LTD6, RTD3–RTD4, and RTD5–RTD6). (B) Ten-second sample of scalp EEG simultaneously recorded from scalp electrodes using the same scalp reference (the uppermost four channels F7, T7, Cz, and Pz) where Cz and Pz are close to the scalp reference electrode so that the brain activity cannot be seen at Cz and Pz. The segment is remarkable for the large muscle artifacts due to the patient chewing between 75 and 80 s in F7 and T7. The corrected scalp EEG (channels 5–8 labeled F7, T7, Cz, and Pz) show brain activity at Cz and Pz and some reduction of the muscle artifacts at F7 and T7. The remaining muscle artifact is present because it is not referential in origin. The temporalis muscle underlying the electrodes F7 and T7 is an independent generator of muscle artifact that is not introduced by the reference. The reference signal is the same as in (A) (channel 9 labeled reference). F7–T7 and Cz–Pz are two bipolar EEG channels (the bottom two channels). (C) PSD of the reference signal. (D) PSD of the referential LTD4. (E) PSD of the corrected LTD4. High-frequency activity from 20 to 70 Hz in the corrected LTD4 cannot be seen any more. (F) Spectral power for the (solid line) referential and (dashed line) corrected LTD3 and LTD4, (dashed–dotted line) reference signal, and (dotted line) bipolar LTD3–LTD4. (G) Spectral power for the (solid line) referential and (dashed line) corrected RTD3 and RTD4, (dashed–dotted line) reference signal, and (dotted line) bipolar RTD3–RTD4. (H) Absolute value of correlation for the (solid line) referential and (dashed line) corrected LTD3*LTD5, LTD3*LTD6, LTD4*LTD5, and LTD4*LTD6, and (dotted line) bipolar (LTD3–LTD4)*(LTD5–LTD6).
To show the influence of the reference signal on EEG recordings, Fig. 3(C)–(E) shows the PSD for the reference signal, original referential LTD4, and corrected LTD4. One can clearly see the similar high-frequency activity (20–70 Hz) for the reference signal and referential LTD4 in Fig. 3(C) and (D), which is reduced in the corrected LTD4 in Fig. 3(E). This verifies the following: 1) The high-frequency activity (20–70 Hz) in the referential LTD4 comes from artifacts of the reference signal, and 2) high-frequency artifacts are mostly removed in the corrected LTD4.
In Figs. 3(F)–(H), 4, and 5, four measures, namely, the spectral power, correlation, phase synchrony, and MSC, are analyzed. The solid lines correspond to referential iEEG or scalp EEG, the dashed lines are the corrected iEEG or scalp EEG, the dotted lines correspond to the bipolar iEEG or scalp EEG, and the dashed–dotted lines correspond to the reference signal. In Fig. 5(B), the blue lines correspond to the referential scalp EEG, and the red lines correspond to the corrected scalp EEG. Comparing the spectral power of the referential and corrected iEEGs in Fig. 3(F) and (G), one can see that the iEEG power is reduced in the frequency band 20–70 Hz by the removal of the reference signal. It should be appreciated that physiological brain activity in the alpha band can be seen near 9 Hz for all the referential iEEG, corrected iEEG, bipolar iEEG, and reference signal. Moreover, each referential iEEG has larger power than the corresponding corrected iEEG.
Fig. 4.

(A) Absolute value of correlation for the (solid line) referential and (dashed line) corrected RTD3*RTD5, RTD3*RTD6, RTD4*RTD5, and RTD4*RTD6, and (dotted line) bipolar iEEG (RTD3–RTD4)*(RTD5–RTD6). (B) Absolute value of correlation for the (solid line) referential and (dashed line) corrected LTD3*RTD3 and LTD4*RTD4, and (dotted line) bipolar (LTD3–LTD4)*(RTD3–RTD4). (C) Mean phase coherence for the (solid line) referential and (dashed line) corrected LTD3*LTD5, LTD3*LTD6, LTD4*LTD5, and LTD4*LTD6, and (dotted line) bipolar (LTD3–LTD4)*(LTD5–LTD6). (D) Mean phase coherence for the (solid line) referential and (dashed line) corrected RTD3*RTD5, RTD3*RTD6, RTD4*RTD5, and RTD4*RTD6, and (dotted line) bipolar (RTD3–RTD4)*(RTD5–RTD6). (E) Mean phase coherence for the (solid line) referential and (dashed line) corrected LTD3*RTD3 and LTD4*RTD4, and (dotted line) bipolar (LTD3–LTD4)*(RTD3–RTD4). (F) MSC for the (solid line) referential and (dashed line) corrected LTD3*LTD5, LTD3*LTD6, LTD4*LTD5, and LTD4*LTD6, and (dotted line) bipolar (LTD3–LTD4)*(LTD5–LTD6). (G) MSC for the (solid line) referential and (dashed line) corrected RTD3*RTD5, RTD3*RTD6, RTD4*RTD5, RTD4*RTD6, and (dotted line) bipolar (RTD3–RTD4)*(RTD5–RTD6). (H) MSC for the (solid line) referential and (dashed line) corrected LTD3*RTD3, LTD4*RTD4, and (dotted line) bipolar (LTD3–LTD4)*(RTD3–RTD4).
Fig. 5.

(A) Spectral power for (solid line) referential and (dashed line) corrected F7 and T7, (dashed–dotted line) reference signal, and (dotted line) bipolar F7–T7. (B) Absolute value of correlation for the (blue line) referential and (red line) corrected F7*Cz, F7*Pz, T7*F7, T7*Cz, and T7*Pz, and (dotted line) bipolar (F7–T7)*(Cz–Pz). (C) Mean phase coherence for the (solid line) referential and (dashed line) corrected F7*Cz, F7*Pz, T7*F7, T7*Cz, and T7*Pz, and (dotted line) bipolar (F7–T7)*(Cz–Pz). (D) MSC for the (solid line) referential and (dashed line) corrected F7*Cz, F7*Pz, T7*F7, T7*Cz, and T7*Pz, and (dotted line) bipolar (F7–T7)*(Cz–Pz).
Figs. 3(H) and 4(A) and (B) show the absolute values of representitive correlations [LTD3*LTD5, LTD3*LTD6, RTD3*RTD5, RTD3*RTD6, LTD3*RTD3, and LTD4*RTD4, and bipolar (LTD3–LTD4)*(LTD5–LTD6), (RTD3–RTD4)*(RTD5–RTD6), and (LTD3–LTD4)*(RTD3–RTD4)]. One can observe the following.
Each corrected iEEG has a smaller correlation compared with the referential iEEG at most time points [Figs. 3(H) and 4(A) and (B)]. An explanation for this phenomenon is that the reference signal has a larger amplitude at most time instants, as seen in Fig. 3(A). Thus, the reference signal of larger amplitude may play an important role in increasing correlation values of iEEG and may lead to misinterpretation of iEEG.
Some corrected and referential iEEGs such as LTD4*LTD5 have larger correlation values. However, this is not true for some iEEG such as LTD3*LTD6. In this case, the correlation of referential LTD3*LTD6 cannot correctly reflect that of corrected LTD3*LTD6 and leads to misinterpretation of iEEG.
Bipolar iEEG (LTD3–LTD4)*(LTD5–LTD6) has small correlation values which are less than that of almost all referential and corrected iEEGs. Hence, small correlation values of bipolar iEEG cannot reflect larger correlation values of corrected iEEG such as LTD4*LTD5 and lead to misinterpretation of iEEG.
Correlation values between two bipolar iEEGs are not always less than that of all corresponding referential or corrected iEEG seen in Fig. 4(A). For example, the correlation values of (RTD3–RTD4)*(RTD5–RTD6) are larger than that of the referential and corrected RTD3*RTD5 and RTD3*RTD6 at most time points, but remain significantly less than that of the referential and corrected RTD4*RTD5. Thus, correlation of two bipolar iEEG cannot correctly reflect the correlation of two corrected channels in some cases and leads to misinterpretation of iEEG.
All correlation values between two corrected bilateral channels LTD4 and RTD4 are less than 0.2 in Fig. 4(B). This shows that synchronization of brain activity at channel LTD4 and channel RTD4 is weak.
Fig. 4(C)–(E) show phase-synchrony-value changes for LTD3*LTD5, LTD3*LTD6, RTD3*RTD5, RTD3*RTD6, LTD3*RTD3, and LTD4*RTD4, and bipolar (LTD3–LTD4)* (LTD5–LTD6), (RTD3–RTD4)*(RTD5–RTD6), and (LTD3–LTD4)*(RTD3–RTD4). One can observe that the results are similar to the aforementioned correlation analysis.
Fig. 4(F)–(H) show MSC-value changes for LTD3*LTD5, LTD3*LTD6, RTD3*RTD5, RTD3*RTD6, LTD3*RTD3, and LTD4*RTD4, and bipolar (LTD3–LTD4)*(LTD5–LTD6), (RTD3–RTD4)*(RTD5–RTD6), and (LTD3–LTD4)*(RTD3–RTD4). One can observe the following.
MSC values of the corrected iEEG are less than that of corresponding referential iEEG because of the larger power of the reference signal [e.g., see Fig. 3(F)]. Moreover, an increasing trend for each referential iEEG can be clearly seen from 20 to 70 Hz. This phenomenon is not present in the corrected iEEG. The reason for this phenomenon is that the higher power of the reference signal remains unchanged from 20 to 70 Hz and the smaller power of each corrected iEEG is still decreasing. Therefore, it is clear that the reference signal plays a dominant role from 20 to 70 Hz.
Some corrected and referential iEEGs such as LTD4*LTD5 have larger MSC values. However, this is not true for other iEEGs such as LTD3*LTD6 and RTD4*RTD6. In this case, the coherence of the referential LTD3*LTD6 cannot correctly reflect that of the corrected LTD3*LTD6 and leads to misinterpretation.
Bipolar iEEG (LTD3–LTD4)*(LTD5–LTD6) has small MSC values which are less than that of all referential and corrected iEEGs. Hence, small MSC values of the bipolar iEEG cannot reflect larger MSC values of the corrected iEEG such as LTD4 *LTD5 and lead to misinterpretation.
MSC values between two bipolar iEEGs are not always less than that of all the corresponding corrected iEEGs seen in Fig. 4(G). For example, the MSC values of (RTD3–RTD4) *(RTD5–RTD6) are larger than that of corrected RTD3 *RTD5 and RTD3 *RTD6, but heavily less than that of the corrected RTD4 *RTD5. Thus, the coherence of two bipolar iEEGs cannot correctly reflect the coherence of two corrected channels in some cases and leads to misinterpretation.
All MSC values between two corrected bilateral channels LTD3 and RTD3 are very small in Fig. 4(H). This shows that the coherence of brain activity at channels LTD3 and RTD3 is rather weak.
Fig. 5(A) shows the spectral power for T7, F7, bipolar F7–T7, and the reference signal. One can see that all signals have peaks near 9 Hz except for the bipolar F7–T7, which has a small peak near 7 Hz. The corrected F7 has a small peak at 27.5 Hz which cannot be found in the referential F7 and bipolar F7–T7. In addition, unlike iEEG in Fig. 3(F) and (G), where each referential iEEG has larger power than the corresponding corrected iEEG, the corrected T7 and F7 have larger power than the referential T7 and F7 from 0 to 15 Hz and have smaller power than the referential T7 and F7 from 20 to 30 Hz. Hence, one can conclude the following: 1) The referential and bipolar EEGs cannot correctly reflect brain activity and lead to misinterpretation of EEG, and 2) the reference signal does not always increase power of EEG.
To analyze correlation and phase synchrony between different scalp channels, we filtered the referential and corrected EEGs to the frequency band 1–50 Hz. Correlation and phase synchrony are shown in Fig. 5(B) and (C) for scalp EEG: T7*F7, T7*Cz, T7*Pz, F7*Cz, F7*Pz, and bipolar (F7–T7)*(Cz–Pz). One can see that correlation and phase-synchrony values of the referential EEG are smaller than that of the corrected EEG. This is different from iEEG in Figs. 3(H) and 4(C) where the correlation and phase-synchrony values of the referential iEEG are larger than that of the corrected iEEG. The reason for this phenomenon is that the reference signal has smaller amplitudes than the corrected scalp EEG, as seen in Fig. 3(B). It can be seen that the corrected F7*Pz has greater correlation and phase-synchrony values than the referential F7*Pz and bipolar (F7–T7)*(Cz–Pz). Hence, correlation and phase-synchrony values of the referential or bipolar EEG cannot correctly reflect that of the corrected EEG in some cases and lead to the misinterpretation of EEG. We also note that the correlation and phase-synchrony values for all corrected EEGs decrease heavily from 70 to 80 s. The large decrease is due to multiple artifacts in each channel, such as muscle artifact, eye movement, and eye blink, as seen in Fig. 3(B).
MSC is analyzed in Fig. 5(D) for scalp EEG: T7*F7, T7*Cz, T7*Pz, F7*Cz, F7*Pz, and bipolar (F7–T7)*(Cz–Pz). One can see that the MSC values of the referential EEG are smaller (larger) than that of the corrected EEG from 0 to 15 Hz (from 20 to 30 Hz) because of the larger (smaller) power of the corrected EEG compared with that of the reference signal, as seen in Fig. 5(A), where we omit the spectral power of the corrected Cz and Pz which have lower power than the reference signal from 20 to 30 Hz. Hence, the power of the reference signal plays a key role in changing the MSC value of EEG. As such, the higher coherence of the corrected F7*Pz cannot be reflected by the lower coherence of the referential F7*Pz or bipolar (F7–T7)*(Cz–Pz) from 0 to 15 Hz. Similarly, the lower coherence of the corrected T7*Cz cannot be reflected by the higher coherence of the referential F7*Pz from 20 to 30 Hz. Comparing the MSC in Fig. 5(D) and the spectral power in Fig. 5(A), one can see that T7 and F7 have isolated power peaks at 9 Hz and T7*F7 has a consistent coherence peak at 9 Hz. However, no peaks can be found for the bipolar EEG (F7–T7)*(Cz–Pz) in Fig. 5(A) and bipolar EEG F7–T7 in Fig. 5(A) at the same frequency. The corrected F7 has a power peak at 27.5 Hz, and the corrected F7*Cz, F7*Pz, and T7*F7 also have consistent isolated coherence peaks at 27.5 Hz. However, no peaks can be found for the referential F7*Cz, F7*Pz, and T7*F7, the bipolar EEG (F7–T7)*(Cz–Pz) in Fig. 5(D), and the referential F7 and bipolar EEG F7–T7 in Fig. 5(A) at the same frequency. Hence, the referential and bipolar EEGs may hinder the appearance of peaks in the corrected EEG in spectral-power and coherence analyses.
IV. Discussion
In this paper, we examined the correlation, PSD, phase synchrony, and coherence of common referential, corrected, and bipolar EEGs recorded from intracranial and scalp electrodes. We first obtained an analytical expression for how these measures of neuronal synchrony depend on recording reference signal and then, using analytical and simulation approaches, investigated the effect of the reference. We were able to show the following.
The absolute value of correlation and the phase-synchrony value of two referential signals may monotonically decrease to zero and then increase to one as the amplitude of the reference signal increases from 0 to ∞ when two nonreferential signals have negative correlation.
The correlation and phase synchrony of two referential signals may monotonically increase to one (or decrease to some positive value and then start to increase to one) as the amplitude of the reference signal increases from 0 to ∞ when two nonreferential signals have positive correlation.
The MSC of two referential signals may monotonically decrease to zero and then increase to one as the power of the reference signal increases from 0 to ∞ when two nonreferential signals have negative cross-power.
The MSC value of two referential signals may monotonically increase to one as the power of the reference signal increases from 0 to ∞ when two nonreferential signals have positive cross-power. In general, the amplitude of the reference signal affects the correlation and phase synchrony, and the power of the reference signal affects the MSC. The reference signal with smaller amplitude (or power) may decrease or increase correlation and phase-synchrony values (or MSC value). However, the reference signal with higher relative amplitude (or power) will increase correlation and phase-synchrony values (or MSC value).
We demonstrated the following: 1) The amplitude of the reference signal may have a significant impact on correlation and phase-synchrony values, and even a small change in reference amplitude can lead to a significant change on correlation and phase-synchrony values; 2) reference signal power may have a significant impact on MSC value, and even a small change of reference signal power can significantly change MSC. This point shows that the conclusion drawn in [36] is not true in general and is limited to the assumptions required to obtain the upper bound of (12); and 3) even if reference signal power is greater than the power of nonreferential signals, the effect at a given frequency can be small.
Human scalp EEG and iEEG are contaminated with multiple noncerebral artifacts including movement artifacts, muscle artifacts, and eye-movement artifacts. We have demonstrated that the reference signal obtained using the approach described previously [1] is a “good” estimation of the real reference signal based on the following four aspects: 1) The referential iEEG muscle artifacts are removed in the corrected iEEG [Fig. 3(A)]; 2) the corrected Cz and Pz contain clear brain activity and muscle artifacts which cannot be seen in the referential Cz and Pz which are close to the reference electrode [Fig. 3(B)]; 3) muscle artifacts in F7 and T7 are reduced after removal of the reference signal [Fig. 3(B)]; 4) the similar high-frequency activity from 20 to 70 Hz of the spectral power for the reference signal and referential iEEG [Fig. 3(C) and (D)] was removed from the spectral power of the corrected iEEG [Fig. 3(E)].
Simulation results based on referential, corrected, and bipolar EEGs showed that the reference signal may have a significant effect on the correlation, phase synchrony, and MSC. For this particular patient, we found that the reference signal with smaller amplitude compared with scalp EEG may decrease correlation and phase-synchrony values [see, e.g., the referential T7*F7 of smaller values and corrected T7*F7 of larger values in Fig. 5(B) and (C)]. On the contrary, the reference signal with larger amplitude compared with iEEG may increase correlation and phase-synchrony values [see, e.g., the referential LTD4*LTD5 of larger values and corrected LTD4*LTD5 of smaller values in Figs. 3(H) and 4(C)]. The reference signal with larger power compared with iEEG may increase MSC values [see, e.g., the referential LTD4*LTD5 of larger values and corrected LTD4*LTD5 of smaller values in Fig. 4(F)]. Hence, the reference signal may change the observed correlation, phase-synchrony, and MSC values significantly and thus lead to an incorrect interpretation of EEG.
The commonly used bipolar EEG can remove the common reference. However, one should note that bipolar EEG will also remove all signals common to the two channels and not all signals common to the two electrodes are from the reference. Hence, a given bipolar montage will completely miss dipoles with certain locations and tangential orientations. Our simulation results from this patient demonstrated that bipolar EEG usually leads to small correlation, phase-synchrony, and MSC values and, as a result, cannot reflect real large correlation, phase-synchrony, and MSC values between two different channels [see, e.g., Figs. 3(H) and 4(C) and (F)].
Peaks of the spectral power and coherence of EEG have been widely analyzed in the study of different subjects. The presence of peaks indicates an underlying structure to EEG patterns [29]. However, our simulation results show that the referential and bipolar EEGs may hinder the appearance of peaks in corrected EEG in the spectral-power and coherence analyses [see, e.g., F7*Cz, F7*Pz, T7*F7, and bipolar EEG (F7–T7)*(Cz–Pz) at 27.5 Hz in Fig. 5(D)].
The technical difficulties associated with an active reference signal are now well recognized, i.e., the reference signal may contaminate EEG recordings and confound the interpretation of coherence analysis [29], [33], [34] and phase-synchrony analysis [22], [32], [35]. In order to correctly interpret commonly used metrics of neuronal synchrony in EEG, it is clearly necessary to identify the reference signal and its contribution. In [1], we proposed two methods to extract the scalp reference signal from multiple-channel iEEG recordings based on independent component analysis under the assumption that the reference signal from the scalp reference electrode can be treated as independent from all of the sources recorded at each intracranial electrode. This assumption is basically true because the reference scalp electrode is relatively isolated from the intracranial electrodes by the three intervening layers of cerebrospinal fluid, bone, and scalp. This assumption was supported by simulation results from clinical EEG data. In this study, we examined the effect of recording reference on commonly used quantitative methods for measuring neuronal synchrony. Using analytical methods, simulations, and experimental results from a patient with intracranial and scalp electrodes, we investigated the effect of recording reference signal on common measures of neuronal synchrony. We demonstrated the significant impact that the recording reference has on these measures and how this can be overcome [1]. In this paper, we conducted one subject analysis which fully supports our theoretical results. Based on the analytical, simulation, and experimental results from a human recording, we are confident that the interpretation of the reference-signal effect on these three measures is correct. In the future, we will apply corrected EEGs (or iEEGs) obtained in real time to disclose real neural synchronization which may shed new light in real-world applications, such as seizure prediction, seizure source localization, and brain–computer interface.
Acknowledgment
The authors would like to thank C. Nelson, K. Crockett, and S. Goerss for providing technical support.
This work was supported in part by the National Institutes of Health under Grant R01-NS063039, by the Mayo Clinic under the Discovery Translation Grant, and by the Minnesota Partnership for Biotechnology and Medical Genomics. This paper was recommended by Associate Editor E. Santos, Jr.
Biographies
 Sanqing Hu (M'05–SM'06) received the B.S. degree from the Department of Mathematics, Hunan Normal University, Hunan, China, in 1992, the M.S. degree from the Department of Automatic Control, Northeastern University, Shenyang, China, in 1996, the Ph.D. degree from the Department of Automation and Computer-Aided Engineering, The Chinese University of Hong Kong, Kowloon, Hong Kong, in 2001, and the Ph.D. degree from the Department of Electrical and Computer Engineering, University of Illinois, Chicago, in 2006.
From 2006 to 2009, he was a Research Fellow with the Department of Neurology, Mayo Clinic, Rochester, MN. Since 2009, he is now a Research Assistant Professor with the School of Biomedical Engineering, Science and Health Systems, Drexel University, Philadelphia, PA. He will be a Professor in March, 2010, with the College of Computer Science, Hangzhou Dianzi University, Hangzhou, China. He is a coauthor of more than 50 international journal and conference papers. His interests include biomedical signal processing, cognitive and computational neuroscience, neural networks, and dynamical systems.
Dr. Hu is an Associate Editor of the following four journals: IEEE Transactions on Biomedical Circuits and Systems, IEEE Transactions on Systems, Man, and Cybernetics—Part B: Cybernetics, IEEE Transactions on Neural Networks, and Neurocomputing. He was a Guest Editor of Neurocomputing's special issue on Neural Networks in 2007. He was and is the Special Sessions Chair for the 2008 IEEE International Conference on Networking, Sensing and Control, the 6th International Symposium on Neural Networks (ISNN 2009), and the 2010 International Workshop on Advanced Computational Intelligence. He served and is serving as a member of the program committees of 18 international conferences.
 Matt Stead received the M.D. and Ph.D. degrees from the State University of New York Downstate, Brooklyn, in 2001. His Ph.D. degree is in hippocampal neurophysiology which he pursued further during a one-year postdoctoral fellowship with the Centre Nationale de la Recherche Scientifique, Marseille, France, in 1998.
His pediatrics internship and neurology residency were done at Mayo Clinic, Rochester, MN, from 2001 to 2005. He then pursued a one-year research fellowship in epilepsy, during which he also trained in clinical deep brain stimulation neurophysiology. He is currently an Assistant Professor of Neurology with Mayo Clinic.
 Qionghai Dai (SM'05) received the B.S. degree from Shanxi Normal University, Xi'an, China, in 1987 and the M.E. and Ph.D. degrees in computer science and automation from Northeastern University, Shenyang, China, in 1994 and 1996, respectively.
Since 1997, he has been with the faculty of Tsinghua University, Beijing, China, where he is currently a Professor and the Director of the Broadband Networks and Digital Media Laboratory. His research areas include signal processing, video processing, communication, and computational neuroscience.
 Gregory A. Worrell received the Ph.D. degree in physics from Case Western Reserve University, Cleveland, OH, and the M.D. degree from the University of Texas, Galveston.
He completed his neurology and epilepsy training at Mayo Clinic, Rochester, MN, where he is currently an Associate Professor of Neurology. His research is integrated with his clinical practice focused on patients with medically resistant epilepsy. The current focus of his research is the use of large-scale system electrophysiology, brain stimulation, and data mining to identify and track electrophysiological biomarkers of epileptic brain and seizure generation.
Dr. Worrell is a member of the American Neurological Association, the Academy of Neurology, and the American Epilepsy Society.
Contributor Information
Sanqing Hu, Department of Neurology, Division of Epilepsy and Electroencephalography, Mayo Clinic, Rochester, MN 55905 USA. He is now with the School of Biomedical Engineering, Science and Health Systems, Drexel University, Philadelphia, PA 19104 USA (Sanqing.Hu@drexel.edu)..
Matt Stead, Department of Neurology, Division of Epilepsy and Electroencephalography, Mayo Clinic, Rochester, MN 55905 USA (Stead.Squire@mayo.edu)..
Qionghai Dai, Department of Automation, Tsinghua University, Beijing 100084, China (qhdai@tsinghua.edu.cn)..
Gregory A. Worrell, Department of Neurology, Division of Epilepsy and Electroencephalography, Mayo Clinic, Rochester, MN 55905 USA (Worrell.Gregory@mayo.edu).
References
- 1.Hu S, Stead SM, Worrell GA. Automatic identification and removal of scalp reference signal for intracranial EEGs based on independent component analysis. IEEE Trans. Biomed. Eng. 2007 Sep.54(9):1560–1572. doi: 10.1109/TBME.2007.892929. [DOI] [PubMed] [Google Scholar]
- 2.Speckmann EJ, Elger CE. Introduction to the neurophysiological basis of the EEG and DC potentials. In: Niedermeyer E, Lopes Da Silva F, editors. Electroencephalography: Basic Principles, Clinical Applications, and Related Fields. 5th ed. Lippincott Williams & Wilkins; Baltimore, MD: Nov., 2004. [Google Scholar]
- 3.Chaovalitwongse WA, Fan Y, Sachdeo RC. On the time series K-nearest neighbor classification of abnormal brain activity. IEEE Trans. Syst., Man, Cybern. A, Syst., Humans. 2007 Nov.37(6):1005–1016. [Google Scholar]
- 4.Laine TI, Bauer KW, Lanning JW, Russell CA, Wilson GF. Selection of input features across subjects for classifying crewmember workload using artificial neural networks. IEEE Trans. Syst., Man, Cybern. A, Syst., Humans. 2002 Nov.32(6):691–704. [Google Scholar]
- 5.Tsuji T, Fukuda O, Ichinobe H, Kaneko M. A log-linearized Gaussian mixture network and its application to EEG pattern classification. IEEE Trans. Syst., Man, Cybern. C, Appl. Rev. 1999 Feb.29(1):60–72. [Google Scholar]
- 6.Steriade M. Cellular substrates of brain rhythms. In: Niedermeyer E, Lopes Da Silva F, editors. Electroencephalography: Basic Principles, Clinical Applications, and Related Fields. 5th ed. Lippincott Williams & Wilkins; Baltimore, MD: Nov., 2004. [Google Scholar]
- 7.Uhlhaas PJ, Singer W. Neural synchrony in brain disorders: Relevance for cognitive dysfunctions and pathophysiology. Neuron. 2006 Oct.52(1):155–168. doi: 10.1016/j.neuron.2006.09.020. [DOI] [PubMed] [Google Scholar]
- 8.Funato T, Kurabayashi D. Network structure for control of coupled multiple nonlinear oscillators. IEEE Trans. Syst., Man, Cybern. B, Cybern. 2008 Jun.38(3):675–681. doi: 10.1109/TSMCB.2008.918072. [DOI] [PubMed] [Google Scholar]
- 9.Funato T, Kurabayashi D, Nara M, Aonuma H. Switching mechanism of sensor–motor coordination through an oscillator network model. IEEE Trans. Syst., Man, Cybern. B, Cybern. 2008 Jun.38(3):764–769. doi: 10.1109/TSMCB.2008.922060. [DOI] [PubMed] [Google Scholar]
- 10.Basar E, Basar-Eroglu C, Karakas S, Schurmann M. Gamma, alpha, delta and theta oscillations govern cognitive processes. Int. J. Psychophysiol. 2001 Jan.39(2):241–248. doi: 10.1016/s0167-8760(00)00145-8. [DOI] [PubMed] [Google Scholar]
- 11.Engel AK, Konig P, Kreiter AK, Singer W. Interhemispheric synchronization of oscillatory neuronal responses in cat visual cortex. Science. 1991 May;252(5010):1177–1179. doi: 10.1126/science.252.5009.1177. [DOI] [PubMed] [Google Scholar]
- 12.Fuentemilla L, Marco-Pallarés J, Grau C. Modulation of spectral power and of phase resetting of EEG contributes differentially to the generation of auditory event-related potentials. NeuroImage. 2006 Apr.30(3):909–916. doi: 10.1016/j.neuroimage.2005.10.036. [DOI] [PubMed] [Google Scholar]
- 13.Klimesch W. EEG alpha and theta oscillations reflect cognitive and memory performance: A review and analysis. Brain Res. Rev. 1999 Apr.29(2):169–195. doi: 10.1016/s0165-0173(98)00056-3. [DOI] [PubMed] [Google Scholar]
- 14.Knyazev GG, Savostyanov AN, Levin EA. Anxiety and synchrony of alpha oscillations. Int. J. Psychophysiol. 2005 Sep.57(3):175–180. doi: 10.1016/j.ijpsycho.2005.01.004. [DOI] [PubMed] [Google Scholar]
- 15.Knyazev GG, Savostyanov AN, Levin EA. Alpha synchronization and anxiety: Implications for inhibition vs. alertness hypotheses. Int. J. Psychophysiol. 2006 Feb.59(2):151–158. doi: 10.1016/j.ijpsycho.2005.03.025. [DOI] [PubMed] [Google Scholar]
- 16.Miltner WHR, Braun C, Arnold M, Witte M, Taub E. Coherence of gamma-band EEG activity as a basis for associative learning. Nature. 1999 Feb.397(6718):434–436. doi: 10.1038/17126. [DOI] [PubMed] [Google Scholar]
- 17.Rodriguez E, George N, Lachaux JP, Martinerie J, Renault B, Varela FJ. Perception's shadow: Long-distance synchronization of human brain activity. Nature. 1999 Feb.397(6718):430–433. doi: 10.1038/17120. [DOI] [PubMed] [Google Scholar]
- 18.Sritharan A, Line P, Sergejew A, Silberstein R, Egan G, Copolov D. EEG coherence measures during auditory hallucinations in schizophrenia. Psychiatry Res. 2005 Sep.136(2/3):189–200. doi: 10.1016/j.psychres.2005.05.010. [DOI] [PubMed] [Google Scholar]
- 19.Tallon-Baudry C, Bertrand O, Fischer C. Oscillatory synchrony between human extrastriate areas during visual short-term memory maintenance. J. Neurosci. 2001 Oct.21(20):RC 177:1–RC 177:5. doi: 10.1523/JNEUROSCI.21-20-j0008.2001. [DOI] [PMC free article] [PubMed] [Google Scholar]
- 20.Yeragani VK, Cashmere D, Miewald J, Tancer M, Keshavan MS. Decreased coherence in higher frequency ranges (beta and gamma) between central and frontal EEG in patients with schizophrenia: A preliminary report. Psychiatry Res. 2006 Jan.141(1):53–60. doi: 10.1016/j.psychres.2005.07.016. [DOI] [PubMed] [Google Scholar]
- 21.Tucker A, Swift S, Liu X. Variable grouping in multivariate time series via correlation. IEEE Trans. Syst., Man, Cybern. B, Cybern. 2001 Apr.31(2):235–245. doi: 10.1109/3477.915346. [DOI] [PubMed] [Google Scholar]
- 22.Trujillo LT, Peterson MA, Kaszniak AW, Allen JJ. EEG phase synchrony differences across visual perception conditions may depend on recording and analysis methods. Clin. Neurophysiol. 2005 Jan.116(1):172–189. doi: 10.1016/j.clinph.2004.07.025. [DOI] [PubMed] [Google Scholar]
- 23.Palva JM, Palva S, Kaila K. Phase synchrony among neuronal oscillations in the human cortex. J. Neurosci. 2005 Apr.25(15):3962–3972. doi: 10.1523/JNEUROSCI.4250-04.2005. [DOI] [PMC free article] [PubMed] [Google Scholar]
- 24.Pikovsky A, Rosenblum M, Kurths J. Phase synchronization in regular and chaotic systems. Int. J. Bifurcation Chaos. 2000;10(10):2291–2305. [Google Scholar]
- 25.Costa T, Rognoni E, Galati D. EEG phase synchronization during emotional response to positive and negative stimuli. Neurosci. Lett. 2006 Oct.406(3):159–164. doi: 10.1016/j.neulet.2006.06.039. [DOI] [PubMed] [Google Scholar]
- 26.Knyazeva MG, Jalili M, Brioschi A, Bourquin I, Fornari E, Hasler M, Meuli R, Maeder P, Ghika J. Topography of EEG multivariate phase synchronization in early Alzheimer's disease. Neurobiol. Aging. 2008 Sep. doi: 10.1016/j.neurobiolaging.2008.07.019. to be published. [DOI] [PubMed] [Google Scholar]
- 27.Schindler K, Elger CE, Lehnertz K. Changes of EEG synchronization during low-frequency electric stimulation of the seizure onset zone. Epilepsy Res. 2007 Dec.77(2):108–119. doi: 10.1016/j.eplepsyres.2007.09.011. [DOI] [PubMed] [Google Scholar]
- 28.Bob P, Palus M, Susta M, Glaslova K. EEG phase synchronization in patients with paranoid schizophrenia. Neurosci. Lett. 2008 Dec.447(1):73–77. doi: 10.1016/j.neulet.2008.09.055. [DOI] [PubMed] [Google Scholar]
- 29.Duckrow RB, Zaveri HP. Coherence of the electroencephalogram during the first sleep cycle. Clin. Neurophysiol. 2005 May;116(5):1088–1095. doi: 10.1016/j.clinph.2004.12.002. [DOI] [PubMed] [Google Scholar]
- 30.Knyazeva M, Kiper D, Vildavski V, Despland P, Maeder-Ingvar M, Innocenti G. Visual stimulus-dependent changes in interhemispheric EEG coherence in humans. J. Neurophysiol. 1999 Dec.82(6):3095–3107. doi: 10.1152/jn.1999.82.6.3095. [DOI] [PubMed] [Google Scholar]
- 31.Mima T, Oluwatimilehin T, Hiraoka T, Hallet M. Transient interhemispheric neuronal synchrony correlates with object recognition. J. Neurosci. 2001 Jun.21(11):3942–3948. doi: 10.1523/JNEUROSCI.21-11-03942.2001. [DOI] [PMC free article] [PubMed] [Google Scholar]
- 32.Schiff SJ. Dangerous phase. Neuroinformatics. 2006 May;3(4):315–318. doi: 10.1385/NI:03:04:315. [DOI] [PMC free article] [PubMed] [Google Scholar]
- 33.Nunez PL. Electric Fields of the Brain: The Neurophysics of EEG. Oxford Univ. Press; New York: 1981. [Google Scholar]
- 34.Fein G, Raz J, Brown FF, Merrin EL. Common reference coherence data are confounded by power and phase effects. Electro-encephalogr. Clin. Neurophysiol. 1988 Jun.69(6):581–584. doi: 10.1016/0013-4694(88)90171-x. [DOI] [PubMed] [Google Scholar]
- 35.Guevara R, Velazquez JL, Nenadovic V, Wennberg R, Senjanovic G, Dominguez LG. Phase synchronization measurements using electroencephalographic recordings: What can we really say about neuronal synchrony? Neuroinformatics. 2005 Dec.3(4):301–314. doi: 10.1385/NI:3:4:301. [DOI] [PubMed] [Google Scholar]
- 36.Zaveri HP, Duckrow RB, Spencer SS. The effect of a scalp reference signal on coherence measurements of intracranial electroencephalograms. Clin. Neurophysiol. 2000 Jul.111(7):1293–1299. doi: 10.1016/s1388-2457(00)00321-7. [DOI] [PubMed] [Google Scholar]
- 37.Zaveri HP, Duckrow RB, Spencer SS. On the use of bipolar montages for time-series analysis of intracranial electroencephalograms. Clin. Neurophysiol. 2006 Aug.117(9):2102–2108. doi: 10.1016/j.clinph.2006.05.032. [DOI] [PubMed] [Google Scholar]
- 38.Hyvarinen A, Oja E. Independent component analysis: Algorithms and applications. Neural Netw. 2000 Jun.12(4):411–430. doi: 10.1016/s0893-6080(00)00026-5. [DOI] [PubMed] [Google Scholar]
- 39.Makeig S, Bell AJ, Jung TP, Sejnowski TJ. Independent component analysis of electroencephalographic data. Proc. Adv. Neural Inf. Process. Syst. 1996;8:145–151. [Google Scholar]
- 40.Mormann F, Kreuz T, Rieke C, Andrzejak RG, Kraskov A, David P, Elger CE, Lehnertz K. On the predictability of epileptic seizures. Clin. Neurophysiol. 2005 Jan.116(3):569–587. doi: 10.1016/j.clinph.2004.08.025. [DOI] [PubMed] [Google Scholar]
- 41.Tao J, Ray A, Hawes-Ebersole S, Ebersole JS. Intracranial EEG substrates of scalp EEG interictal spikes. Epilepsia. 2005 May;46(5):669–676. doi: 10.1111/j.1528-1167.2005.11404.x. [DOI] [PubMed] [Google Scholar]