

Abstract
Objective
White matter hyperintensities (WMH), visualized on T2-weighted MRI, are thought to reflect small-vessel vascular disease. Much like other markers of brain disease, the association between WMH and cognition is imperfect. The concept of reserve may account for this imperfect relationship. The purpose of this study was to test the reserve hypothesis in the association between WMH severity and cognition. We hypothesized that individuals with higher amounts of reserve would be able to tolerate greater amounts of pathology than those with lower reserve.
Methods
Neurologically healthy older adults (n=717) from a community-based study received structural MRI, neuropsychological assessment, and evaluation of reserve. WMH volume was quantified algorithmically. We derived latent constructs representing four neuropsychological domains, a measure of cognitive reserve, and a measure of brain reserve. Measures of cognitive and brain reserve consisted of psychosocial (e.g., education) and anthropometric (e.g., craniometry) variables, respectively.
Results
Increased WMH volume was associated with poorer cognition and higher cognitive and brain reserve were associated with better cognition. Controlling for speed/executive function or for language function, those with higher estimates of cognitive reserve had significantly greater degrees of WMH volume, particularly among women. Controlling for cognitive functioning across all domains, individuals with higher estimates of brain reserve had significantly greater WMH volume.
Conclusions
For any given level of cognitive function, those with higher reserve had more pathology in the form of WMH, suggesting that they are better able to cope with pathology than those with lower reserve. Both brain reserve and cognitive reserve appear to mitigate the impact of pathology on cognition.
Keywords: White matter hyperintensities, cognitive reserve, MRI, cognition
1. Introduction
White matter hyperintensities (WMH) are areas of focal and diffuse increased lucency visualized radiologically on T2-weighted magnetic resonance imaging (MRI). They are among the most ubiquitous findings in older adults. Until recently, WMH were thought to be idiopathic and lack clinical significance unless they occupied a large proportion of the brain. A number of studies, however, have established that WMH burden (i.e., volume or severity) is negatively associated with performance across a range of cognitive tests, particularly those involving executive functioning, processing speed, and attention (Brickman and Buchsbaum, 2008; Gunning-Dixon et al., 2008; Gunning-Dixon and Raz, 2000; Gunning-Dixon and Raz, 2003; Raz et al., 1998; Raz and Rodrigue, 2006). The relationship between increased WMH burden and poorer cognitive performance has been established in samples of well-screened neurologically healthy older adults as well as in large-scale, community-based epidemiological studies of aging.
Despite these fairly consistent findings, the associations between age and WMH volume and between WMH and cognitive function are imperfect - - the severity of WMH varies widely in older adults as does the amount of cognitive dysfunction associated with degree of WMH. The identification of the sources of individual differences in these relationships is critical in order to develop preventative strategies for decline and to maximize successful cognitive aging.
The concept of reserve has been proposed to help account for the apparent discrepancy between some pathogenic factor (e.g., age) and measurable pathology (e.g., WMH) and between the pathology and its clinical manifestations (e.g., cognition). In our conceptualization, reserve takes two forms: brain reserve and cognitive reserve. Brain reserve or brain reserve capacity (Brickman et al., 2009b; Satz, 1993; Stern, 2002; Stern, 2003; Stern, 2009) postulates that the brain must sustain a certain amount of pathological change before the clinical symptoms associated with the pathology emerge. Those with higher brain reserve can “afford” to sustain more pathological damage than others and it is the individual differences in the brain itself that allow for some people to cope with pathology better than others. The brain reserve hypothesis would argue that factors that contribute to the development of the brain’s structural integrity, such genetic contributions, nutritional quality, and access to health care during early childhood, may be most important in providing reserve or may promote resistance against the development of brain pathology, such as WMH. On the other hand, the idea of cognitive reserve posits that individuals with higher reserve are able to cope with brain pathology, through some form of active compensatory strategy, better than those with lower reserve. In the case of cognitive reserve, reserve does not “protect” the brain against the development of brain pathology, but rather it moderates the association between pathology and the expression of that pathology.
How is reserve operationally defined? From a developmental, life-course perspective, reserve can be thought of as an accumulation of several differing experiences and abilities that may positively impact brain growth, resilience, or compensatory flexibility. For example, higher education, occupational attainment, and engagement in cognitively-stimulating leisure activities may independently or synergistically contribute to or reflect cognitive reserve (Richards and Sacker, 2003; Stern et al., 1994; Stern et al., 1995). Furthermore, anthropometric measurements, such as cranial volume and stature, may capture brain reserve parametrically because they reflect the quality of development in early life (Little et al., 2006; Wadsworth et al., 2002). For the current study, we considered both psychosocial and anthropometric measures, which we believe may reflect reserve due to the culmination of engagement in cognitively stimulating activities and the quality of early life developmental factors, respectively.
The purpose of this study was to use structural equation modeling to determine whether the reserve hypothesis is operative in the associations between WMH volume and cognition among neurologically-healthy older adults from a large community-based study of aging. If the reserve hypothesis were operative, we would expect the reserve variables to moderate the relationship between WMH severity and cognition; by holding cognitive function constant statistically, those with higher estimates of reserve would have more WMH volume, reflecting the idea that those with higher reserve can tolerate a greater amount of pathology than those with lower amounts of reserve. Given consistent observations of associations between WMH and executive/speeded abilities, we hypothesized that the reserve hypotheses would be most applicable to this cognitive domain.
2. Methods
2.1. Participants
Participants came from the Washington Heights/Hamilton Heights Inwood Columbia Aging Project (WHICAP), a prospective, community-based study of aging and dementia in Medicare-eligible northern Manhattan residents. The current cohort (n=2,776) represents a combination of continuing members recruited in 1992 (n=602), and members of a new cohort recruited between 1999 and 2001 (n=2174). Recruitment and sampling strategies for these cohorts have been described in detail elsewhere (Tang et al., 2001). The community from which the WHICAP sample is drawn comprises individuals from three broadly defined ethnic groups, including Hispanic, African American, and non-Hispanic white (Census, 1991). This research was approved by the institutional review boards of Columbia University Medical Center and New York State Psychiatric Institute, New York.
In 2003, we began to acquire high resolution structural magnetic resonance imaging (MRI) on active participants in the ongoing WHICAP cohort who were not demented at their previous follow up visit, as described in greater detail elsewhere (Brickman et al., 2008b). A total of 769 participants successfully received MRI. Fifty-two of these subjects were excluded from the current analyses because they met criteria for dementia at the follow up visit that was contemporaneous with the MRI scan visit. Thirteen subjects did not receive a neuropsychological examination at the time of MRI scan. The remaining 704 comprise the study sample for the current report. Those who received MRI scans were one year younger than those who refused but were otherwise eligible and had similar demographic characteristics (Brickman et al., 2008b).
2.2. Magnetic resonance imaging
Scan acquisition took place on a 1.5T Philips Intera scanner at Columbia University and the data were transferred to the Imaging of Dementia and Aging Laboratory at the University of California at Davis for determination of WMH, total brain volume, and total intracranial volume. Fluid attenuated inverse recovery (FLAIR) T2-weighted images (TR=11,000 ms, TE=144.0 ms, 2800 inversion time, FOV 25 cm, 2 nex, 256×192 matrix with 3 mm slice thickness) were acquired in the axial orientation and used for these measurements. Total brain, cranial, and WMH volumes were derived using manual and semi-automated procedures that have been previously described in detail (Brickman et al., 2008b; DeCarli et al., 1992; DeCarli et al., 1996; DeCarli et al., 1995). Total WMH volumes were log-transformed because their distribution was positively skewed.
2.3. Clinical evaluation
Participants in the WHICAP study are followed up every 18 to 24 months with identical diagnostic and evaluation procedures. These procedures include in-person interview and semistructured standardized assessment, including general health and functional ability, medical history, physical and neurological examination, and neuropsychological test battery (Stern et al., 1992). Participants are evaluated in their stated language of preference, English or Spanish, with the exception of the WRAT reading test, a test of English language reading ability, which was always administered in English. Independent of education, performance on the WRAT among Spanish-speakers reflects the degree of bilingualism achieved and could be viewed as an index of increased mental stimulation due to exposure to a new language.
2.4. Neuropsychological outcomes
The neuropsychological battery was a focused evaluation of several cognitive domains. Memory was assessed with subscores of the Selective Reminding Test (SRT; (Buschke and Fuld, 1974)), including SRT total recall, SRT delayed recall, and SRT delayed recognition
The Benton Visual Retention Test (BVRT; (Benton, 1955)) recognition and matching subtests, the Rosen Drawing test (Rosen, 1981), and the Identities and Oddities subtest of Mattis Dementia Rating Scale (Mattis, 1988) were administered as measures of visual-spatial ability. Executive functioning/speed was assessed the Color Trails test (D’Elia et al., 1994), which requires participants to connect numbers (Color Trails 1) or numbers alternating in color (Color Trails 2) in the appropriate order as quickly as possible. The times taken to complete the tasks were used as the dependent measures. Language was evaluated with a modified version of Boston Naming Test (BNT; (Kaplan et al., 1983)); Letter Fluency Test, on which participants are given three letters (i.e., C, F, L) and asked to generate as many words as possible that begin with each letter in a 60 second time frame; the Category Fluency test, on which participants are required to generate as many items from a specific semantic category (i.e., animals) within a 60 second interval; the Similarities subtest of the Wechsler Adult Intelligence Test-Revised (Wechsler, 1987); and the Repetition and Comprehension subtests of the Boston Diagnostic Aphasia Examination (Goodglass and Kaplan, 1983).
2.5. Defining reserve
We were interested in examining two operational definitions of reserve, cognitive reserve and brain reserve. The first (i.e., cognitive reserve) considered psychosocial factors and included variables that reflect exposure to or correlates of engagement in cognitively stimulating activity throughout the lifespan. It was estimated with years of education and performance on the Wide Range Achievement Test (WRAT; (Wilkenson, 1993)) reading subtest.
The second (i.e., brain reserve) focused on physical variables and incorporated anthropometric estimates of development that might directly reflect the quality of physical development (Abbott et al., 1998; Graves et al., 1996; Little et al., 2006; Schofield et al., 1995). It was assessed with height or stature, in inches, total cranial volume (Brickman et al., 2008b), and cranial length (i.e., the distance between the glabella and the opisthocranion), which we derived with in-house developed software applied to the FLAIR images.
2.6. Modeling procedure
Figure 1 graphically displays the modeling procedures employed in the current study. We used path analysis to test relationships among WMH volume, cognition, and reserve, with the latter two variables defined as latent constructs. The use of latent constructs in the evaluation of the relationships among different variables has several advantages over the use of composite scores or other data reduction techniques. First, latent constructs comprise two or more observed variables, and represent the common variance among the observed variables. Because only systematic variance can be shared, the latent constructs are, in theory, perfectly reliable. Second, because latent variables represent the shared or common variance among a set of observed variables, the identified processes, or constructs, are relatively general and not specific to one particular task. To that end, a majority of the variables in our analyses were modeled with latent constructs. We defined two reserve factors: cognitive reserve, represented by psychosocial variables, and brain reserve, represented by anthropometric variables. The cognitive reserve construct included scores from the WRAT and the number of years of formal education. The brain reserve construct included the height, total cranial volume, and cranial length variables. Each of the cognition variables loaded on to their respective latent cognitive constructs. That is, the memory construct included the three SRT subscores; the visual-spatial construct comprised the BVRT recognition and matching subtests, the Rosen Drawing test, and the Identities and Oddities subtest; the executive/speed construct comprised Color trails A and B variables; and the language construct included scores from the BNT, verbal fluencies, Similarities, Repetition, and Comprehension tests. The loadings of each of the observed variables on to their respective construct were significant at the p < .001 level, thereby providing evidence of convergent validity. In order to provide a scale, or metric, for the latent variables, variance of each construct was set to 1.0. Our decision to use path analysis instead of a multiple regression analysis (i.e., in which WMH would be the dependent variable, and the reserve and cognition variables would be predictors) was to take full advantage of the ability to operationalize the constructs of interest (i.e., cognition and reserve) as the shared variance or latent structure among a number of measured variables.
Figure 1.
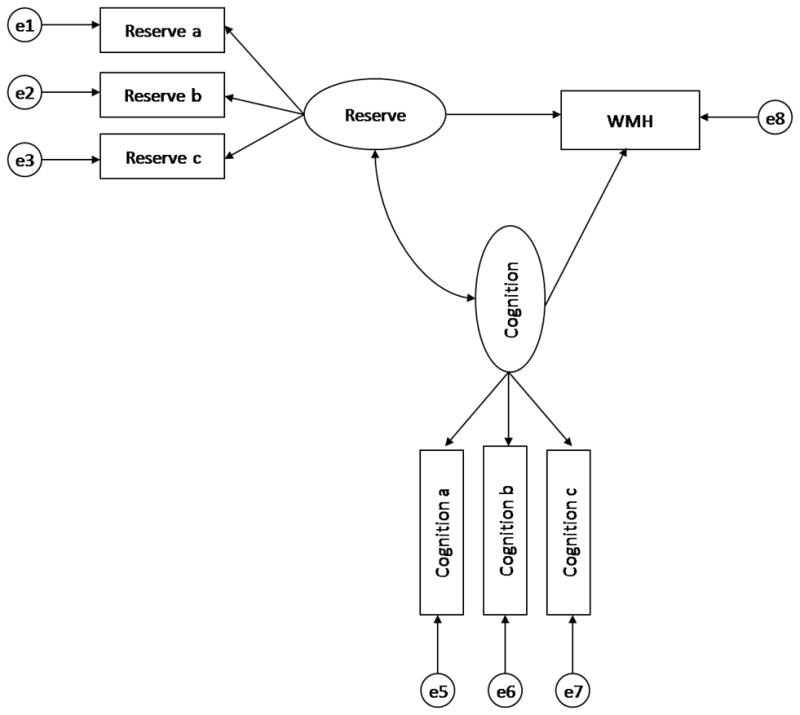
General structural equation model. Latent constructs are represented by ovals. Observed (measured) variables are represented by rectangles. The latent variables labeled “e” represent the unique and error variance associated with each observed variable, which are assumed to be uncorrelated with each other.
Several fit statistics were evaluated in determining the fit of the models (Hu and Bentler, 1998). Chi-square (X2), critical ratio (X2/df), and the root mean square error of approximation (RMSEA) are all indicators of model misfit, and therefore values closer to zero are indicative of better fit. Root mean square error of approximation values ≤ 0.08 are typically considered to be indicative of a good fit, and values between .08 and .10 are generally suggestive of an adequate fit (MacCallum et al., 1996). The comparative fit index (CFI) was also evaluated and the closer the values are to 1.0, the better the fit of the data to the model. Models with CFI values ≥.95 are typically considered to be good-fitting models (Hu and Bentler, 1999). Amos 5.0 (Arbuckle, 2003) was used for all SEM analyses, utilizing maximum likelihood estimation for missing data.
A series of structural models was evaluated for both reserve constructs (i.e., cognitive and brain) across each cognition construct (i.e., visual-spatial, memory, executive/speed, and language), thereby resulting in eight separate models. As can be seen in Figure 1, a latent construct of reserve was used to predict both WMH volume and each latent cognition construct. In addition, each cognition construct was used to predict WMH volume.
3. Results
Analyses were run separately for men and women because anthropometric measures (i.e., height, cranial size) are confounded by sex. That is, the brain reserve construct is bimodally distributed due gross differences between sex in anthropometry.
Table 1 displays demographic, reserve, and neuropsychological descriptive statistics for men and women in the sample. As expected, men had larger anthropometric factors that reflect brain reserve than women, including cranial length, total cranial volume, and height. Men also obtained lower scores on tests of learning and memory, but otherwise performed similarly in other cognitive domains. Table 2 displays the standardized path coefficients of each observed variable on its respective latent construct. Each loading was significant at the p < .001 level suggesting that the constructs exhibited convergent validity.
Table 1.
Demographic characteristics and means and standard deviations for reserve and neuropsychological variables.
| Group |
||||||
|---|---|---|---|---|---|---|
| Male | Female | Total | ||||
| Variable | M | SD | M | SD | M | SD |
| N | 232 | 472 | 704 | |||
| Age** | 79.12 | 5.11 | 80.46 | 5.72 | 80.02 | 5.56 |
| log transformed WMH | 2.24 | 0.91 | 2.26 | 0.87 | 2.26 | 0.88 |
| Cognitive reserve | ||||||
| Education* | 11.29 | 4.83 | 10.49 | 4.76 | 10.75 | 4.795 |
| WRAT | 43.98 | 11.74 | 43.73 | 10.76 | 43.81 | 11.11 |
| Brain reserve | ||||||
| Cranial Length*** | 188.42 | 6.55 | 180.06 | 6.87 | 182.78 | 7.82 |
| Total cranial volume (mm3)*** | 1233.22 | 120.74 | 1084.75 | 91.05 | 1133.96 | 123.48 |
| Height*** | 169.97 | 9.03 | 157.11 | 7.54 | 161.37 | 10.08 |
| Memory | ||||||
| SRT total*** | 34.16 | 10.32 | 37.27 | 10.37 | 36.24 | 10.45 |
| SRT delayed recall** | 4.39 | 2.48 | 5.04 | 2.68 | 4.83 | 2.63 |
| SRT delayed recog | 10.64 | 1.62 | 10.83 | 1.60 | 10.77 | 1.61 |
| Speed | ||||||
| Color Trails A | 102.27 | 57.85 | 99.81 | 57.29 | 100.64 | 57.45 |
| Color Trails B | 177.60 | 70.58 | 180.78 | 76.33 | 179.70 | 74.38 |
| Visual-spatial | ||||||
| BVRT Recognition | 6.65 | 2.57 | 6.37 | 2.64 | 6.46 | 2.62 |
| BVRT Matching | 8.31 | 2.55 | 8.01 | 2.46 | 8.11 | 2.50 |
| Rosen Drawing test | 2.49 | 1.14 | 2.41 | 1.07 | 2.43 | 1.10 |
| Identities and Oddities | 14.29 | 3.11 | 14.42 | 2.84 | 14.38 | 2.93 |
| Language | ||||||
| BNT spontaneous | 13.62 | 1.72 | 13.61 | 1.71 | 13.61 | 1.71 |
| Similarities* | 12.89 | 7.57 | 11.62 | 7.49 | 12.04 | 7.54 |
| Letter fluency | 10.14 | 6.74 | 9.67 | 4.79 | 9.82 | 5.51 |
| Category fluency | 13.70 | 4.09 | 13.94 | 4.18 | 13.86 | 4.15 |
| Repetition | 7.51 | 1.15 | 7.64 | 0.80 | 7.60 | 0.93 |
| Comprehension | 5.28 | 1.09 | 5.14 | 1.14 | 5.18 | 1.12 |
Note. p < .05.
p < .01.
p<.01
Table 2.
Standardized path coefficients of each observed variable on its respective latent construct. Amount of variance in the observed variables accounted for by the latent construct is equal to the path coefficient squared.
| Path coefficients |
||
|---|---|---|
| Females | Males | |
| CR -> Education | 0.79 | 0.93 |
| CR -> WRAT | 0.83 | 0.81 |
| BR -> cranial length | 0.69 | 0.82 |
| BR -> total cranial volume | 0.60 | 0.53 |
| BR -> height | 0.34 | 0.45 |
| Memory -> SRT total | 0.87 | 0.84 |
| Memory -> SRT delayed recall | 0.90 | 0.90 |
| Memory -> SRT delayed recognition | 0.62 | 0.62 |
| Executive/speed -> Color Trails A | 0.82 | 0.89 |
| Executive/speed -> Color Trails B | 0.95 | 0.90 |
| Visual-spatial -> BVRT Recognition | 0.85 | 0.77 |
| Visual-spatial -> BVRT Matching | 0.90 | 0.87 |
| Visual-spatial -> Rosen drawing test | 0.61 | 0.62 |
| Visual-spatial -> Identities/Oddities | 0.61 | 0.64 |
| Language -> BNT spontaneous | 0.58 | 0.73 |
| Language -> Similarities | 0.85 | 0.76 |
| Language -> Letter fluency | 0.76 | 0.58 |
| Language -> Category fluency | 0.74 | 0.64 |
| Language -> Repetition | 0.27 | 0.40 |
| Language -> Comprehension | 0.64 | 0.58 |
Note: All coefficients are significant as the p < .001 level
The direct relationships between the construct reflecting cognitive reserve and WMH and between the construct reflecting brain reserve and WMH were evaluated first, with age included as a covariate. The path coefficient from cognitive reserve to WMH was −0.05 (ns) for women and −0.09 (ns) for men. The path coefficient from brain reserve to WMH was 0.17 (p<0.01) for women and 0.18 (p<0.05) for men. Thus, when considered in isolation, higher cognitive reserve was related to lower WMH volume, although not significantly. On the other hand, higher brain reserve was related to greater WMH volume; as brain reserve measures generally reflect body and head size, this latter finding could simply reflect larger brain size (i.e., those with larger brains are most likely to have more amounts of absolute pathology).
We next examined the relationship the reserve variables and WMH while statistically controlling for cognitive function. This approach allowed us to test whether those with higher estimates of reserve have more associated pathology (i.e., WMH) for any given level of cognitive function. The four different constructs of cognition were considered in separate mediational models. As described above, eight models were evaluated each for women and for men.
Path coefficients for the eight mediation models evaluated for women are presented in Figure 2. Of primary interest in these analyses is the relationship between the reserve constructs and WMH. As reported above the direct relation between cognitive reserve and WMH was −0.04 (ns). By including the executive/speed cognitive variable or the language variable in the model, the path coefficient between cognitive reserve and WMH volume changed from negative to significantly positive (0.24 and 0.46, respectively; see Figure 2). The same pattern existed for memory and visual-spatial functioning, although the relationships remained non-statistically significant. These findings demonstrate that when cognitive function, particularly speed/executive functioning and language, is statistically controlled, women with higher measures of cognitive reserve have more severe WMH pathology. Although the relationship between brain reserve and WMH volume was positive in the uncontrolled models, this relationship was strengthened when performance across the three cognitive domains was controlled (see Figure 2). Formal statistics evaluating model fit indicated that the models provided good fit to the data (see Table 3).
Figure 2.
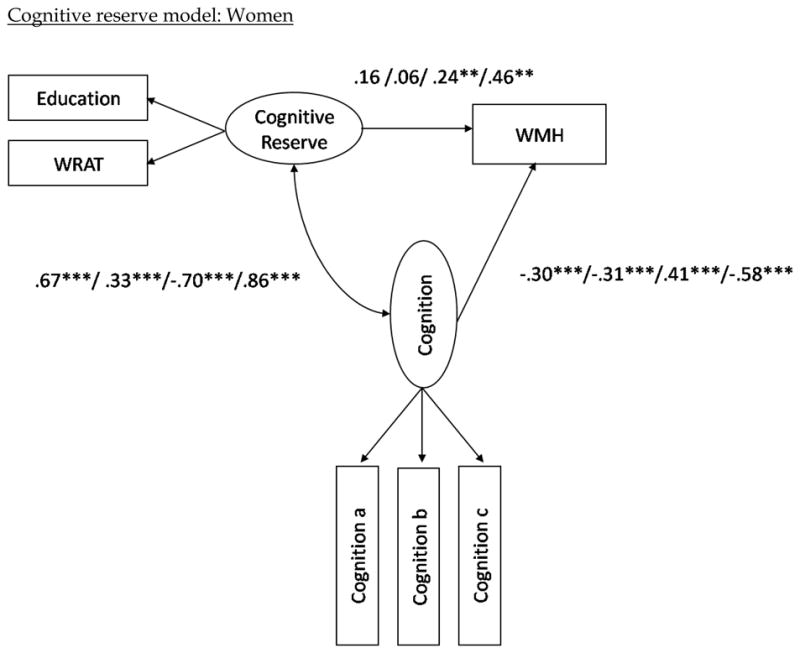
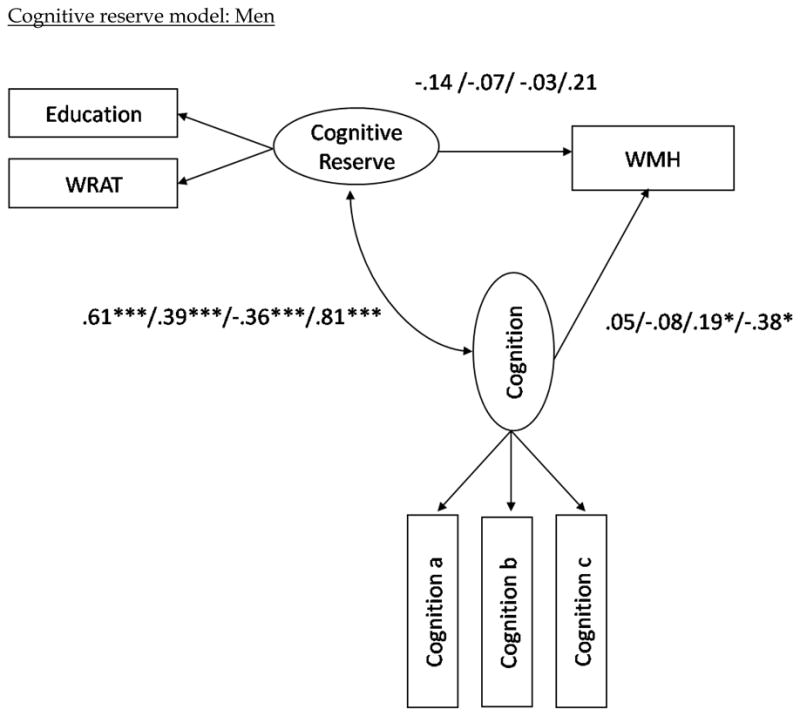

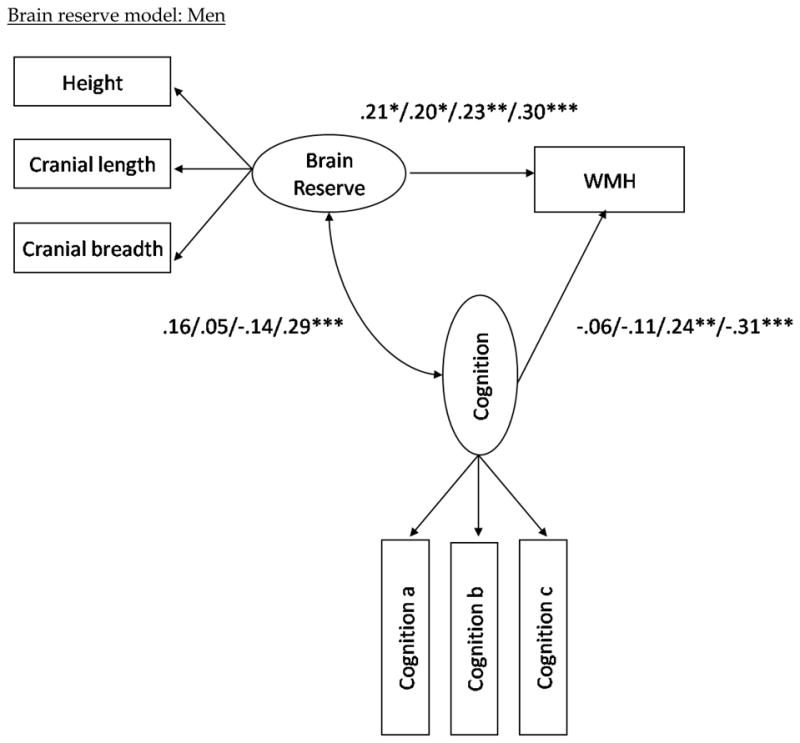
Structural model with path coefficients for cognitive reserve (top two) and brain reserve (bottom two) across the three cognition constructs in the female and male subgroups, respectively.
Note (Figure 2). The first path coefficients correspond to the values when visual-spatial ability is included as the latent cognition construct in the model. The second set of path coefficients correspond to the values when memory is included as the latent cognition construct in the model; the third numbers are when in executive/speed construct is included; the fourth number is when language is included as the latent cognition construct; i.e. visual-spatial ability/memory/executive-speed/language. The variables “Cognition a, b, and c” refer to the measured variables that comprise each of the cognitive domains (e.g., Color Trails 1 and 2 for speed/executive.) Note that higher scores in the executive/speed domain correspond to poorer performance, whereas higher scores in all other domains correspond to better performance. Also note that although error terms were estimated in the models, they are excluded from the path diagrams in order to simplify the figures. *p < .05. **p<.01. ***p< .001
Table 3.
Fit Statistics for Each Mediation Model for the Female Subgroup
| Model fit | |||||
|---|---|---|---|---|---|
| X2 | df | X2/df | RMSEA | CFI | |
| Cognitive reserve construct | |||||
| Visual-spatial model | 20.13 | 12 | 1.68 | 0.038 | 0.99 |
| Memory model | 13.11 | 7 | 1.87 | 0.043 | 0.99 |
| Speed/executive model | 1.32 | 3 | 0.44 | 0.000 | 1.00 |
| Language model | 81.65 | 25 | 3.27 | 0.069 | 0.96 |
| Brain reserve construct | |||||
| Visual-spatial model | 41.44 | 18 | 2.30 | 0.053 | 0.98 |
| Memory model | 49.35 | 12 | 4.11 | 0.081 | 0.96 |
| Speed/executive model | 15.41 | 7 | 2.20 | 0.051 | 0.98 |
| Language model | 82.54 | 33 | 2.50 | 0.056 | 0.96 |
Note. RMSEA = root mean square error of approximation. Three measures of model mis-fit are provided, including Chi-square (X2), critical ratio (X2/df), and the RMSEA. Values closer to zero are indicative of better fit. Root mean square error of approximation values ≤ 0.08 are typically considered to be indicative of a good fit, and values between .08 and .10 are generally suggestive of an adequate fit. The comparative fit index (CFI) was also evaluated and the closer the values are to 1.0, the better the fit of the data to the model. Models with CFI values ≥.95 are typically considered to be good-fitting models. Note that χ2 may be inflated due to non-normality of the data.
Other findings emerged from the path analysis among women. First, measures of cognitive and brain reserve were associated with better cognitive test performance. Second, as expected, increased WMH volume was associated with poorer cognitive functioning.
Path coefficients for the eight mediation models evaluated in men are presented in Figure 2. When examined in isolation, the relationship between cognitive reserve and WMH was −0.09 (ns), as noted above. Unlike in women, when the cognitive factors were included in the model, the relationship between cognitive reserve and WMH remained negative and non-significant, except of the language factor, which increased the path coefficient to 0.21 (ns). But similar to women, the relationship between brain reserve and WMH volume became more positive with all cognitive constructs included in the model. The fit statistics for the eight models among men indicate that the models with the cognitive reserve construct fit the data as well as those with the brain reserve construct (see Table 4).
Table 4.
Fit Statistics for Each Mediation Model for the Male Subgroup
| Model fit | |||||
|---|---|---|---|---|---|
| X2 | df | X2/df | RMSEA | CFI | |
| Cognitive reserve construct | |||||
| Visual-spatial model | 26.93 | 12 | 2.24 | 0.073 | 0.97 |
| Memory model | 20.17 | 7 | 2.88 | 0.090 | 0.97 |
| a Speed/executive model | 3.43 | 4 | 0.86 | 0.000 | 1.00 |
| Language model | 62.20 | 25 | 2.49 | 0.080 | 0.94 |
| Brain reserve construct | |||||
| Visual-spatial model | 37.56 | 18 | 2.09 | 0.069 | 0.95 |
| Memory model | 30.39 | 12 | 2.53 | 0.081 | 0.95 |
| Speed/executive model | 18.11 | 7 | 2.59 | 0.083 | 0.96 |
| Language model | 45.72 | 33 | 1.39 | 0.041 | 0.97 |
Note. error variance on education set to .02 in the model. RMSEA = root mean square error of approximation. Three measures of model mis-fit are provided, including Chi-square (X2), critical ratio (X2/df), and the RMSEA. Values closer to zero are indicative of better fit. Root mean square error of approximation values ≤ 0.08 are typically considered to be indicative of a good fit, and values between .08 and .10 are generally suggestive of an adequate fit. The comparative fit index (CFI) was also evaluated and the closer the values are to 1.0, the better the fit of the data to the model. Models with CFI values ≥.95 are typically considered to be good-fitting models. Note that χ2 may be inflated due to non-normality of the data.
Associations of both cognitive and brain reserve with cognition among men were of similar magnitude as women (see Figure 2). However, unlike in women, increased WMH volume was associated only with poorer performance on tasks of speed/executive function and language among men.
4. Discussion
Imperfect associations among age, WMH severity, and cognitive functioning suggest that there are modifiers and mediators of these relationships. In the current study, we operationally defined two aspects of reserve - - cognitive and brain- - and examined whether they operated in a manner consistent with the reserve hypothesis.
As expected, increased severity of WMH was associated with poorer performance across cognitive domains, particularly on executive/speed tasks. To test the reserve hypothesis, we used path analysis to examine the association between the reserve constructs and WMH severity while controlling for level of cognitive performance. This approach yielded a significant positive relationship between the variables representing reserve and WMH severity. That is, for any given level of cognitive function, those with higher reserve had more severe brain pathology in the form of WMH than those with lower reserve. When examining cognitive reserve, this association was most consistent among women and in the executive/speed and language domains. For brain reserve, this relationship was observed in all cognitive domains among both men and women. The findings suggest that those with greater amounts of reserve are able to tolerate more pathology than those with lesser amounts, and that both cognitive and brain reserve mitigate the impact of WMH on cognitive function.
From a lifespan perspective, reserve can be thought of as an accumulation of experiences and exposures that may moderate the relationship between brain damage and its clinical expression. In the current study we estimated early life exposures and experiences by focusing on psychosocial variables that reflect the amount and quality of education or intellectual functioning and on physical markers of optimum early growth and development. Our findings are in line with other studies of reserve that have shown that early life experiences and the degree of participation in cognitively stimulating activities in adult life moderate the association between pathology and clinical expression across a number of clinical disorders (Elkins et al., 2006; Farmer et al., 2002; Stern, 2006; Sumowski et al., 2009). Few previous studies to our knowledge have tested the reserve hypothesis in the context of WMH and normal aging. One study that showed that presence of severe WMH was associated with poorer cognitive function among those with low education, but not among those with higher education (Dufouil et al., 2003). Deary and colleagues (Deary et al., 2003) showed that independent of mental function in early life, WMH severity predicted cognitive function among 83 healthy, non-demented older adults. However, they did not explicitly examine the association of early life mental function with WMH severity while controlling for cognitive function in late life.
In the current study, we operationally defined brain reserve as a composite measure of various anthropometric characteristics that reflect growth and development early in life. One possibility would be that increased brain reserve might provide some resilience against the development of brain pathology (Stern, 2009), which might manifest as a negative association between brain reserve and WMH volume when cognitive function is unconstrained. In the current study, we found that estimates of brain reserve were positively associated with WMH volume in the unconstrained model. This finding is most likely simply a reflection of larger head and brain volume among those with higher brain reserve but does not necessarily obviate the possibility that the brain reserve hypothesis is not operative. That is, even if individuals with larger brains have proportionately more WMH, they likely still possess more brain reserve than those with smaller brains. It is noteworthy that brain reserve was directly related to cognitive functioning; that is, those with lower estimates of physical growth and development performed worse on cognitive tests than those with higher estimates, suggesting that that these measurements do indeed relate to cognitive functioning in later life but perhaps through a different pathway than their effect on development of white matter pathology. Future work should investigate the mechanism through which factors reflecting early life growth and development impact later life cognition. Further, while cranial anthropometry is an estimate of maximal brain growth (Gale et al., 2006; Schofield et al., 1995) and height provides an index of early life body growth (Abbott et al., 1998), more precise anthropometric measurements and detailed historical information may be necessary to better capture the quality of early life physical development and its impact on later life brain pathology.
The observation that higher estimates of cognitive reserve were significantly associated with greater WMH volume when controlling for cognitive function was most apparent among women. Furthermore, while all measured cognitive domains were associated with WMH volume in women, only the executive/speed and language constructs were associated with WMH volume in men. With the exception of memory, men and women had similar performance on most cognitive tasks and did not differ in the degree of WMH pathology (Table 1). Lower memory performance in men raises the possibility that some men had early changes due to Alzheimer’s disease, which may interfere with the ability to compensate for WMH pathology, although no participants in the current study met diagnostic criteria for dementia. Further, men generally perform worse than women on tests of verbal memory, including the SRT (Bishop et al., 1990; Larrabee et al., 1988). The finding that WMH volume was associated with all aspects of cognition in women but not men is consistent with the idea of more diffuse cognitive representation in women (Hiscock et al., 1995; Witelson, 1976), which might be more globally impacted by distributed pathological change. That cognitive reserve in the current study appeared to be more operative among women than men could reflect that, among this age cohort, educational opportunities that contribute to reserve may have been more difficult to pursue for women than for men. Thus, engagement in educational activities could provide or reflect greater amounts reserve among women than among men. This possibility is perhaps reflected in the finding that the strengths of the associations between reserve and cognition were generally greater for women than for men, particularly for tasks of executive functioning/speed. Further work needs to be conducted to elucidate more fully the sources of gender differences.
White matter hyperintensities are increasingly recognized as important contributors to cognitive function in late life. Our study is consistent with earlier reports from community-based and referral-based samples in showing a strong association between the severity of WMH and poorer cognitive function across a number of domains, but particularly on speeded/executive tasks (Gunning-Dixon et al., 2008; Gunning-Dixon and Raz, 2000). By examining the path coefficients between WMH severity and cognition, we see that up to about 15% of the variance in the latter is accounted for by the former. These figures are very similar to earlier studies of community dwelling individuals of similar age and highlight the considerable contribution WMH make to cognitive function in the elderly.
The exact pathology underlying WMH is not entirely clear. A few neuropathological studies examining postmortem correlates suggest that tissue classified as WMH on antemortem or postmortem MRI is marred by small vessel ischemic changes, rarefaction of myelin, and disruption of subependymal lining (Fazekas et al., 1993; Pantoni and Garcia, 1997; Thomas et al., 2002). In addition to age, which is the most prominent predictor of WMH severity, risk factors for their presence and severity include hypertension, hypercholesteronemia, elevated and fluctuating blood pressure, increased internal carotid artery thickness, and cardiac disease (Brickman et al., in press; Brickman et al., 2008b; de Leeuw et al., 2001; DeCarli et al., 1999; Liao et al., 1997; Liao et al., 1996; Manolio et al., 1994) further suggesting a vascular origin. Recent work also implicates a role of WMH in the development and progression of Alzheimer’s disease (AD). That is, patients with prevalent AD and a form of mild cognitive impairment most consistent with early AD have more severe WMH than neurologically-healthy controls (Brickman et al., 2009a; Luchsinger et al., 2009). Increased WMH volume is also a risk factor for the later development of AD (Prins et al., 2004; Vermeer et al., 2003) and for more rapid cognitive progression of the disease (Brickman et al., 2008a). The exact nature of the relationship between WMH and AD is unclear, but it could reflect a synergistic interaction between two pathologies (i.e., vascular and Alzheimer’s-related), increased deposition of β-amyloid in the vascular architecture of the brain (i.e., cerebral amyloid angiopathy) among patients with AD (Greenberg et al., 2008; Gurol et al., 2006), or the contribution of two independent processes to a dementia syndrome. Thus, given their potential role in normal and pathological cognitive aging, future work should continue to focus on identifying etiological factors, modifiable risk factors, and modifiers of WMH.
This study has a number of strengths that should be noted. First, the large, community-based nature of the sample provides increased precision, but the findings would need to be confirmed in an independent before generalizing fully to the population. Second, the WHICAP cohort is diverse across a number of dimensions, including health status, socioeconomic status, ethnicity, educational and occupational background, and degree of brain pathology, allowing for the study of the full range of these factors. Third, we employed highly standardized neuropsychological evaluation and quantitative analysis of white matter pathology. Despite these strengths, the study could have been strengthened by the availability of more comprehensive measures of early life developmental factors and longitudinal neuroimaging.
In conclusion, results from the current study highlight the impact of WMH volume on cognitive function among non-demented older adults. Our findings support the reserve hypothesis and demonstrate that older adults with greater reserve are able to compensate for greater amounts of WMH than those with less reserve. From a lifespan perspective, our findings suggest that the degree of WMH pathology is not a result of developmental issues early in life, but rather developmental experiences and exposures may provide compensatory mechanisms to protect against the expression of pathology once it emerges in later life.
Acknowledgments
This work was supported by federal grants AG007232 and AG029949, and by grant 05-14586 from the Alzheimer’s Association.
Footnotes
The authors have no actual or potential conflicts of interest to disclose. This research was reviewed and approved by local ethics committees and all participants gave written informed consent.
Publisher's Disclaimer: This is a PDF file of an unedited manuscript that has been accepted for publication. As a service to our customers we are providing this early version of the manuscript. The manuscript will undergo copyediting, typesetting, and review of the resulting proof before it is published in its final citable form. Please note that during the production process errors may be discovered which could affect the content, and all legal disclaimers that apply to the journal pertain.
References
- Abbott RD, White LR, Ross GW, Petrovitch H, Masaki KH, Snowdon DA, Curb JD. Height as a marker of childhood development and late-life cognitive function: the Honolulu-Asia Aging Study. Pediatrics. 1998;102:602–9. doi: 10.1542/peds.102.3.602. [DOI] [PubMed] [Google Scholar]
- Arbuckle JL. Amos 5.0. SPSS; Chicago, IL: 2003. [Google Scholar]
- Benton AL. The Visual Retention Test. The Psychological Corporation; New York: 1955. [Google Scholar]
- Bishop EG, Dickson AL, Allen MT. Psychometric intelligence and performance on Selective Reminding. The Clinical Neuropsychologist. 1990;4:141–150. [Google Scholar]
- Brickman AM, Buchsbaum MS. Alzheimer’s disease and normal aging: Neurostructures. In: Byrne JH, editor. Learning and Memory: A Comprehensive Reference. Elsevier; New York: 2008. pp. 601–621. [Google Scholar]
- Brickman AM, Honig LS, Scarmeas N, Tatarina O, Sanders L, Albert MS, Brandt J, Blacker D, Stern Y. Measuring cerebral atrophy and white matter hyperintensity burden to predict the rate of cognitive decline in Alzheimer disease. Arch Neurol. 2008a;65:1202–8. doi: 10.1001/archneur.65.9.1202. [DOI] [PMC free article] [PubMed] [Google Scholar]
- Brickman AM, Muraskin J, Zimmerman ME. Structural neuroimaging in Altheimer’s disease: do white matter hyperintensities matter? Dialogues Clin Neurosci. 2009a;11:181–90. doi: 10.31887/DCNS.2009.11.2/ambrickman. [DOI] [PMC free article] [PubMed] [Google Scholar]
- Brickman AM, Reitz C, Luchsinger JA, Manly JJ, Schupf N, Muraskin J, DeCarli C, Brown TR, Mayeux R. Longterm blood pressure fluctuation and subclinical cerebrovascular disease. Archives of Neurology. doi: 10.1001/archneurol.2010.70. in press. [DOI] [PMC free article] [PubMed] [Google Scholar]
- Brickman AM, Schupf N, Manly JJ, Luchsinger JA, Andrews H, Tang MX, Reitz C, Small SA, Mayeux R, DeCarli C, Brown TR. Brain morphology in older African Americans, Caribbean Hispanics, and whites from northern Manhattan. Arch Neurol. 2008b;65:1053–61. doi: 10.1001/archneur.65.8.1053. [DOI] [PMC free article] [PubMed] [Google Scholar]
- Brickman AM, Siedlecki KL, Stern Y. Cognitive and brain reserve. In: Depp CA, Jeste DV, editors. Successful cognitive and emotional aging. American Psychiatric Publishing, Inc; Washington, DC: 2009b. pp. 157–172. [Google Scholar]
- Buschke H, Fuld PA. Evaluating storage, retention, and retrieval in disordered memory and learning. Neurology. 1974;24:1019–25. doi: 10.1212/wnl.24.11.1019. [DOI] [PubMed] [Google Scholar]
- Census UBot. Census of Population and Housing Summary Tape File 1: Technical Documentation. Bureaus of the Census; Washington, DC: 1991. [Google Scholar]
- D’Elia LF, Satz P, Uchiyama CL, White T. Color Trails Test professional manual. Psychological Assessment Resources; Odessa, FL: 1994. [Google Scholar]
- de Leeuw FE, de Groot JC, Achten E, Oudkerk M, Ramos LM, Heijboer R, Hofman A, Jolles J, van Gijn J, Breteler MM. Prevalence of cerebral white matter lesions in elderly people: a population based magnetic resonance imaging study. The Rotterdam Scan Study. J Neurol Neurosurg Psychiatry. 2001;70:9–14. doi: 10.1136/jnnp.70.1.9. [DOI] [PMC free article] [PubMed] [Google Scholar]
- Deary IJ, Leaper SA, Murray AD, Staff RT, Whalley LJ. Cerebral white matter abnormalities and lifetime cognitive change: a 67-year follow-up of the Scottish Mental Survey of 1932. Psychol Aging. 2003;18:140–8. doi: 10.1037/0882-7974.18.1.140. [DOI] [PubMed] [Google Scholar]
- DeCarli C, Maisog J, Murphy DG, Teichberg D, Rapoport SI, Horwitz B. Method for quantification of brain, ventricular, and subarachnoid CSF volumes from MR images. J Comput Assist Tomogr. 1992;16:274–84. doi: 10.1097/00004728-199203000-00018. [DOI] [PubMed] [Google Scholar]
- DeCarli C, Murphy DG, Teichberg D, Campbell G, Sobering GS. Local histogram correction of MRI spatially dependent image pixel intensity nonuniformity. J Magn Reson Imaging. 1996;6:519–28. doi: 10.1002/jmri.1880060316. [DOI] [PubMed] [Google Scholar]
- DeCarli C, Murphy DG, Tranh M, Grady CL, Haxby JV, Gillette JA, Salerno JA, Gonzales-Aviles A, Horwitz B, Rapoport SI, et al. The effect of white matter hyperintensity volume on brain structure, cognitive performance, and cerebral metabolism of glucose in 51 healthy adults. Neurology. 1995;45:2077–84. doi: 10.1212/wnl.45.11.2077. [DOI] [PubMed] [Google Scholar]
- DeCarli C, Reed T, Miller BL, Wolf PA, Swan GE, Carmelli D. Impact of apolipoprotein E epsilon4 and vascular disease on brain morphology in men from the NHLBI twin study. Stroke. 1999;30:1548–53. doi: 10.1161/01.str.30.8.1548. [DOI] [PubMed] [Google Scholar]
- Dufouil C, Alperovitch A, Tzourio C. Influence of education on the relationship between white matter lesions and cognition. Neurology. 2003;60:831–6. doi: 10.1212/01.wnl.0000049456.33231.96. [DOI] [PubMed] [Google Scholar]
- Elkins JS, Longstreth WT, Jr, Manolio TA, Newman AB, Bhadelia RA, Johnston SC. Education and the cognitive decline associated with MRI-defined brain infarct. Neurology. 2006;67:435–40. doi: 10.1212/01.wnl.0000228246.89109.98. [DOI] [PubMed] [Google Scholar]
- Farmer JE, Kanne SM, Haut JS, Williams J, Johnstone B, Kirk K. Memory functioning following traumatic brain injury in children with premorbid learning problems. Dev Neuropsychol. 2002;22:455–69. doi: 10.1207/S15326942DN2202_2. [DOI] [PubMed] [Google Scholar]
- Fazekas F, Kleinert R, Offenbacher H, Schmidt R, Kleinert G, Payer F, Radner H, Lechner H. Pathologic correlates of incidental MRI white matter signal hyperintensities. Neurology. 1993;43:1683–9. doi: 10.1212/wnl.43.9.1683. [DOI] [PubMed] [Google Scholar]
- Gale CR, O’Callaghan FJ, Bredow M, Martyn CN. The influence of head growth in fetal life, infancy, and childhood on intelligence at the ages of 4 and 8 years. Pediatrics. 2006;118:1486–92. doi: 10.1542/peds.2005-2629. [DOI] [PubMed] [Google Scholar]
- Goodglass H, Kaplan E. The Assessment of Aphasia and Related Disorders. Lea & Febiger; Philadelphia, PA: 1983. [Google Scholar]
- Graves AB, Mortimer JA, Larson EB, Wenzlow A, Bowen JD, McCormick WC. Head circumference as a measure of cognitive reserve. Association with severity of impairment in Alzheimer’s disease. Br J Psychiatry. 1996;169:86–92. doi: 10.1192/bjp.169.1.86. [DOI] [PubMed] [Google Scholar]
- Greenberg SM, Grabowski T, Gurol ME, Skehan ME, Nandigam RN, Becker JA, Garcia-Alloza M, Prada C, Frosch MP, Rosand J, Viswanathan A, Smith EE, Johnson KA. Detection of isolated cerebrovascular beta-amyloid with Pittsburgh compound B. Ann Neurol. 2008;64:587–91. doi: 10.1002/ana.21528. [DOI] [PMC free article] [PubMed] [Google Scholar]
- Gunning-Dixon FM, Brickman AM, Cheng JC, Alexopoulos GS. Aging of cerebral white matter: a review of MRI findings. Int J Geriatr Psychiatry. 2008 doi: 10.1002/gps.2087. [DOI] [PMC free article] [PubMed] [Google Scholar]
- Gunning-Dixon FM, Raz N. The cognitive correlates of white matter abnormalities in normal aging: a quantitative review. Neuropsychology. 2000;14:224–32. doi: 10.1037//0894-4105.14.2.224. [DOI] [PubMed] [Google Scholar]
- Gunning-Dixon FM, Raz N. Neuroanatomical correlates of selected executive functions in middle-aged and older adults: a prospective MRI study. Neuropsychologia. 2003;41:1929–41. doi: 10.1016/s0028-3932(03)00129-5. [DOI] [PubMed] [Google Scholar]
- Gurol ME, Irizarry MC, Smith EE, Raju S, Diaz-Arrastia R, Bottiglieri T, Rosand J, Growdon JH, Greenberg SM. Plasma beta-amyloid and white matter lesions in AD, MCI, and cerebral amyloid angiopathy. Neurology. 2006;66:23–9. doi: 10.1212/01.wnl.0000191403.95453.6a. [DOI] [PubMed] [Google Scholar]
- Hiscock M, Israelian M, Inch R, Jacek C, Hiscock-Kalil C. Is there a sex difference in human laterality? II. An exhaustive survey of visual laterality studies from six neuropsychology journals. J Clin Exp Neuropsychol. 1995;17:590–610. doi: 10.1080/01688639508405148. [DOI] [PubMed] [Google Scholar]
- Hu L-T, Bentler PM. Fit indices in covariance structure modeling: Sensitivity to underparameterized model misspecification. Psychological Methods. 1998;3:424–453. [Google Scholar]
- Hu L-T, Bentler PM. Cutoff criteria for fit indexes in covariance structure analysis: Conventional criteria versus new alternatives. Structural Equation Modeling: A Multidisciplinary Journal. 1999;6:1–55. [Google Scholar]
- Kaplan E, Goodglass H, Weintraub S. Boston Naming Test. Lea & Febiger; Philadelphia, PA: 1983. [Google Scholar]
- Larrabee GL, Trahan DE, Curtiss G, Levin HS. Normative dataa for the Verbal Selective Reminding Test. Neuropsychology. 1988;2:173–182. [Google Scholar]
- Liao D, Cooper L, Cai J, Toole J, Bryan N, Burke G, Shahar E, Nieto J, Mosley T, Heiss G. The prevalence and severity of white matter lesions, their relationship with age, ethnicity, gender, and cardiovascular disease risk factors: the ARIC Study. Neuroepidemiology. 1997;16:149–62. doi: 10.1159/000368814. [DOI] [PubMed] [Google Scholar]
- Liao D, Cooper L, Cai J, Toole JF, Bryan NR, Hutchinson RG, Tyroler HA. Presence and severity of cerebral white matter lesions and hypertension, its treatment, and its control. The ARIC Study. Atherosclerosis Risk in Communities Study. Stroke. 1996;27:2262–70. doi: 10.1161/01.str.27.12.2262. [DOI] [PubMed] [Google Scholar]
- Little BB, Buschang PH, Pena Reyes ME, Tan SK, Malina RM. Craniofacial dimensions in children in rural Oaxaca, southern Mexico: secular change, 1968–2000. Am J Phys Anthropol. 2006;131:127–36. doi: 10.1002/ajpa.20406. [DOI] [PubMed] [Google Scholar]
- Luchsinger JA, Brickman AM, Reitz C, Cho SJ, Schupf N, Manly JJ, Tang MX, Small SA, Mayeux R, DeCarli C, Brown TR. Subclinical cerebrovascular disease in mild cognitive impairment. Neurology. 2009;73:450–6. doi: 10.1212/WNL.0b013e3181b1636a. [DOI] [PMC free article] [PubMed] [Google Scholar]
- MacCallum RC, Browne MW, Sugawara HM. Power analysis and determination of sample size of covariance structure modeling. Psychological Methods. 1996;1:130–149. [Google Scholar]
- Manolio TA, Kronmal RA, Burke GL, Poirier V, O’Leary DH, Gardin JM, Fried LP, Steinberg EP, Bryan RN. Magnetic resonance abnormalities and cardiovascular disease in older adults. The Cardiovascular Health Study. Stroke. 1994;25:318–27. doi: 10.1161/01.str.25.2.318. [DOI] [PubMed] [Google Scholar]
- Mattis S. Dementia Rating Scale (DRS) Psychological Assessment Resources; Odessa, FL: 1988. [Google Scholar]
- Pantoni L, Garcia JH. Pathogenesis of leukoaraiosis: a review. Stroke. 1997;28:652–9. doi: 10.1161/01.str.28.3.652. [DOI] [PubMed] [Google Scholar]
- Prins ND, van Dijk EJ, den Heijer T, Vermeer SE, Koudstaal PJ, Oudkerk M, Hofman A, Breteler MM. Cerebral white matter lesions and the risk of dementia. Arch Neurol. 2004;61:1531–4. doi: 10.1001/archneur.61.10.1531. [DOI] [PubMed] [Google Scholar]
- Raz N, Gunning-Dixon FM, Head D, Dupuis JH, Acker JD. Neuroanatomical correlates of cognitive aging: evidence from structural magnetic resonance imaging. Neuropsychology. 1998;12:95–114. doi: 10.1037//0894-4105.12.1.95. [DOI] [PubMed] [Google Scholar]
- Raz N, Rodrigue KM. Differential aging of the brain: patterns, cognitive correlates and modifiers. Neurosci Biobehav Rev. 2006;30:730–48. doi: 10.1016/j.neubiorev.2006.07.001. [DOI] [PMC free article] [PubMed] [Google Scholar]
- Richards M, Sacker A. Lifetime antecedents of cognitive reserve. J Clin Exp Neuropsychol. 2003;25:614–24. doi: 10.1076/jcen.25.5.614.14581. [DOI] [PubMed] [Google Scholar]
- Rosen W. The Rosen Drawing Test. Veterans Administration Medical Center; 1981. [Google Scholar]
- Satz P. Brain reserve capacity on symptom onset after brain injury: A formulation and review of evidence for threshold theory. Neuropsychology. 1993;7:273–295. [Google Scholar]
- Schofield PW, Mosesson RE, Stern Y, Mayeux R. The age at onset of Alzheimer’s disease and an intracranial area measurement. A relationship. Arch Neurol. 1995;52:95–8. doi: 10.1001/archneur.1995.00540250103019. [DOI] [PubMed] [Google Scholar]
- Stern Y. What is cognitive reserve? Theory and research application of the reserve concept. J Int Neuropsychol Soc. 2002;8:448–60. [PubMed] [Google Scholar]
- Stern Y. The concept of cognitive reserve: a catalyst for research. J Clin Exp Neuropsychol. 2003;25:589–93. doi: 10.1076/jcen.25.5.589.14571. [DOI] [PubMed] [Google Scholar]
- Stern Y. Cognitive reserve and Alzheimer disease. Alzheimer Dis Assoc Disord. 2006;20:S69–74. doi: 10.1097/00002093-200607001-00010. [DOI] [PubMed] [Google Scholar]
- Stern Y. Cognitive reserve. Neuropsychologia. 2009;47:2015–28. doi: 10.1016/j.neuropsychologia.2009.03.004. [DOI] [PMC free article] [PubMed] [Google Scholar]
- Stern Y, Andrews H, Pittman J, Sano M, Tatemichi T, Lantigua R, Mayeux R. Diagnosis of dementia in a heterogeneous population. Development of a neuropsychological paradigm-based diagnosis of dementia and quantified correction for the effects of education. Arch Neurol. 1992;49:453–60. doi: 10.1001/archneur.1992.00530290035009. [DOI] [PubMed] [Google Scholar]
- Stern Y, Gurland B, Tatemichi TK, Tang MX, Wilder D, Mayeux R. Influence of education and occupation on the incidence of Alzheimer’s disease. Jama. 1994;271:1004–10. [PubMed] [Google Scholar]
- Stern Y, Tang MX, Denaro J, Mayeux R. Increased risk of mortality in Alzheimer’s disease patients with more advanced educational and occupational attainment. Ann Neurol. 1995;37:590–5. doi: 10.1002/ana.410370508. [DOI] [PubMed] [Google Scholar]
- Sumowski JF, Chiaravalloti N, Deluca J. Cognitive reserve protects against cognitive dysfunction in multiple sclerosis. J Clin Exp Neuropsychol. 2009:1–14. doi: 10.1080/13803390902740643. [DOI] [PubMed] [Google Scholar]
- Tang MX, Cross P, Andrews H, Jacobs DM, Small S, Bell K, Merchant C, Lantigua R, Costa R, Stern Y, Mayeux R. Incidence of Alzheimer’s disease in African-Americans, Caribbean Hispanics and Caucasians in northern Manhattan. Neurology. 2001;56:49–56. doi: 10.1212/wnl.56.1.49. [DOI] [PubMed] [Google Scholar]
- Thomas AJ, O’Brien JT, Davis S, Ballard C, Barber R, Kalaria RN, Perry RH. Ischemic basis for deep white matter hyperintensities in major depression: a neuropathological study. Arch Gen Psychiatry. 2002;59:785–92. doi: 10.1001/archpsyc.59.9.785. [DOI] [PubMed] [Google Scholar]
- Vermeer SE, Prins ND, den Heijer T, Hofman A, Koudstaal PJ, Breteler MMB. Silent Brain Infarcts and the Risk of Dementia and Cognitive Decline. The New England Journal of Medicine. 2003;348:1215–1222. doi: 10.1056/NEJMoa022066. [DOI] [PubMed] [Google Scholar]
- Wadsworth ME, Hardy RJ, Paul AA, Marshall SF, Cole TJ. Leg and trunk length at 43 years in relation to childhood health, diet and family circumstances; evidence from the 1946 national birth cohort. Int J Epidemiol. 2002;31:383–90. [PubMed] [Google Scholar]
- Wechsler D. Wechsler Memory Scale - Revised. The Psychological Corporation; San Antonio: 1987. [Google Scholar]
- Wilkenson GS. Wide Range Achievement Test 3 - Administration Manual. Jastak Associates, Inc; Wilmington, DE: 1993. [Google Scholar]
- Witelson DF. Sex and the single hemisphere: specialization of the right hemisphere for spatial processing. Science. 1976;193:425–27. doi: 10.1126/science.935879. [DOI] [PubMed] [Google Scholar]